Download PDF:
Copper price jumped 14% last month before reversing its gain amid the shutdown of refineries in China that trigger concerns of refined copper shortages at a time when inventory at commodity exchange warehouses is low. The impact of the electricity shortage in China is not limited solely to copper, but also to other industrial metals such as aluminum. This makes coal prices an important barometer to watch to determine the severity of the energy shortage in China, and it will likely move alongside copper and aluminum prices – at least in the short term. In recent weeks, Chinese government has been trying to revive closed coal mines and ramp up imports from Indonesia, Russian and Mongolia, which should limit the severity and time of energy crunch.
- Gauging The Short-term Supply Demand Picture
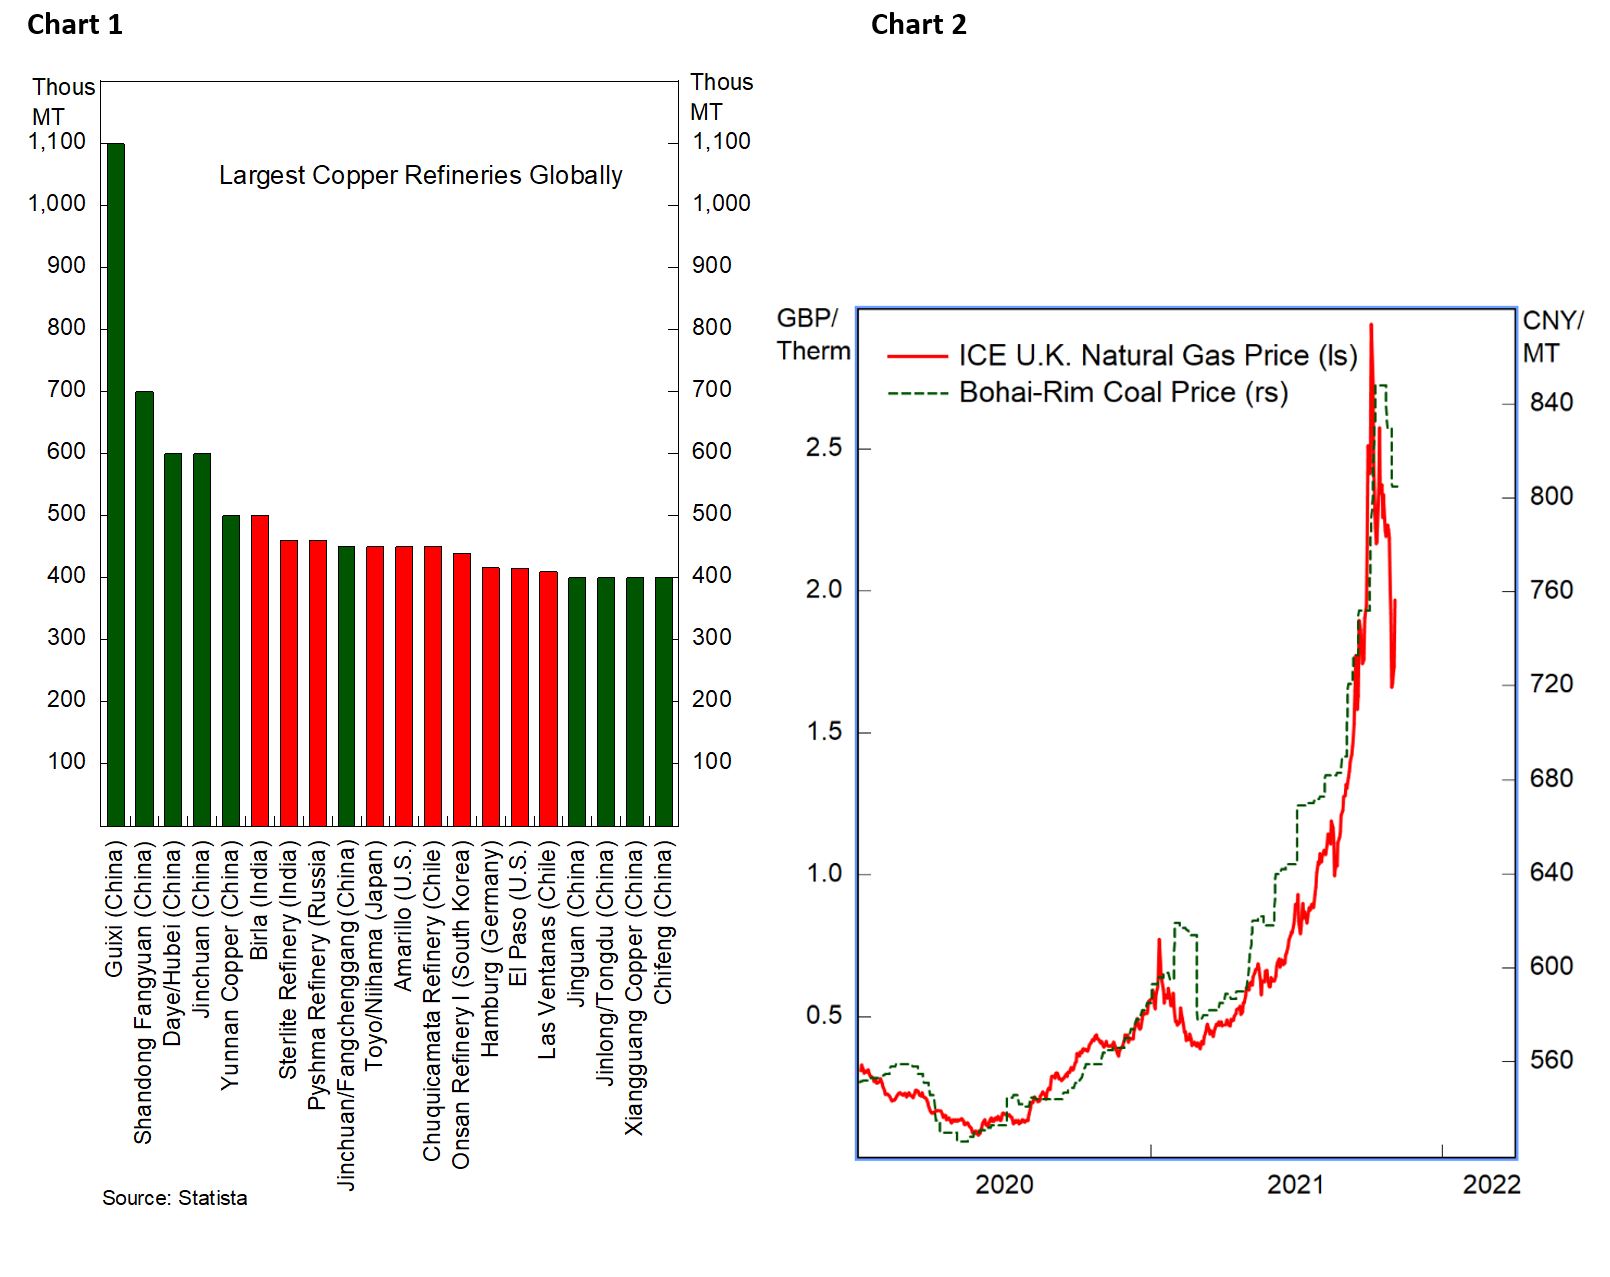
As a carbon and energy-intensive sector, industrial metal processing is a prime victim of the power cut. Chinese government has been explicit in prioritizing households’ electricity demand over industries. With China accounting for six out of ten largest copper refineries globally (Chart 1), the sharp fall in Chinese refined copper output is massively curtailing global supply of refined copper.
From supply-side perspective, the outlook for copper price hinges on whether China’s electricity shortage will moderate. In the shorter term, the pause in the surges of coal and natural gas prices seems to point to the peak of panic buying period. As Chinese government scramble to secure energy supplies, it is likely that coal and natural gas price will move lower, and metal-processing activities will resume (Chart 2).
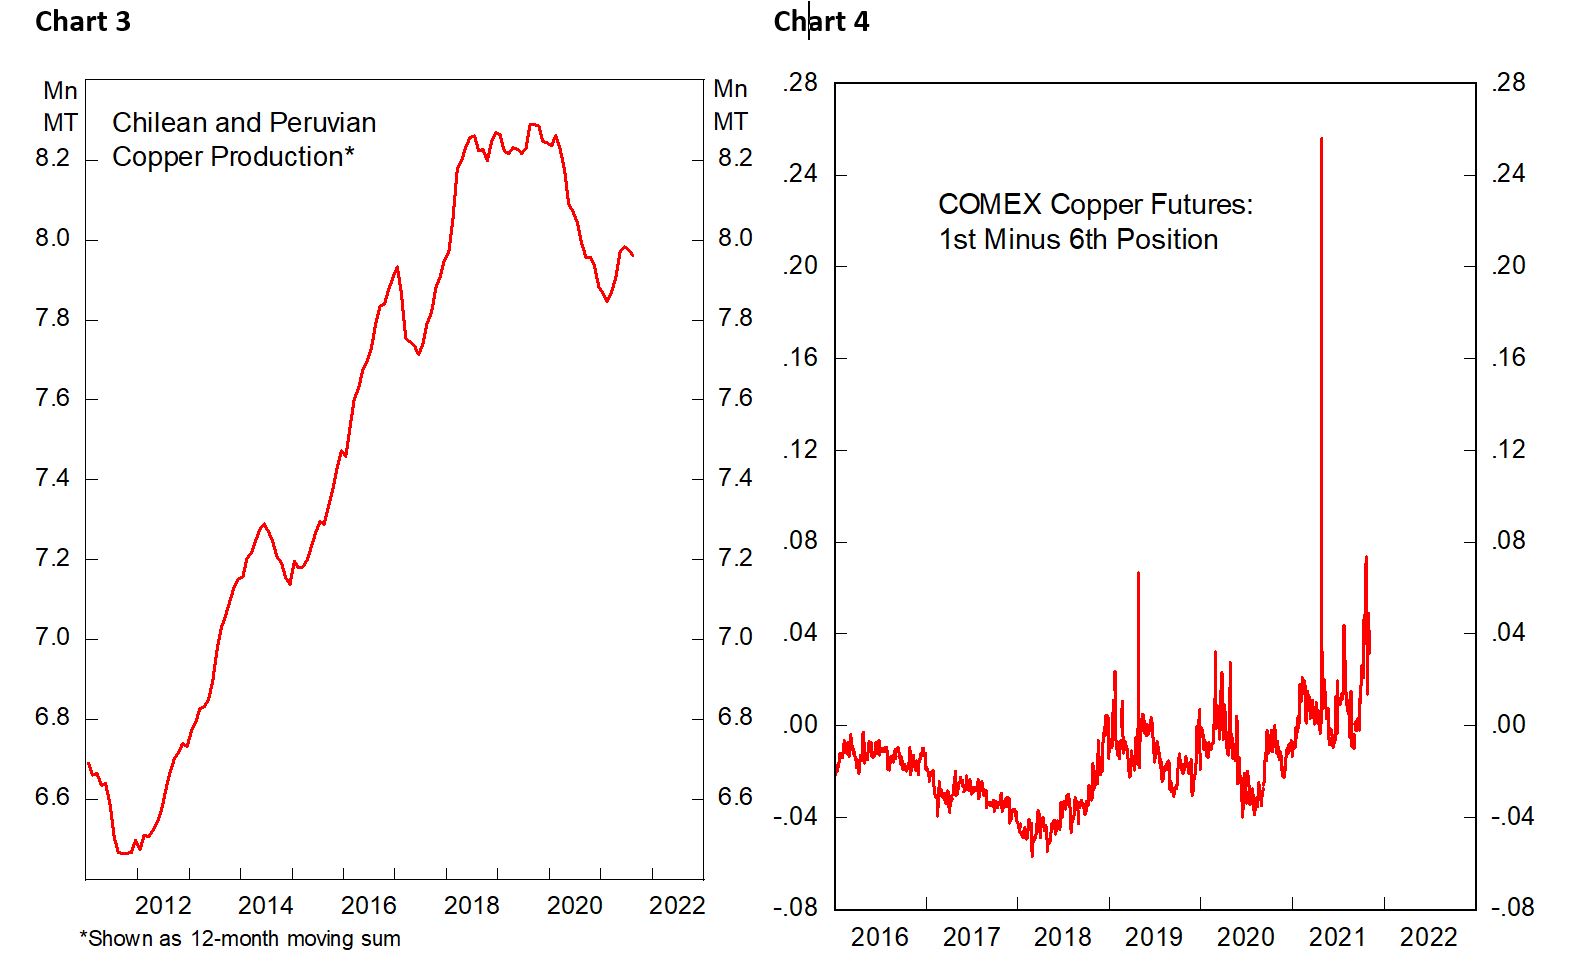
More importantly, Chart 3 shows copper production volume in Chile and Peru – two largest global copper producers – have held up well and started to rebound from the pandemic-related closure. The market seems to expect the cut off in copper shortage to be short-lived and that supply will improve in the coming months, as highlighted by the record high backwardation level in futures curve (Chart 4).
Meanwhile, the risk to copper demand remains on the downside as global growth decelerate and the liquidity crunch among Chinese property developers has not yet abated. There is no doubt that Chinese real estate activity will continue to slow down in coming months, and with developers fearing liquidity crunch they are unlikely to aggressively take on new projects, which could dent industrial metals demand in the coming years.
To quantify the impact of slowing Chinese real estate activity to copper demand, our back-of-envelope calculation shows that 15% of global refined copper demand is coming from Chinese residential building; China accounts for half of global refined copper demand and about 30% of the total consumed for residential buildings. However, we remain optimistic that long-term copper demand from EV and renewables will more than offset the slowdown in Chinese house and infrastructure building.
Outside demand from construction, copper consumption from electronics should also moderate as the world reopens. Consumer spending on electronic goods will likely stay flat or even fall this year after a spending spree last year as the pandemic forces worker to work from home, which causes chip shortages seen in the consumer electronic and auto sector.
- Inventory and Speculative Positioning
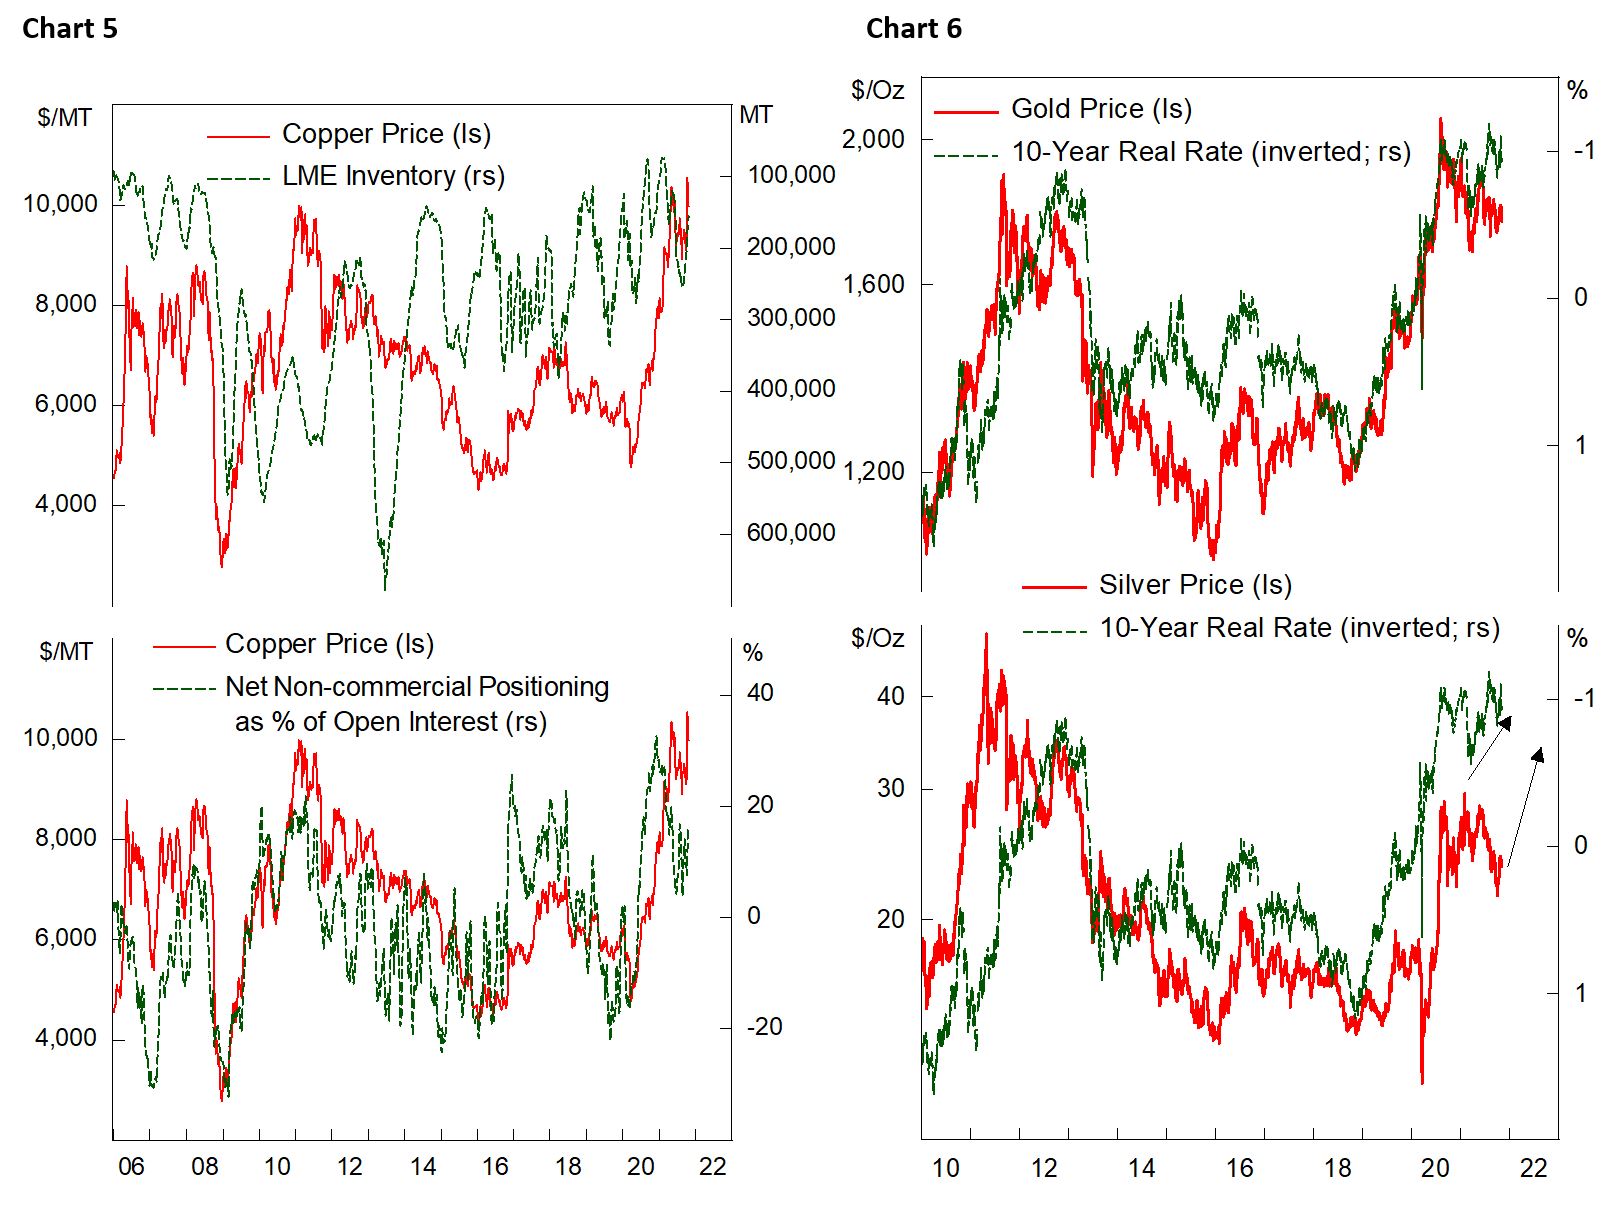
Copper inventory has been declining amid the pandemic-related mine closures at a time when consumer demand for electronics is robust and China’s post-pandemic recovery was rapid. In short, the pandemic did not significantly alter copper consumption for 2020 and 2021 but translated to lower supply, forcing a drawdown in inventory to fill the gap (Chart 5).
Meanwhile, net speculative positioning on copper has moderated from the peak in December last year. Speculators are caught off guard by the energy crisis that drove copper prices higher, which probably also forced them to cover their position and drove prices even higher temporarily.
We continue to trade copper on the short side to capture opportunities from the slowing Chinese economy and resumption of mining activities in places that previously was affected by the pandemic (Chile and Peru).
- Global Market Outlook
This week Federal Reserve announced its decision to reduce the pace of quantitative easing by $15 bn per month starting this month, which should end the program by July 2022. Unlike in 2013, current tapering message has been relayed far in advance and market responses have been relatively muted. Granted, all of EM countries’ local-currency bond yield has risen year-to-date, but this largely reflects the tightening in domestic monetary policy rather than increase in these countries’ risk premium. Meanwhile, EM ex-China stocks have been trading in range since early this year, and U.S. corporate bond yields have been behaving as well, contrary to the tantrum period in 2013.
With real yields continue to be depressed and the Fed being “patient” in raising rate, the outlook for precious metal is improving. We are betting that the probability of 10-year Treasury yield to decline to 1% is greater than it is reaching 2%, as cyclical slowdown looms and market and geopolitical risks are only going up. Meanwhile, supply shortages and elevated oil price could keep U.S. inflation breakeven to stay high around 2.5%. Taken together, this implies a 10-year real yield of -1.5% – which is bullish for precious metals, especially if the dollar turns south (Chart 6).
The greater risk comes from China’s growth deceleration, which will likely continue until at least early next year amid the lack of clear easing effort from policymakers. Our credit impulse indicator, which led the business cycle by 3-6 months, continued to hover at depressed level, and Chinese authorities remain focused on deleveraging effort and constraining credit in the name of pushing for quality growth. Based on Chinese government action so far, it is not unlikely that policymakers will only reverse their stance when the economy is already in a trouble and risk assets have sold off significantly. This means risk assets are in a dangerous period in the next 3-6 months, as the impact of policy easing will take time to materialize.
Copyright © 2021, Putamen Capital. All rights reserved.
The information, recommendations, analysis and research materials presented in this document are provided for information purposes only and should not be considered or used as an offer or solicitation to sell or buy financial securities or other financial instruments or products, nor to constitute any advice or recommendation with respect to such securities, financial instruments or products. The text, images and other materials contained or displayed on any Putamen Capital products, services, reports, emails or website are proprietary to Putamen Capital and should not be circulated without the expressed authorization of Putamen Capital. Any use of graphs, text or other material from this report by the recipient must acknowledge Putamen Capital as the source and requires advance authorization. Putamen Capital relies on a variety of data providers for economic and financial market information. The data used in this publication may have been obtained from a variety of sources including Bloomberg, Macrobond, CEIC, Choice, MSCI, BofA Merrill Lynch and JP Morgan. The data used, or referred to, in this report are judged to be reliable, but Putamen Capital cannot be held responsible for the accuracy of data used herein.
