Specialist in Global Macro and Quantitative Research
Putamen Capital considers quantitative model as an important part of our process to screen for investment opportunities and asset allocation decision. We offer two primary quantitative models for North American equity: the S&P 500 and S&P/TSX Stock Ranking. Both models aim to capture the relative fundamental improvement/deterioration of a stock relative to its universe and rank its relative attractiveness from quality and value perspective.

Methodology
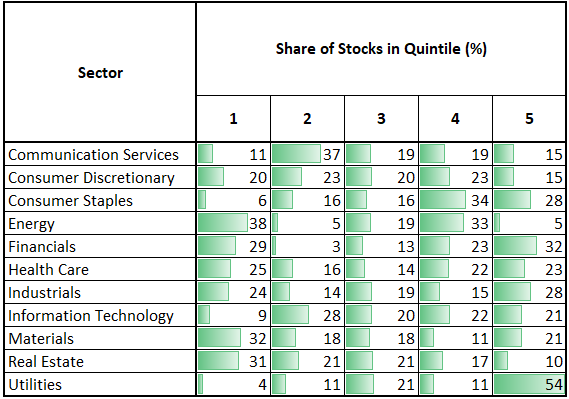
Our model use a proprietary algorithm to rank stocks in the S&P 500 and S&P/TSX into five buckets. The first quintile bucket holds stocks with the most improvement in fundamental terms relative to other stocks in the index. The fifth quintile bucket holds stocks with the greatest deterioration. In the tables below we outlined the characteristics of stocks in each of the five buckets for the S&P 500 and S&P/TSX, respectively.

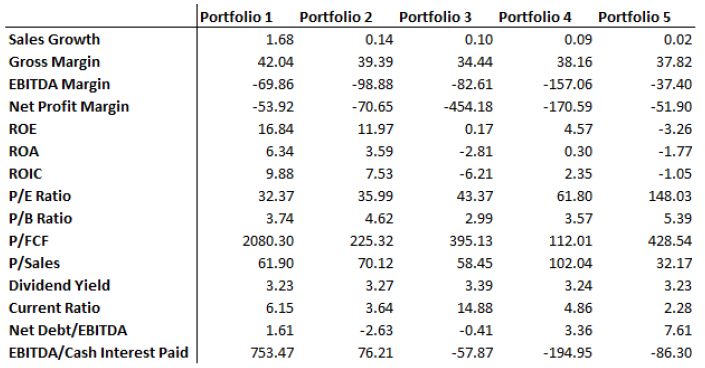
Generally speaking, stocks in portfolio 1 has greater sales growth, gross margin, EBITDA margin, net profit margin, ROE, ROA, and ROIC, all of which point to promising business outlook and a moat on its business that allows for high margins and profitability. Interestingly, stocks in portfolio 1 is also cheaper by measure of P/E ratio, P/B ratio, and P/FCF, but not in terms of P/sales. This simply reflects higher margin (E/Sales) for stocks in the first quintile bucket. These “winner” stocks also tend to pay lower dividend yield relative to other in its universe, opting to reinvest profits to its high-yielding operations. In terms of balance sheet strength, stocks in portfolio 1 have greater shorter-term liquidity at hand – as measured by current ratio – lower net debt to EBITDA ratio, and much higher interest coverage. In short, liquidity and solvency are not an issue for these stocks.
Performance
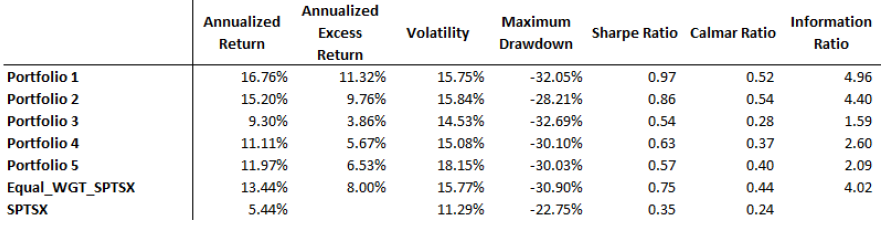
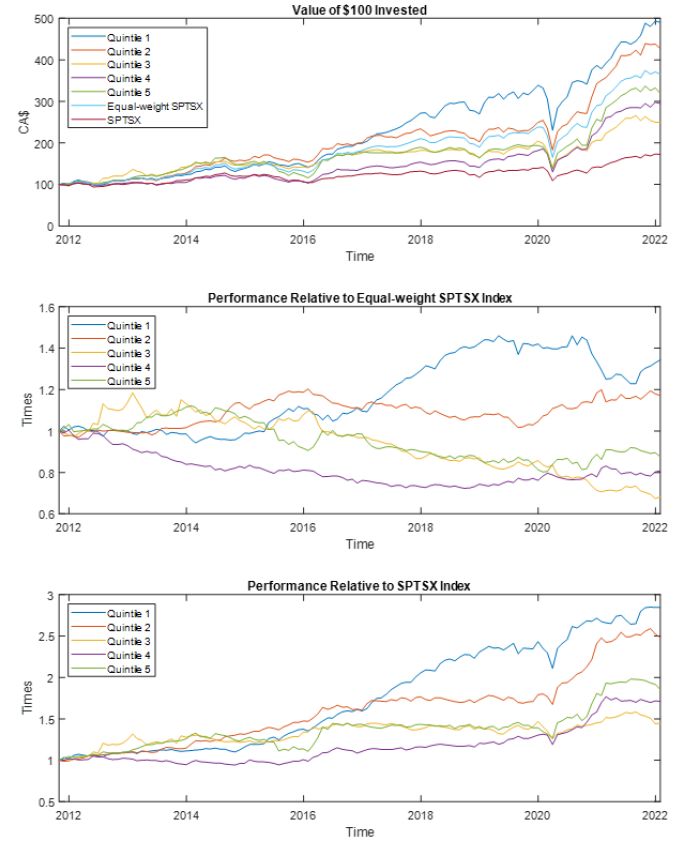
The table below shows the portfolio performance by quintile for the S&P 500 and S&P/TSX stock universe, respectively, and compares it against the equal-weight and market cap-weight benchmark. Portfolio 1, which consists of stocks in the first quintile category, outperformed the rest and both the equal-weight and market cap-weight benchmark and has the highest Sharpe ratio.
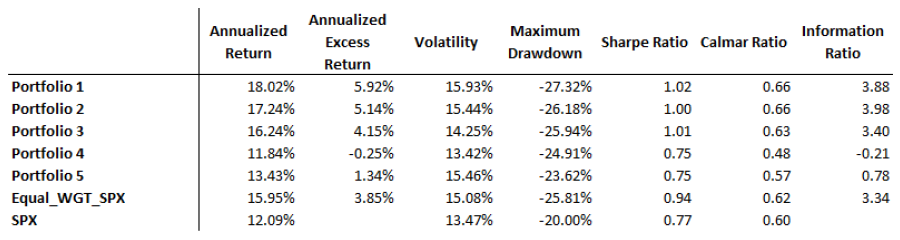
Performance of S&P 500 Portfolio by Quintile Category

Performance of S&P/TSX Portfolio by Quintile Category
Model Output
Our quantamental stock ranking model is updated monthly and will be available at the beginning of every month. Unlike other quant models that often are a black box, our model is transparent and the results could be traced to its origin. The output of our model details the drivers of a stock movement across the quintile bucket.

Download a sample of the S&P 500 and S&P/TSX Stock Ranking Model:
