Download PDF:
Part I. World’s Equity Valuation
One year after the Covid-19-induced market crash, global equity market has gone through a V-shaped recovery with stock market in many countries breaking record high level amid ample monetary and fiscal stimulus. The U.S. market valuation – now trading at cyclically-adjusted P/E (CAPE) of 32 times – is now at its two-decades high and it was only exceeded during the tech bubble, where CAPE was around 40-45 times. With the $1.9 Tn Biden stimulus potentially passing into legislation liquidity will remain plenty and U.S. equity valuation could continue to march higher, although multiples are likely to come down gradually amid the increase in long-term bond yield.
We think the risk of disappointment is currently rather high for U.S. stocks, as lofty earnings growth is already baked in the price and chances are multiples will come down from current high level rather than go further to bubble territory as the cyclical outlook improves and risk-free rate increases, contrary to last year event. Chart 1 shows a scatterplot of U.S. CAPE and the next 10-year nominal return if investors buy-and-hold the market. At 32 times, this means U.S. stocks are expected to deliver a meager 2% (nominal) annualized return in the coming decade, based on historical correlations. Of course, one could argue that the composition of U.S. stocks has changed dramatically, with IT sector and consumer discretionary accounting for 40% of the index and both sectors has historically delivered robust EPS growth despite the rich valuation. However, plotting the similar chart for each U.S. equity sector results in the same conclusion that higher current multiples bode poorly for returns in the coming decade, although for IT sector the reading still points to a solid 8-10% (nominal) annualized return based on current valuation.

For investors, the question then turned to where should I put my money now? We have been advocating EM equity for a while now, with focus on commodity-intensive countries and deeply undervalued equities, such as Chile and Turkey, whose performance have been very rewarding for our leveraged long position since last year and should continue to do well this year as global economic recovery unfolds. In our trade analysis (Table 1), we expect Turkish equity forward P/E multiple to expand from 6.5 times to 9-10 to times by the end of year. Meanwhile, EPS should be able to grow 20-40% on the back of double-digit currency appreciation and domestic earnings growth. Taken together, there is a further 50-100% upside for Turkish stocks, in our view.
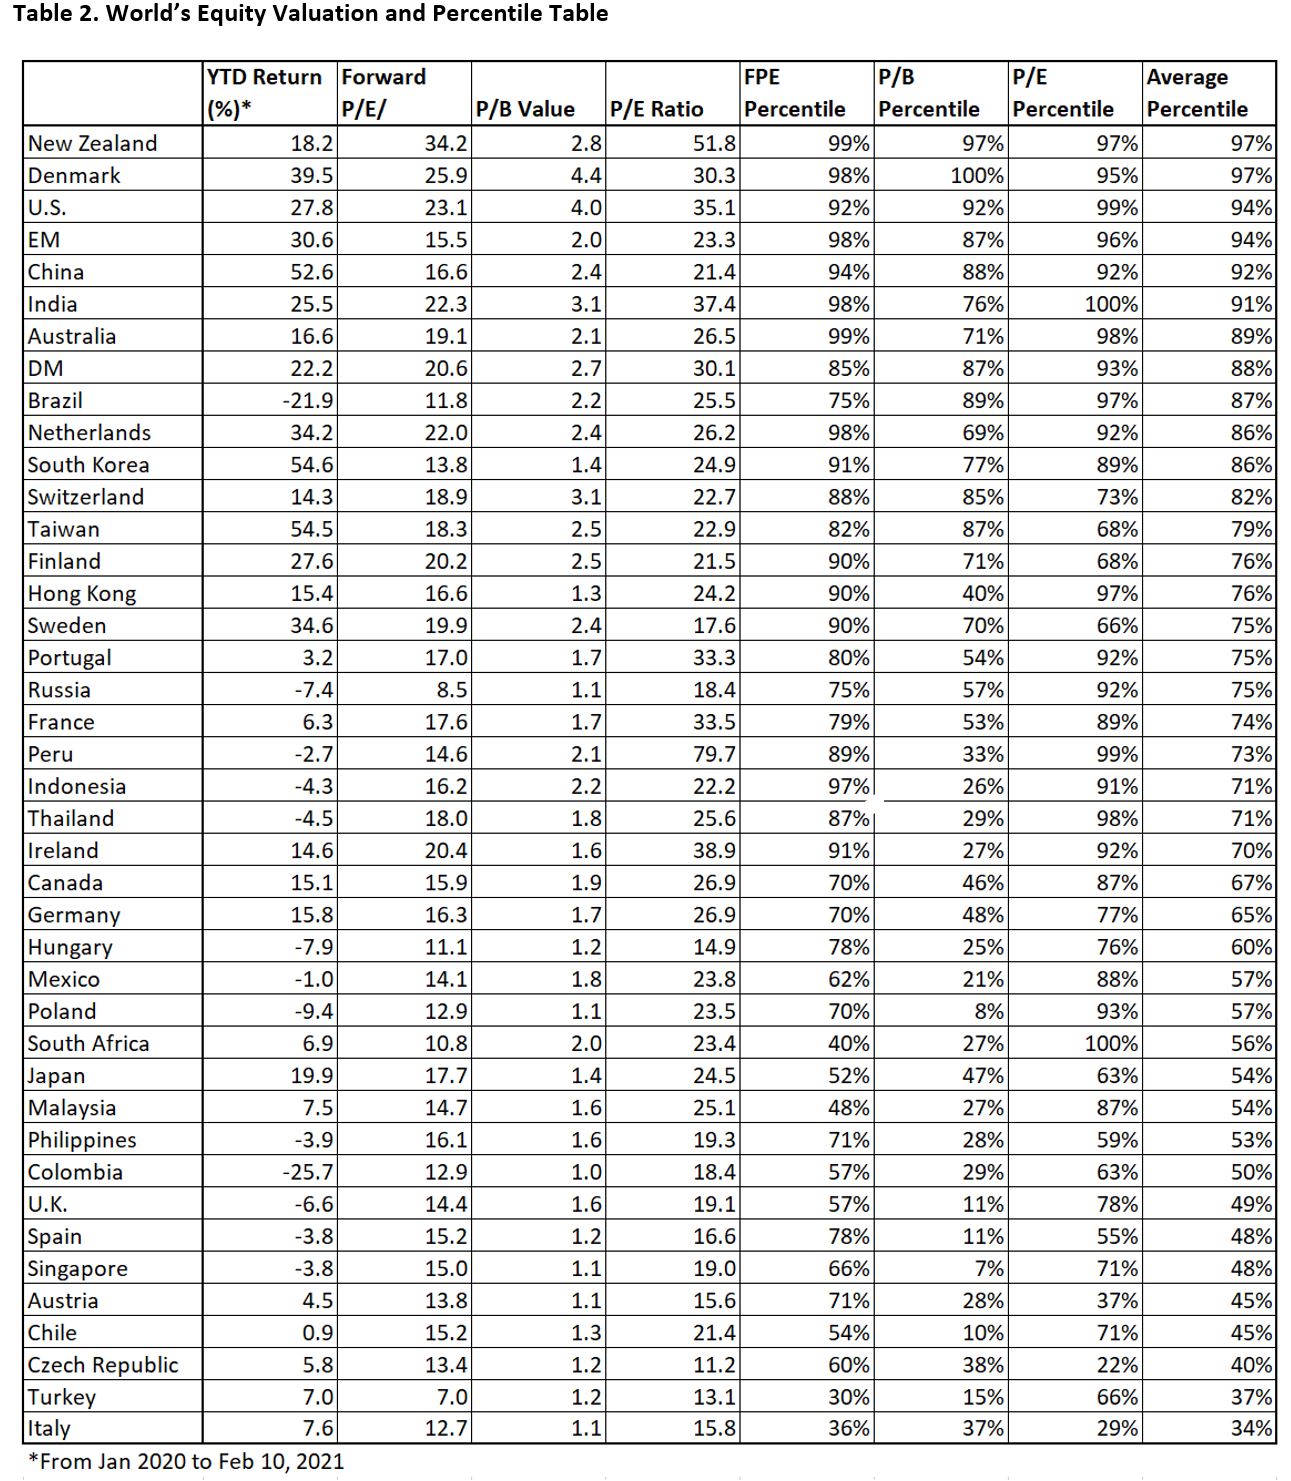
Based on respective countries’ historical multiple and expected return, we plotted the expected 10-year return of various countries in Chart 2. Our top picks – Chile and Turkey – stand at the 3rd and 5th position, following Colombia, Indonesia, and Peru. We have a constructive stance on the three countries mentioned, and on Mexico, Singapore, and Japan.

A more difficult question is when investors should start to pare down beta – if not already – and build some cash position in anticipation of a major correction, which will inevitably happen. There are several ways investors could hedge their position:
- Long core portfolio with high weighting on countries with cheap valuation and short the S&P 500 futures that are heavily weighed by high-flying tech names. Should long-term yields continue to march higher, high-duration tech stocks should suffer by more than the already cheap cyclical countries. Should yields stagnate and global monetary condition remain benign, we expect our core portfolio to outperform the U.S. market.
- Long core portfolio and buy CDS on U.S. high yield bonds. Currently the spread of U.S. high-yield is extremely tight considering the still high default risk and the risk of blown-up is high, especially once the Fed take a step back from the junk bond market. This trade is a substitute of long VIX position but at a cheaper cost. The risk lies in U.S. junk spread not widening enough amid U.S. equity falling, which would be unusual, in our view.
- A slightly unconventional hedging method would be to long put options on high-yield bonds ETF, such as HYG. The premium for 1-year ATM put options are now trading at around 5-6%. If the junk bond market corrected 20% this year, as it did last year during the rout, the hedge would return 240%. The key is then on tailoring the optimal hedge ratio to protect the core position.
The bottom line is that investors should start to think about rotating lofty DM stocks into EM, especially to commodity-rich countries that benefit from the developing super-cycle in metal prices. Chart 2 and Table 2 should provide a decent guide on where value could still be found.
Part II. Is the Rally in Oil Prices Sustainable?
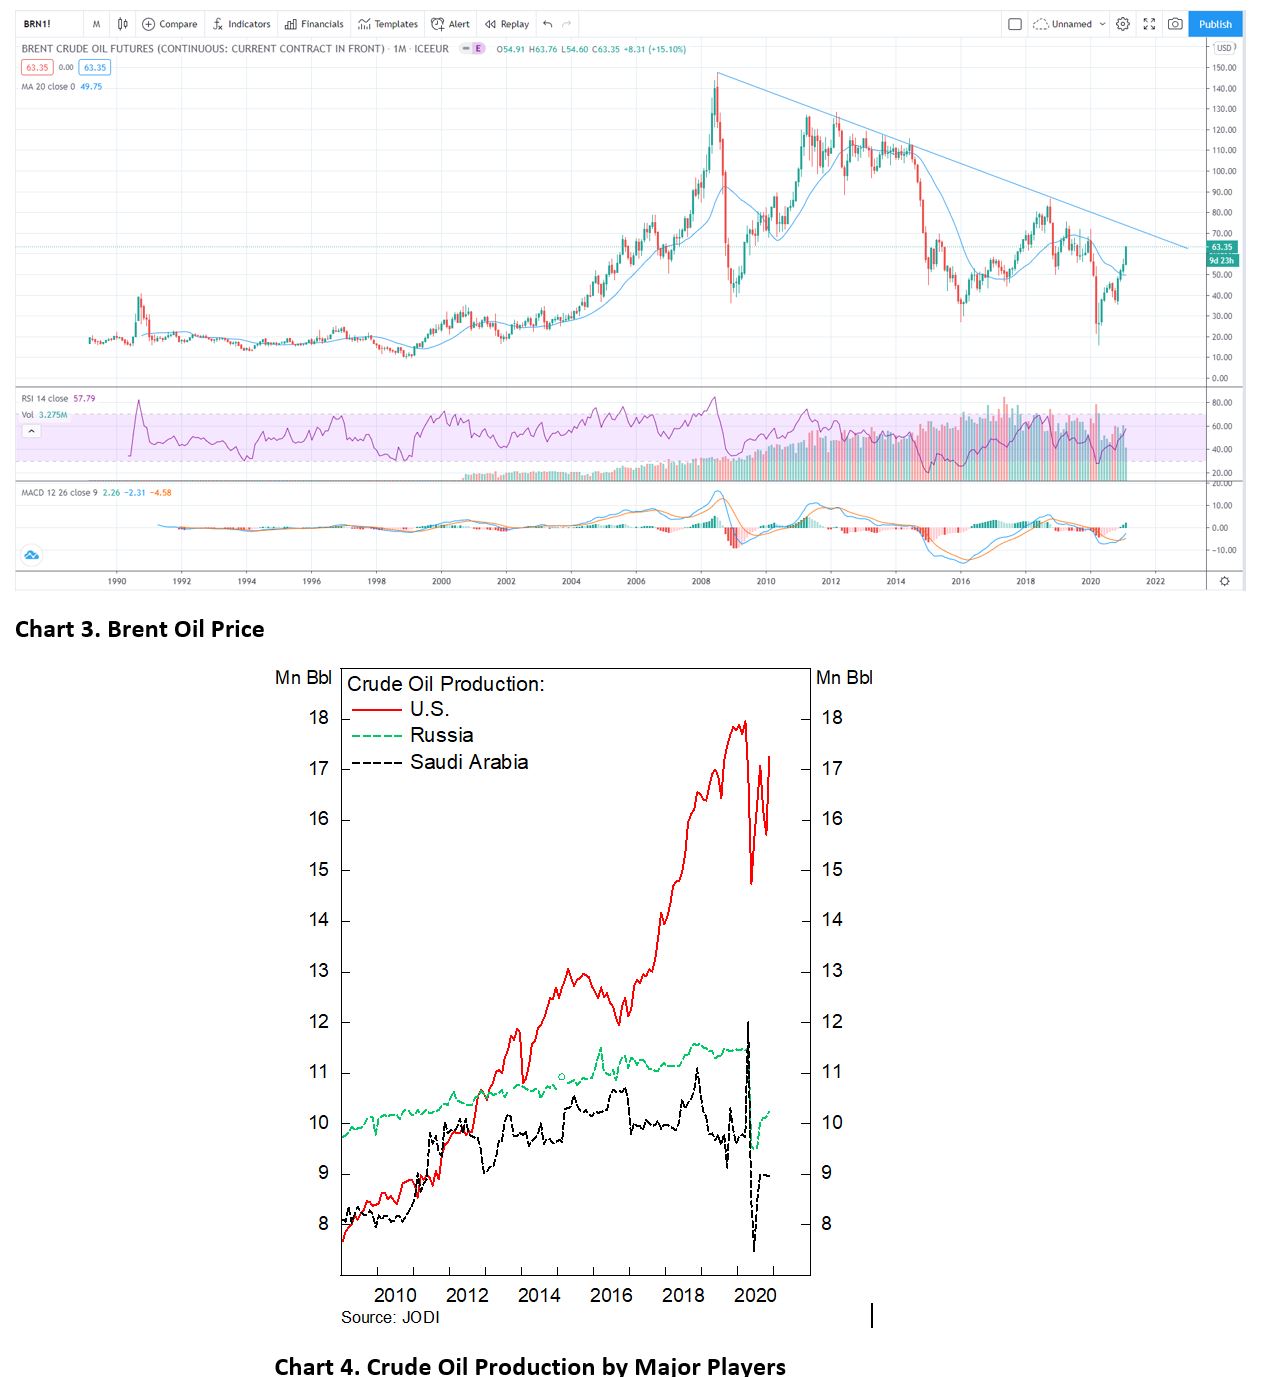
The V-shaped rebound in oil prices since last year’s meltdown has been nothing but impressive. Prices tripled over the period of less than a year and the sentiment turned bullish as Saudi Arabia has been showing greater restraint in increasing its production to offset the increase by Russia. We think there is some room for oil price to go higher, although it should face heavy resistant at $70/Bbl amid increasing production – Russia and Saudi both desperately need to produce more to plug its fiscal deficit and have room to expand production, and even U.S. productions have recovered strongly and is only 5% below pre-pandemic peak. We expect Saudi to still be the gatekeeper in production and lose market share to Russia.
We believe that discipline among producers would loosen and another price shock is not a matter of “if” but “when”. And as prices creep higher, the reward for pumping over their quota increases as well. Moreover, the realization of energy transition to renewables has only accelerated, with levelized cost of energy for solar and wind power being among the cheapest today. This means oil major stocks will continue to underperform due to the terminal value issue. Although our call in the energy space is within the consensus, the current bullish price movement offers short opportunity, i.e., long copper and short oil.
Our long copper call initiated last year has been on point, with the metals entering a structural multi-year bull market amid burgeoning demand and supply constraint. We remain positive on copper prices in the coming decade, although a nasty 10-20% correction could not be ruled out in the short-term. Moreover, we are still early in the cycle and copper should outperform relative to gold, although both could rise altogether in dollar terms.

Part III. Potential Boost in Silver Prices from Investment Demand
Interest on silver has come back to the scene since last year when the precious metal more than doubled in the Summer only to crash within weeks before slowly creeping up again. We have been publishing few arguments on the metal since last year outlining the bullish case, from both the perspective of monetary policy and real demand. This piece outlines the bullish argument from ETF demand, which has seen dramatic acceleration in the past year.
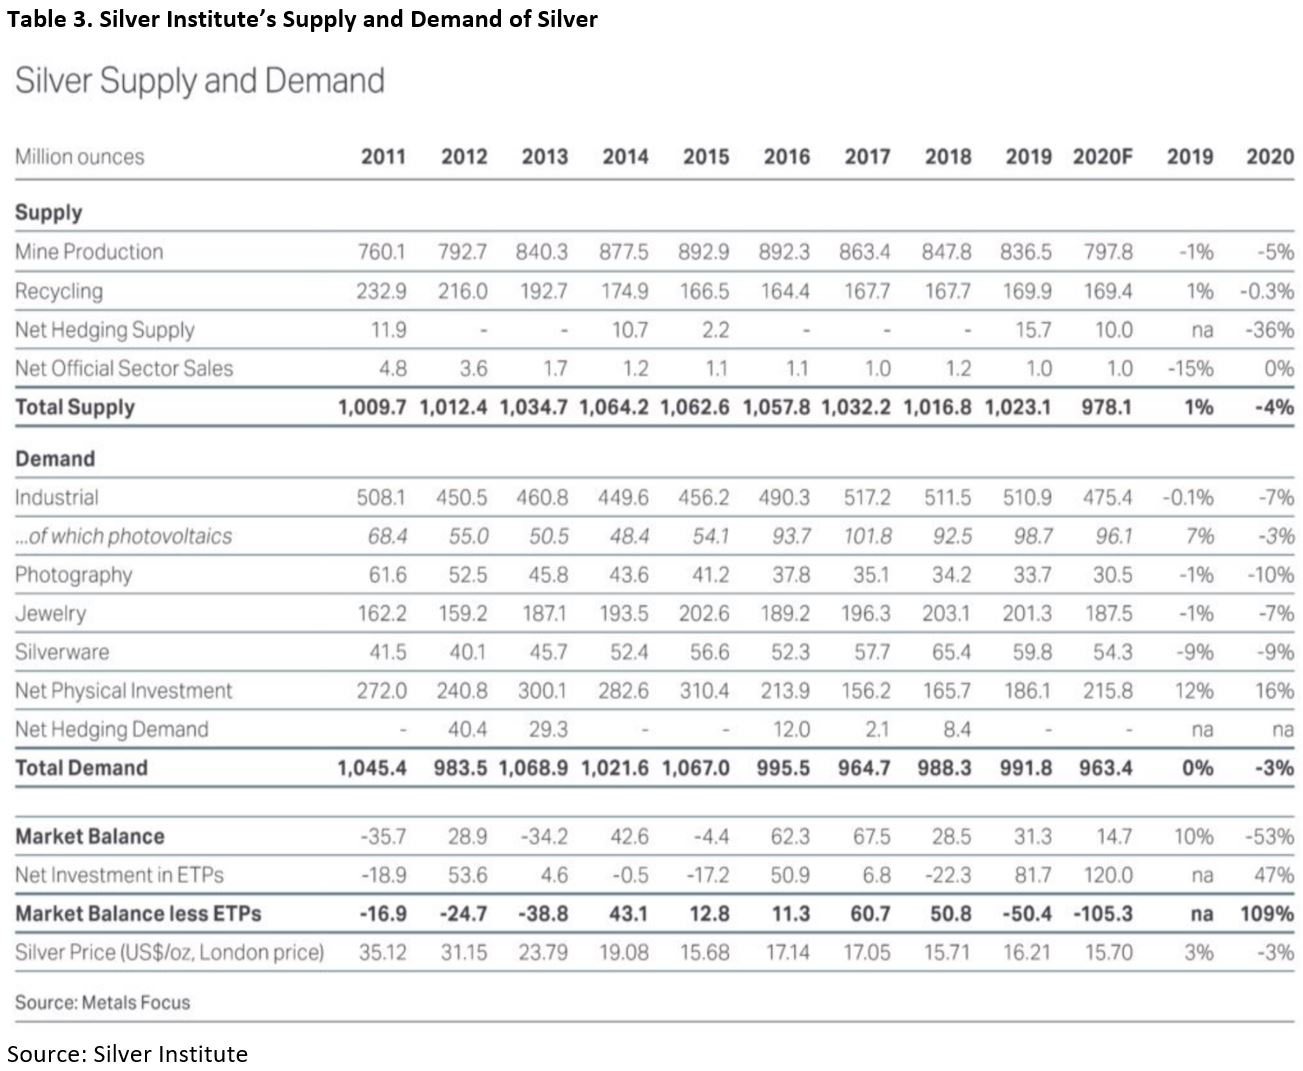
The Silver Institute, an industry body studying the demand-supply of silver and supported by major silver players, detailed that supply of silver since 2011 has been flat at 1 billion ounces annually while demand – including physical investment demand – has declined somewhat from 1.05 billion to 991 million in 2019, equal to a net balance of deficit/surplus of +/- 70 million ounces annually (Table 3). This, however, excludes the demand coming from Exchange Traded Products (ETP/ETF) that provides exposure to silver, such as SLV, PSLV, and SIVR – there are other ETF giving exposure to silver, but are either miners or are providing exposure through futures as the underlying.
There are three key points worth mentioning:
- Silver supply has stagnated in the past decade as capex spending in the commodity space overall has dried up in the past decade amid low prices. Ramping up productions, from the process of identifying silver reserves to refining, takes time and increasing amount of silver must be produced at increasing cost due to declining ore grade – both cash cost and all-in sustaining cost of silver miners have crept up, with the median of AISC around $11-12/Oz. All this points to supply rigidity in the medium term and potentially large increase in profit for miners if silver spot prices remain or rise further.
- Assuming supply and demand today as the average of the past decade –1034.8 Mn Oz and 1014.08 Mn Oz, respectively – that translates to a net (excess) supply of 20.7 Mn Oz annually before accounting for demands from ETF products. The question, then, is how large or important is Silver demand from ETF products? Chart 6 and 7 show capital flow to silver ETF in the past 12 months in dollar terms and ounce equivalent, respectively. In the past year alone, $7 Bn has flown to three silver ETFs, which is equivalent to 250 Mn Oz of silver if all the ETFs are backed 1:1 by physical. As many had suspected, it is becoming increasingly difficult for ETF managers to secure 250 Mn Oz of silver – when total supply is only four times that amount – without driving price significantly, which will become a tailwind as interests on the precious metal increases. So far, there is no credible proof that any ETF is not being backed by physical silver.
- Contrary to popular beliefs, the market cap of silver ETF is not particularly large, at around $19 Bn or 700 Mn Oz (Chart 8 and 9). It is equivalent to less than a year of production and has only become popular in the past 15 years. Should investors’ interest continue to rise at the current rate, it is not unthinkable for silver ETF demand to multiply and drive prices much higher.

Copyright © 2021, Putamen Capital. All rights reserved.
The information, recommendations, analysis and research materials presented in this document are provided for information purposes only and should not be considered or used as an offer or solicitation to sell or buy financial securities or other financial instruments or products, nor to constitute any advice or recommendation with respect to such securities, financial instruments or products. The text, images and other materials contained or displayed on any Putamen Capital products, services, reports, emails or website are proprietary to Putamen Capital and should not be circulated without the expressed authorization of Putamen Capital. Any use of graphs, text or other material from this report by the recipient must acknowledge Putamen Capital as the source and requires advance authorization. Putamen Capital relies on a variety of data providers for economic and financial market information. The data used, or referred to, in this report are judged to be reliable, but Putamen Capital cannot be held responsible for the accuracy of data used herein.
