Since early this year, we have been adamant in our view that the U.S. economy will decelerate rapidly this year amid the combination of the rise in the dollar, yields, and oil price, which all amount to a growth tax for the economy. There is little doubt that the manufacturing PMI surveys will show a contraction in activity in the coming months, which should continue to be a headwind for equity and commodity prices (Chart 1). The sharp fall in 10-year yield and further curve inversion seen last week further corroborate the view that the U.S. economy is slowing down quickly at a time when monetary policy will continue to tighten – with the Fed likely to raise another 75 bps in the next meeting.

This is a time when the job of a portfolio manager is becoming more difficult. Whereas three months ago the market had not priced in a looming growth slowdown and valuation was at an elevated level, the market has corrected by double-digit this year, valuation is close to long-term average, and sentiment has turned decisively bearish. This, however, does not mean that the correction in risk assets is over. First, the bottom-up consensus estimates on earnings remain too high, in our view, amid margin pressure from rise in raw material prices and wages, slowing revenue growth, and strong dollar. Although the 9.1%yoy headline inflation should help nominal revenue growth for most companies, we doubt that firms could completely pass-through the input cost inflation to consumers, who are becoming more price sensitive as their real income declines (Chart 2).
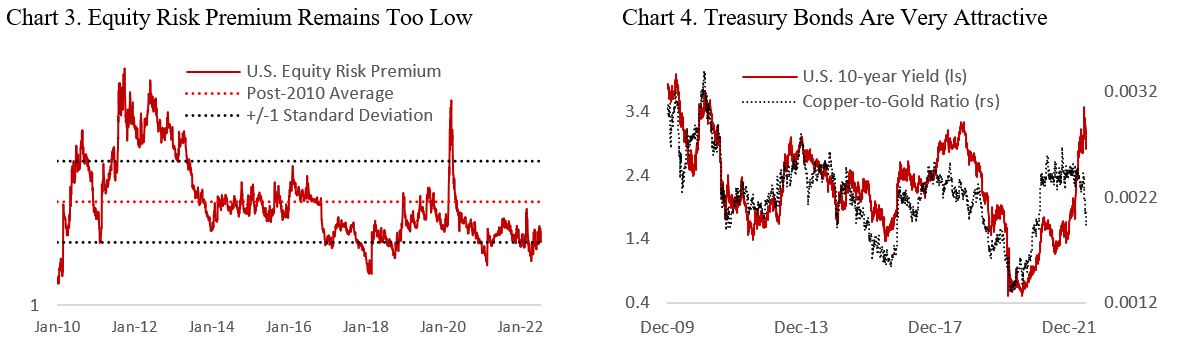
Second, equity risk premium remains too low in the face of growing risk from recession and potential blow up in the credit market (Chart 3). The number of zombie companies in both the U.S. and globally has only risen since the pandemic, and it is important to remember that despite the still-strong balance sheet and healthy interest-coverage due to companies extending their loan terms at favorable rate in 2020-21, majority of IG issuers is concentrated in the BBB rating that is vulnerable to a downgrade to junk. Note that a rise in equity risk premium could be driven by a combination of a decline in equity multiple – in this case forward P/E ratio – and fall in Treasury yields (10-year). We have been bullish on bonds for some time now (ref: May/June publication) and continue to believe that 10-year Treasury yield will trade closer to 2% by the end of the year (Chart 4). This is good news for equity and investors holding a balanced portfolio as equity earnings yield (inverted forward P/E) has to fall by less as Treasury yields fall (bond rally).
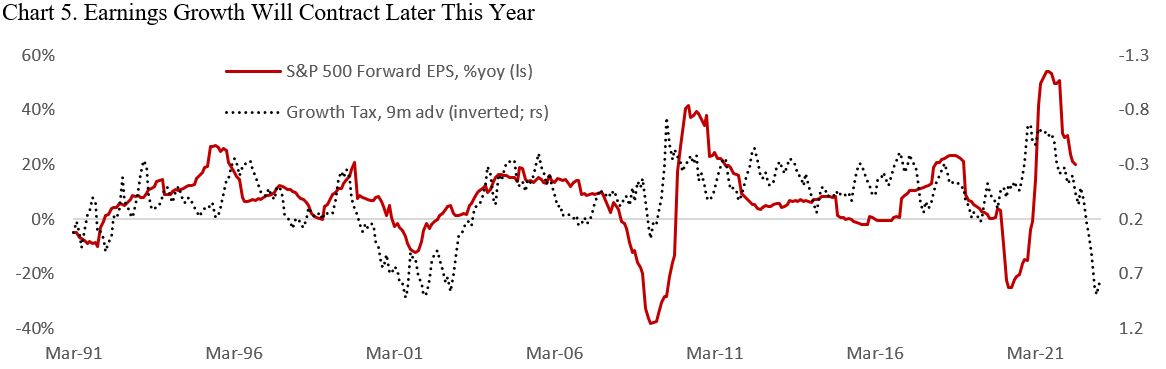
A bear market rally in risk assets, as we have seen over the past two weeks, could not be ruled out, but as U.S. economic growth slows corporate profits will eventually decline as well. With analysts only starting to downgrade their earnings estimates over the past few weeks, the topic du jour is on how bad growth/earnings will decline and whether the Fed will be forced to pause its monetary tightening earlier than the market is currently pricing. Our prediction for the former is a decline of at least 10% (Chart 5). To answer the latter, we need to monitor the development in three economic variables: employment, inflation, and consumer demand.
First, we think that a softening in labor market condition is increasingly likely. Vacancy rates have topped out and is set to decelerate rapidly as growth slows (Chart 6). Anecdotally, we have also seen companies shifting to lower gear in hiring, with nearly all the big tech companies – Microsoft, Google, Apple, Amazon – implementing a hiring freeze, while automakers such as Ford and Stellantis have announced outright layoff. There is no doubt that as the economy weakens further in the second half of the year more companies will follow. Already, June’s PMI surveys showed that the employment component for both manufacturing and services are both in a contractionary level – highlighting the softening in labor demand (Chart 7).

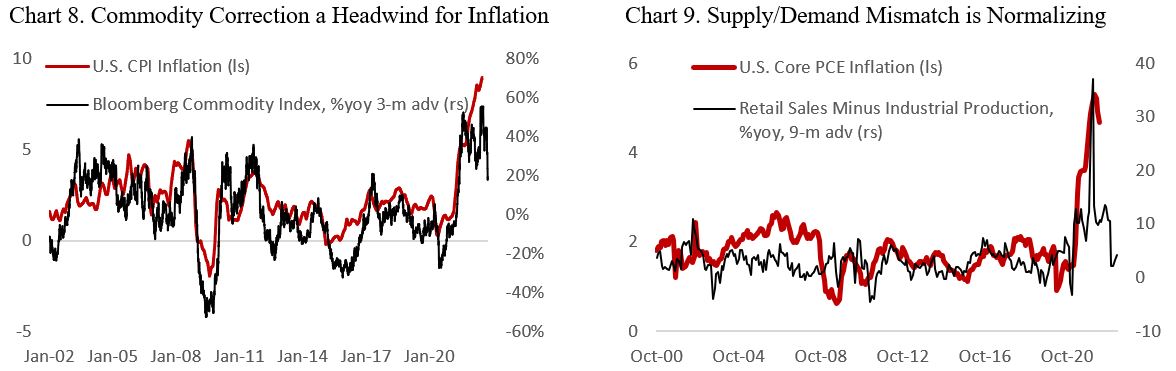
Second, we will have greater clarity on the potential peak in inflation in the coming months. Although the service component will likely continue to rise in the near term, we believe that the correction in base metal, energy, agriculture prices, and normalizing supply-chain will drive headline CPI much lower in the coming six months (Chart 8). Without a renewed growth impetus coming from China, a strong rebound of commodity prices is unlikely this quarter and the country will export deflation to the rest of the world. More importantly, there are signs that the high inflation we currently experience would not last into 2023, as goods demand falls relative to supply. Whereas during the pandemic consumers – unable to go out to a restaurant or travel – have spent their stimulus check on goods, we now see demand normalizing as the world normalizes. At the same time, both industrial production and supply-chain are coming back to life to meet those demand. Taken together, this should lead to a much lower inflation in the coming quarters (Chart 9).
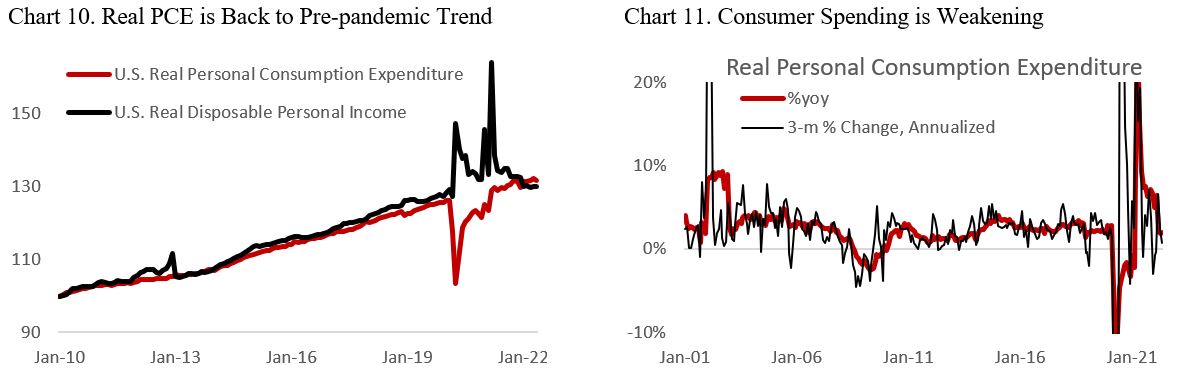
Lastly, it is important to monitor the strength of consumer demand as the sector accounts for 70% of the economy. Following the expiration of government stimulus program, real disposable income of U.S. consumers is now back to only pre-pandemic level (vs trend), and consumers are now saving less as the cost of living rises (Chart 10). With inflation rising at a rate above wage growth and the labor market weakening, real income could stay negative for the rest of the year – a headwind for consumer demand. This entrenches the view that inflation will come down as demand softens (Chart 11).
Taken together, the weakening labor market and high likelihood for consumer demand to soften highlight the risk that the economic slowdown could turn into a recession, which is also highly dependent on the trajectory of inflation and Fed’s policy. In our base-case scenario, we expect inflation to decelerate meaningfully to under 5% in the coming 9 months and for the Fed to stop hiking rates before the end of the year.
Connecting the Dots into a Coherent Portfolio Strategy
The question for investors then is how to position a portfolio tactically to take advantage of the shift in macro conditions. Due to the deteriorating growth outlook and potential for earnings decline, the risk for equities remains high while Treasury bonds are very attractive, especially if we are correct that inflation has peaked. Chart 12 shows that the change in stock-to-bond ratio tend to coincide with the manufacturing cycle, and it has structurally trended higher over time. Referring to our thesis that the manufacturing PMI likely contracting in the coming months (Chart 1) we continue to believe that stock-to-bond ratio has plenty of room to drop, a thesis we have held since June 6th.
We are forecasting a 28% decline in the ratio, which could be accomplished through a combination of a rally in bonds and fall in equity. Should 10-year yield decline to 2%, long-term bonds portfolio (TLT ETF) could rise by 15%, leaving equity to do the rest of the adjustment by falling 13% from current level (SPX: 3450). Note that this would only bring the stock-to-bond ratio back to its long-term trend, with further undershoot possible – with the adjustment likely coming from further fall in equity.

Sector Implication: Remain Defensive, but More Positive on Growth Names
Although we continue to see downside risk for equities, we are seeing early signs of potential cyclical/defensive rotation across sectors, which could mark the early phase of equity market bottom. One notable development over the past month is that high-multiple growth stocks have stopped underperforming the benchmark while energy and materials stocks are selling off, a sign that market focus is shifting from multiple deratings amid Fed tightening to slowing growth outlook. With bond yields moving lower, the headwind to high-multiple growth stocks is abating.
Chart 13 shows that the underperformance of cyclical relative to defensive is late on a rate-of-change basis, which warrants closer monitoring if the ratio break higher. For now, however, the risk to cyclical stocks remains to the downside as earnings of growth-sensitive sectors are more vulnerable to downward revision and the yield curve continue to invert (Chart 14).

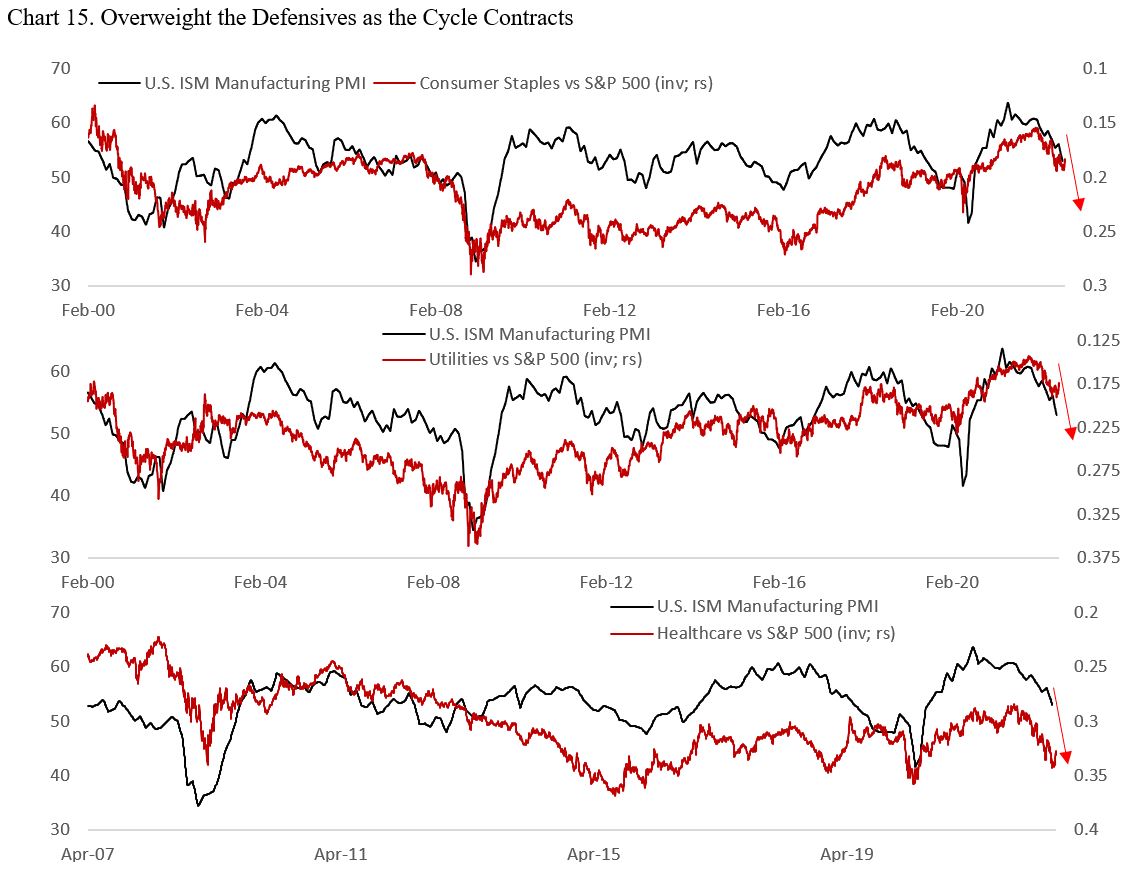
To determine equity sector positioning, we look at each sector individually and relative to others based on three metrics: sensitivity to the business cycle, valuation, and margin resilience. Based on the former and the latter, we remain overweight on defensive sectors such as consumer staples, utilities, and health care (Chart 15). Among the three, we are most positive on health care due to the sector’s more attractive valuation (Chart 16) and lower correlation to the business cycle. Moreover, health care has also shown higher margin resilience during periods of economic downturn (Chart 17).

Among the more cyclical sectors, we maintain our positive view on both energy and materials. Both sectors have given up significant chunk of their outperformance this year amid the unwinding of “war premium” and fear of recession, but the supply-demand outlook is still supportive of high prices and free cash flow yields are attractive even at current spot prices (Chart 18). However, it is important to note that among the two, materials will face greater headwind due to higher sensitivity to global business cycle and weak Chinese growth outlook. Within materials, we prefer gold over copper exposure as gold price will likely be the first one to rally once the Fed eases monetary policy and real yields decline.

Financials and consumer discretionary are two sectors where we continue to be underweight. Consumer discretionary valuation, both based on cyclically adjusted P/E and forward P/E ratio, is rich and the sector has historically suffered the most during business cycle downturn (Chart 19). Meanwhile, financials are trading cheap but is vulnerable to rising credit losses as consumer balance sheet weakens and downturn in investment banking revenue.
The risk/reward profile for communication services, info tech, and industrials have improved amid valuation de-rating and the sectors now trading close to or below historical median on both absolute and relative basis (Chart 20). However, info tech and industrials could not yet be considered as cheap, and they are not immune to margin pressure. A benchmark-weight on these sectors is warranted.

Outlook on Currencies: Fed Remains on the Driving Seat
The U.S. dollar continue to strengthen over the past quarter on the back of a more aggressive Federal Reserve relative to other global central banks and rising risk aversion in the market, despite being overvalued based on real effective exchange rate. The risk to the dollar remains to the upside as the Fed is committed to bring inflation down and tighten monetary policy further, although a downward repricing of the Fed rate hike is possible if global economy softens more than expected – a headwind for further dollar appreciation.
In the near term, the Fed has few incentives to limit current dollar appreciation as a stronger currency should help to curb import price inflation and drive commodity prices lower. With headline inflation still accelerating in June, the Fed will continue to deliver outsize rate hike and curb demand until price pressures are clearly peaking and trending back to its 2% target, with the U.S. central bank likely still ahead of both ECB and BOJ.
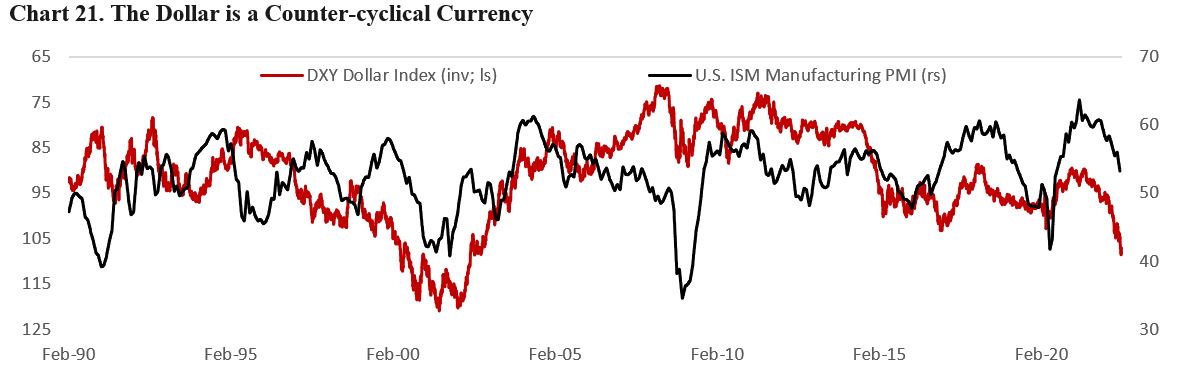
Meanwhile, investors should not ignore the impacts of previous rate hikes and quantitative tightening that have pushed financial conditions significantly tighter relative to the beginning of the year. The downward pressures on the economy will become increasingly visible in the second half this year. Chart 21 shows that the dollar historically moved inversely to the business cycle – we expect ISM manufacturing surveys to drop into contractionary level (below 50) in the second half of the year.
The performance of major global currencies vs the dollar this year could be explained primarily by rate differentials vs the U.S. (Figure 2). Japanese Yen depreciated the most as BoJ remains stubborn on maintaining a dovish monetary policy and its yield curve control while the euro is weighed down by the war in Ukraine that drives energy cost much higher for the continent and limits ECB’s ability to tighten policy without pushing the economy into a recession. Meanwhile, both AUD and NZD are facing downward pressure from weak Chinese growth. Corrections in coal and iron ore prices are headwind, especially for the former, and the outlook of these commodities hinge on the Chinese policymakers’ ability to reflate its economy. Closer to home, the Canadian dollar fare relatively better due to the elevated oil price and also a hawkish BoC as domestic inflation surged.
Aside from rate differentials, commodity prices and terms of trade are also major drivers of currencies. Recent correction in commodity prices bode poorly for commodity exporters currencies such as CAD, AUD, NOK, and SEK. Interestingly, Scandinavian currencies have been punished hard this year despite their central banks also raising rate aggressively and oil price remain at an elevated level. The NOK and SEK might be pricing the geopolitical risk premium related to the war in Ukraine.

Bottom line: the dollar will remain firm in the near term as the Fed is ahead of other global central banks and capital flows back to the U.S. in search of safe-haven assets. Japanese Yen will likely benefit the most from Fed’s dovish turn later this year if inflation trend lower to 2% target and oil price normalize to $70-80/bbl.
