The U.S. and global stock market have officially entered the bear market in June following upside surprises on U.S. inflation that was followed by the Fed having to raise its interest rate by 75bps – contrary to Chairman Powell’s comment that such size of hike is not on the table weeks earlier. Monetary conditions have tightened dramatically as bond yields surged, and consumer, business, and investor sentiment are unanimously bearish. On the bright side, the U.S. economy remains in a healthy state and the labor market is strong, which support the argument that recession could be avoided. However, inflation is pressuring household purchasing power and corporate margin, which could curtail consumption and business investment in the second half of the year – dragging growth much lower.
Since early this year, we have taken a defensive approach in managing our portfolios by underweighting cyclical and high-multiple growth stocks while overweighting staples, utilities, energy, and materials. We believe that the correction has brought down equity valuation to a reasonable level and despite the potential for near-term downward revision in earnings, longer-term outlook is solid, which historically is an attractive entry point to accumulate equities (Figure 1). With the major indices having corrected over 20% from their peak, in-line with previous bear market average, equities could be close to a bottom. In this section, we outline the good, bad, and ugly of today’s macro and market environment, and their potential investment implication.

The Good: Valuation, The Fed, and Easing Input Cost Inflation
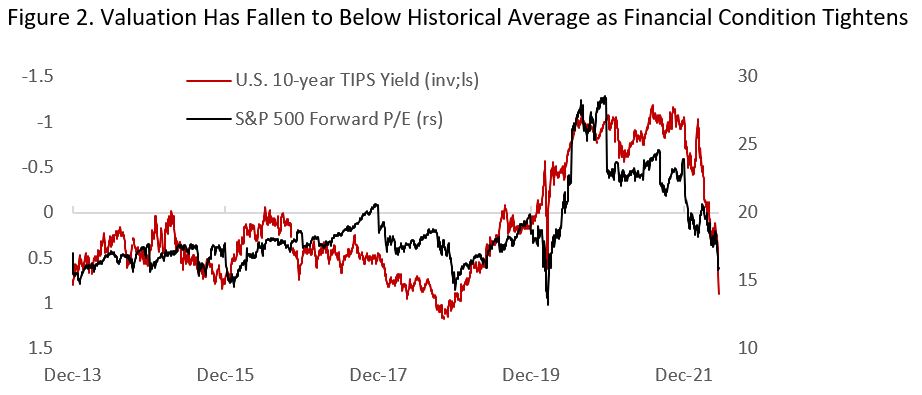
The first and foremost from the correction in risk assets is that valuation has moderated significantly from a frothy level (Figure 2). As inflation spiked and the Fed turned aggressive in tightening monetary policy, real yields rose from -1.2% in August 2021 to +0.6% currently – a dramatic tightening by historical standard. This has coincided with the rise in corporate bond spreads and correction in forward earnings multiple for stocks; S&P 500 forward P/E ratio fell from 28x to 15x currently, on par with historical average. The risk/reward of investing in equities have turned in favor of investors who could weather potential short-term volatility.
Second, following a period when the Fed is deemed to be behind the curve – with inflation breakeven rising above central bank target while real yields stuck at all time low – we don’t think this is still the case today (Figure 3). Real yields have spiked to near decade’s high and inflation expectation has not revisited its recent high despite the upside surprise in inflation. Whereas previously the concern was mainly on inflation, the focus is now shifting towards growth concern as well. Meanwhile, the yield curve is close to inverting, which implies overly tight financial conditions.

Lastly, there are signs that both supply-chain disruption and labor demand is easing, which could drive lower goods inflation and wage demand going forward. ISM manufacturing PMI employment component is on a contractionary level while supplier deliveries continue to move lower in May (Figure 4). This combined with cooling goods demand as services spending normalize and falling consumer confidence could mean demand to fall significantly in the second half of the year.

The Bad: Consumer Demand, Business Spending, and Earnings Outlook
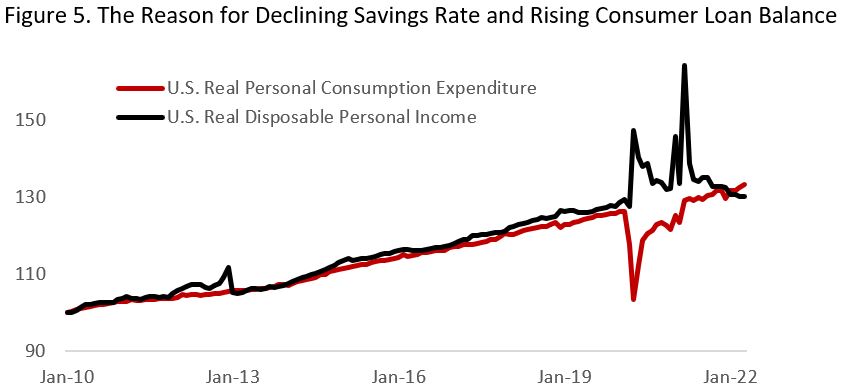
Dramatic decline in consumer confidence to decade’s low reflects the deteriorating outlook for consumer demand in the second half this year. With CPI inflation is rising faster than wages (negative real income growth), households have to draw on their excess savings accumulated during the pandemic to maintain their spending (Figure 6), which is reflected in the decline of personal savings rate to 4.4% in May and rising consumer loan balance. More worryingly, we expect stimulus measures to ease the burden of high energy, food, and shelter cost to be limited as the U.S. government and the Fed weigh the risk that it will stoke inflation further higher.
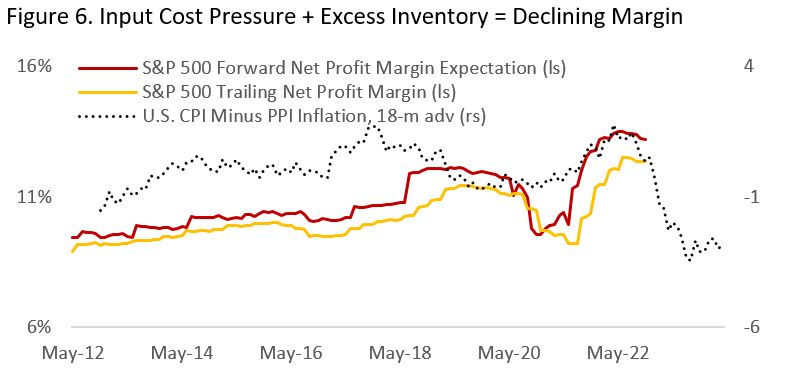
Inflation does not only impact consumer’s spending power, but also pressure corporate margin as companies are not able to completely pass through the increase in input cost to consumers. The gap between consumer and producer price index, which is a proxy of what a company could charge and its production cost, is now pointing to a much lower corporate margin (Figure 5). This is further compounded by several companies reporting excess inventory in their balance sheet amid demand for such goods cooling off. Although the impact could be one-off only, this will likely weigh sentiment towards equity in the upcoming earnings season. Moreover, business investment is set to moderate following two years of strong expansion with companies in select sectors reporting excess capacity – Amazon excess warehouse space is a good example.
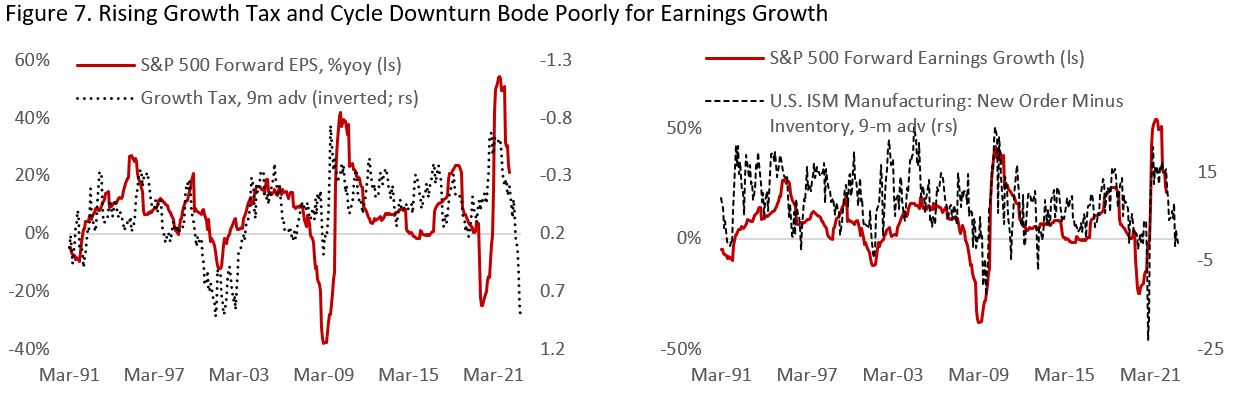
Lower consumer spending and business investment mean revenue growth will fall as margin suffers from rising input cost and wages. Figure 7a shows that growth tax – a combination of the dollar, 10-year yield, and oil price – historically led S&P 500 forward earnings growth by about 9 months and is currently pointing for a contraction. Figure 7b shows a more optimistic scenario for equity earnings. Either way, this has yet to be reflected in market’s earnings consensus.
The Ugly: Tail Risk on Oil Price, Housing Market, and the Fed
The ugly part in today’s environment reflects the tail risk related to the war in Ukraine, major downturn in the housing sector, and Fed’s policy mistake. In the case of any of these risks materializing, it will likely trip the economy into a recession alongside further decline in risk assets.
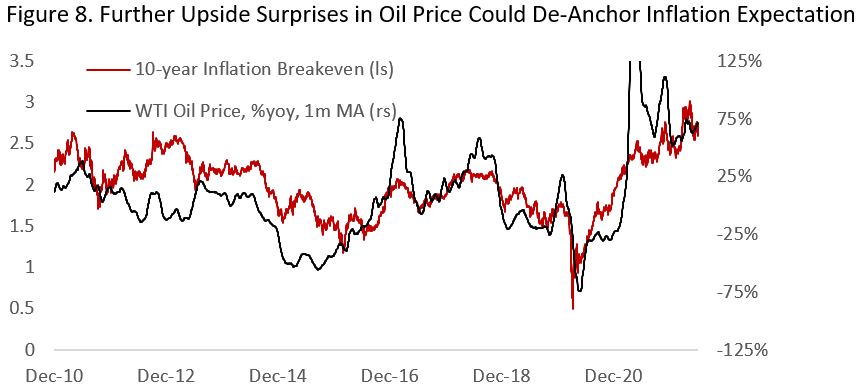
Aside from the supply-chain issues, a large portion today’s inflationary pressure could be attributed to the rise in food and energy prices, alongside the second and third-round effect from latter. This makes what currently happening in the Ukraine-Russia war important, on top of the supply-side response to high oil price. A rise in oil prices to above $150/bbl could throw the global economy into a recession through demand destruction and the Fed having to become even more aggressive to prevent inflation expectation from becoming unmoored (Figure 8).
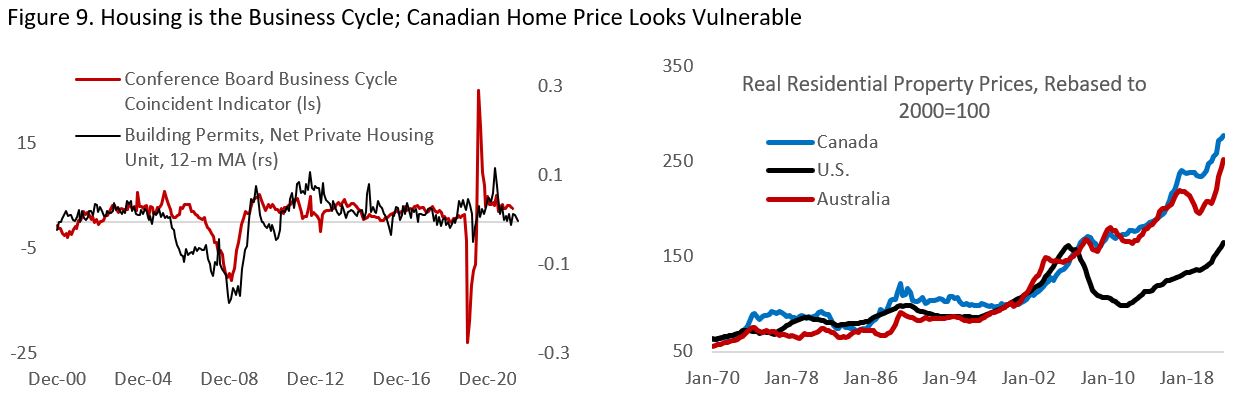
The housing market is also showing signs of vulnerability with mortgage rate above 5% level. Due to the importance of housing, housing-related activities, and its wealth effects, the sector is a leading indicator of the business cycle (Figure 9). Both housing sales and prices are declining over the past several months in Canada and the U.S. and will continue to be weighed down by slowing growth and tight financial conditions. Canadian households are particularly vulnerable due to their higher leverage and its property price being among the most expensive in the world, with price-to-income and price-to-rent ratio of 143x and 154x, respectively, compared to 120x and 127x for the U.S. A major slowdown could feed into a negative loop of lower consumption and growth while the central bank unlikely to come to the rescue if inflation stays high.
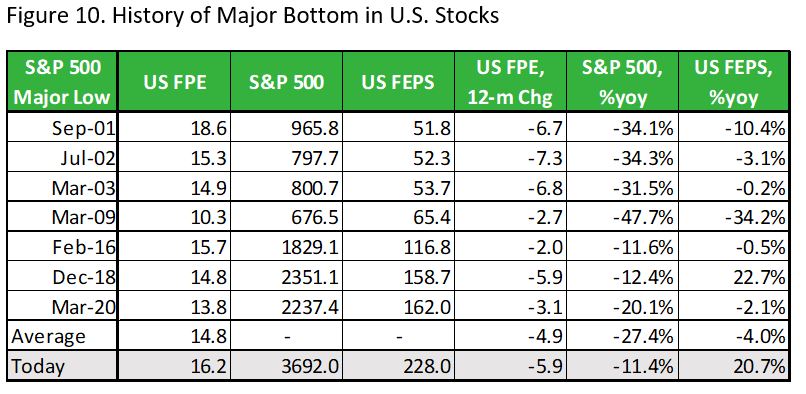
The biggest tail risk today is that if for whatever reason inflation is being stickier than expected and the Fed has to engineer a recession to bring it down, this would be catastrophic for risk assets as both earnings and equity multiple could decline materially further. Figure 10 shows that among S&P 500 major bottom, forward P/E average at 14.8x and forward earnings average at -4% y-o-y with a wide dispersion among the sample. Should forward earnings consensus decline by 10% and multiples fall to 15x, this imply S&P 500 level of 3.300.
The bottom line is that the outlook for both the economy and financial market depends on the inflation number released in the coming months. We will continue to be nimble in managing our portfolios while observing the signposts for bottom in risk assets. For long-term investors, the most important thing to remember is that return expectation has only improved following the 20%+ decline in equities.
Takeaway for Asset Allocation Strategy:
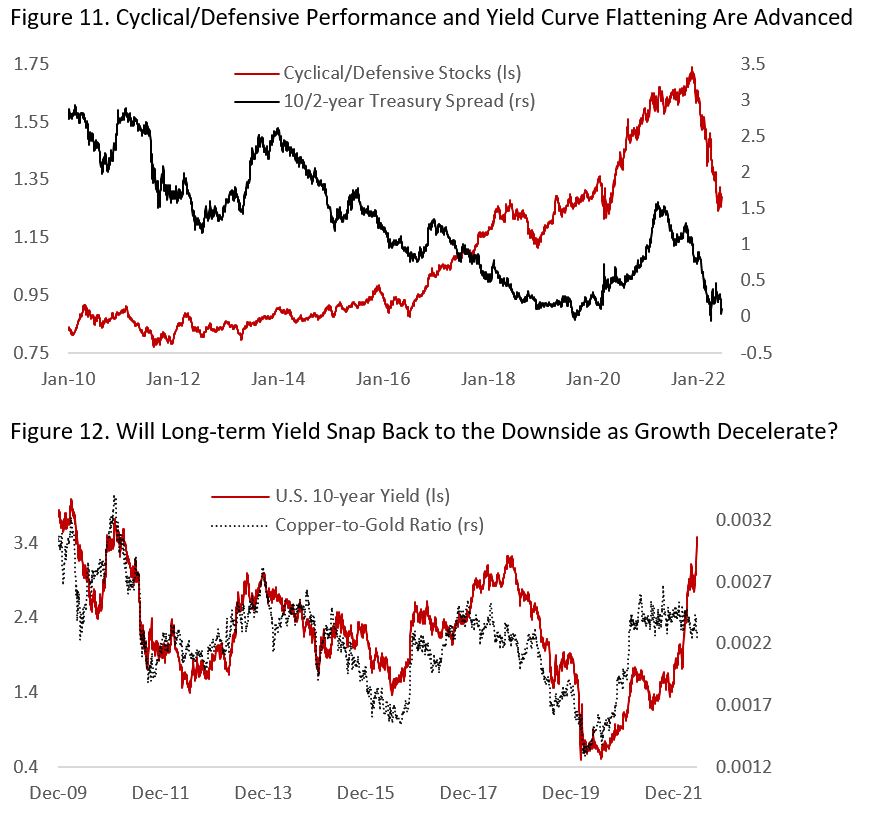
- Equities are now closer to a bottom and cyclical stocks underperformance is long in the tooth (Figure 11). If inflation indeed start to fall in the coming months, market pricing on Fed rate expectation could fall dramatically and growth and cyclical stocks could start to outperform again.
- If inflation does fall in the coming months amid moderating goods spending and easing supply-chain issues, long Treasury bonds position is very attractive (Figure 12).
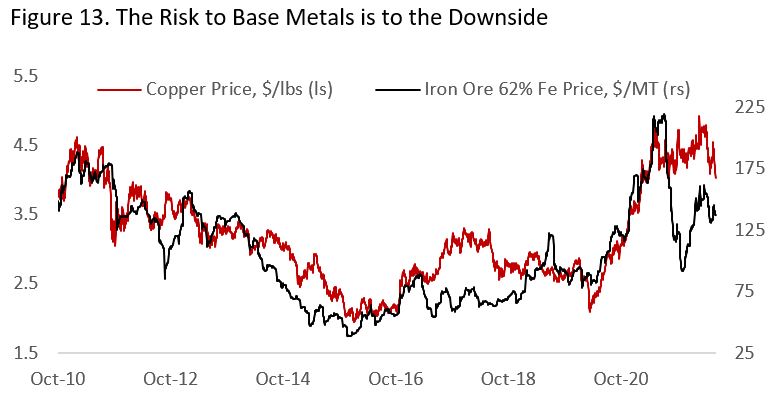
- Peaking long-term yields and weakening dollar could be a boon for precious metals. Remain short copper/gold and underweight industrial metals exposure amid softening global cycle and low probability of a strong rebound in the Chinese economy (Figure 13).
Copyright © 2022, Putamen Capital. All rights reserved.
The information, recommendations, analysis and research materials presented in this document are provided for information purposes only and should not be considered or used as an offer or solicitation to sell or buy financial securities or other financial instruments or products, nor to constitute any advice or recommendation with respect to such securities, financial instruments or products. The text, images and other materials contained or displayed on any Putamen Capital products, services, reports, emails or website are proprietary to Putamen Capital and should not be circulated without the expressed authorization of Putamen Capital. Any use of graphs, text or other material from this report by the recipient must acknowledge Putamen Capital as the source and requires advance authorization. Putamen Capital relies on a variety of data providers for economic and financial market information. The data used in this publication may have been obtained from a variety of sources including Bloomberg, Macrobond, CEIC, Choice, MSCI, BofA Merrill Lynch and JP Morgan. The data used, or referred to, in this report are judged to be reliable, but Putamen Capital cannot be held responsible for the accuracy of data used herein.
