Sentiment and technical analysts are bullish. Fundamental and macro analysts are bearish. This captured the tone among the sell-side research I read in the past three weeks. The equity market 15%+ bounce from mid-June low has made several strategists turned bullish on risk assets, believing that we have seen the low of the cycle. The extremely depressed sentiment and elevated cash positioning in June, which historically marked the low in past cycle, further lend credibility to the thesis that we are entering a new bull market. We are skeptical and think that growth scare and potential recession is still ahead of us. Our growth tax indicator continues to indicate a marked slowdown in the coming 9 months and earnings revision will continue until mid-2023. Meanwhile, QT has just begun and the impact to liquidity has yet to be felt, for reasons discussed below. We believe that macro condition in the next 6 months will continue to be a headwind for equities as growth slows and liquidity tighten, which will be increasingly felt going into 2023.
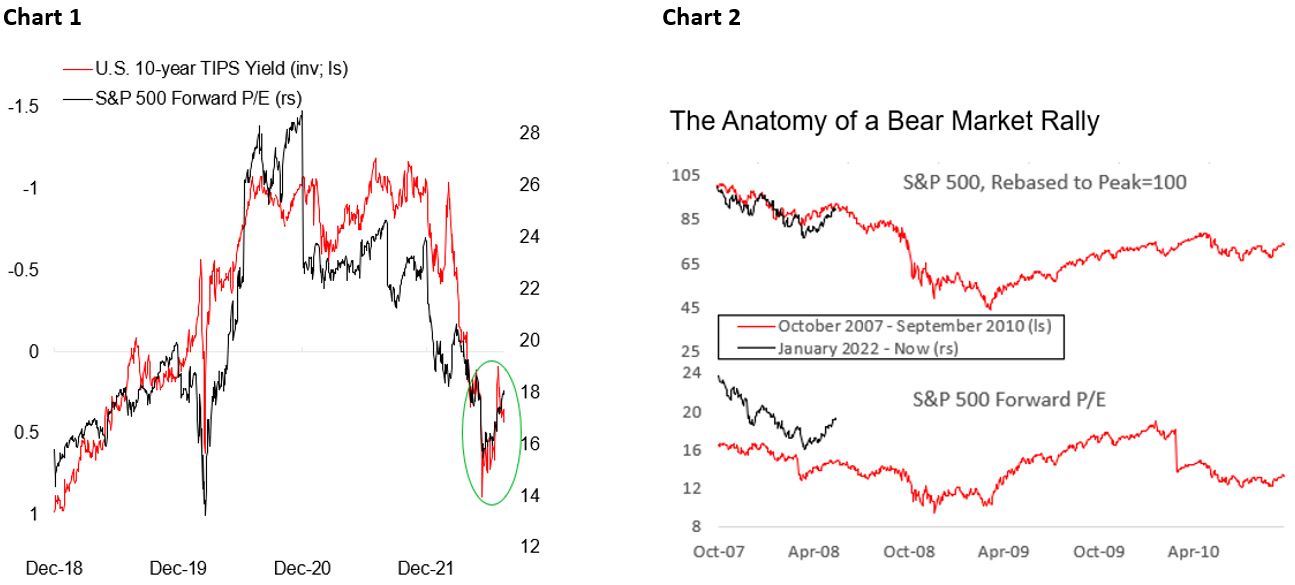
We categorized the recent rally in equity as an unwinding of the extremely bearish sentiment seen in mid-June, where short sellers have also been reducing their position to ease the pain on their book as equity rallies (Chart 1). Rate-sensitive growth names in the discretionary and IT sectors have led the equity rally while energy and materials have been the largest underperformers over the past 8 weeks, which tells use that the equity rally is largely driven by the expectation of Fed dovish pivot. Fundamentals, however, are moving against the equity rally. Q3/Q4 and 2023 earnings continue to be downgraded – and we believe it has just begun – and S&P 500 forward earnings has risen to above 18x, above its 16x long-term average. It is important to note that a countertrend rally similar to the one we have seen over the past 2 months is just a part of the bear market (Chart 2).
The rally in equities made it easy to think that we have seen the worst of the rout in risk assets and that the outlook ahead will by sunnier. This could not be farther from the truth. Chart 3 shows that we are still in the early phase of the downturn in U.S./global business cycle and that industrial production and equity earnings will continue to face headwinds, at least in the next 6-9 months. I saw the current bounce in risk assets as a great opportunities or investors to de-risk, raise their cash balance and increase allocation to government bonds.
Note that we have been bearish on risk assets since the beginning of the year amid bubbly valuation in January amid deteriorating growth outlooks. We have maintained this position throughout the year until today and remain convinced that the correction in risk assets is not yet over for two main reasons: earnings will continue to fall as top-line growth falls and margin is under pressure from cost and wage inflation and the effect from monetary policy tightening will only be increasingly felt in the second half of 2022.

For analysts who are arguing that a recession could be avoided due to Fed potentially turning less aggressive, the odds are not in their favour. Chart 4 shows that in the past 3.5 decades, an inversion of the 10/2-year spread has always been followed by recession. Currently high inflation makes it harder to argue that the Fed will not overtighten this time around. In fact, the inversion in the yield curve is now more extreme compared to prior the Global Financial Crisis. The saving grace is that China – which has always been the first-in/first-out in the past two decades – has been ramping up stimulus to prop up the very weak domestic demand, which should lead to a stronger copper/gold ratio and risk assets next year. But it is important that this time around, however, China is battling against the decline in their working-age population, property crisis, private sector crackdown, and rising rivalry with the U.S.

Growth: Cloudy with a Chance of Recession
To back up our thesis that U.S. growth will continue to decelerate in the coming quarters, we analyze the demand outlook of the three major demand drivers in the U.S.: consumer spending, business investment, and government fiscal. Chart 6 highlights the decline in U.S. household savings as consumer spending continue to rise alongside the nominal disposable income. In other word, Americans have been saving less in order to finance their spending habit – which account for 70% of GDP. In real terms, the situation is even worse. Personal disposable income has been declining as government stimulus ebbs (Chart 7), which probably partially explains the back-to-back two quarters GDP contraction in 2022H1.

There is no doubt that U.S. consumers are bearish on the outlook of the economy and seen deterioration in their personal finance. Retail sales data, however, argues against the contrary (Chart 8), which could be explained by the savings accumulated by U.S. households during the pandemic (Chart 9). In total, U.S. consumers saved around $2.7 Tn during the depth of the pandemic and has only spent around $190 bn since the beginning of the year – when excess savings flipped from positive to negative. It is also important to note that the distribution of this excess savings is dominated by high-income families, with low-income households’ deposit balance already starting to decline to pre-pandemic level. The bottom line is that U.S. consumers are flushed, but inflation is eating their purchasing power and deterioration in employment condition could put further pressure on consumer demand.

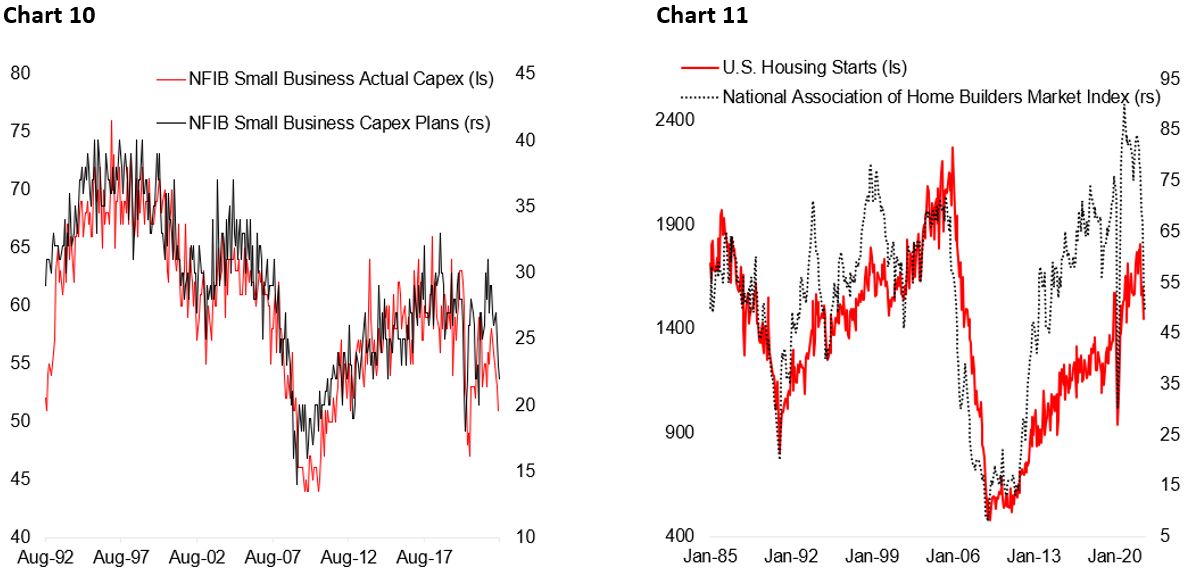
The second largest demand driver for the U.S. economy is business investment, which account for only 20-25% of GDP but plays a large(r) role in determining the business cycle due to its higher volatility. Outside recession, business capex accounts for an average of 1% of GDP growth annually, but during recession it could detract up to 2% of GDP. Following a strong investment during the pandemic amid cheap financing and surging demand, businesses are now less upbeat as consumer demand is expected to slow (Chart 10). More importantly, residential construction activity has also slowed due to deteriorating affordability amid rising mortgage rate and house price in the past two years (Chart 11). Similar to the consumer sector, it is unlikely that business investment will strengthen in the next 6-9 months especially that monetary policy will become tighter, and margins are under pressure from rising input cost and wages.
Lastly, government fiscal remains a drag for growth in 2022H2 and 2023. Biden’s administration has little appetite and chance of passing a fiscal stimulus package in the near term as bringing inflation down remains the highest priority among elected officials. This could become worrisome next year if growth turns out to be weaker than expected while inflation remaining above Fed’s 2% target, as it increases the probability that fiscal and monetary policy will be too small and too late out of fear triggering another surge in inflation (Chart 12 and 13).

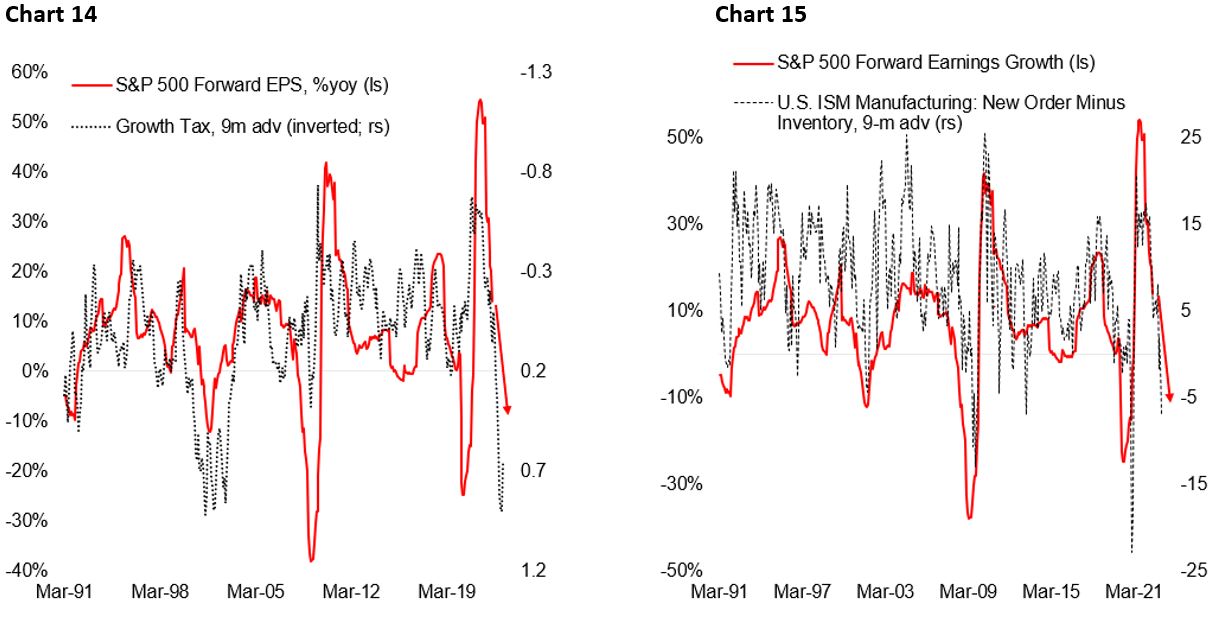
For investors, getting the growth outlook correctly is crucial as it determines the earnings outlook for stocks. Below are four charts to argue against for analysts who believe that earnings will continue to grow or stay flat next year. Chart 14 shows that growth tax – the combination of the dollar, 10-year Treasury yield, and oil price – should weigh down earnings in the coming two quarters and is pointing to an at least 10% drop in forward earnings. Chart 15 also highlights that unless new order to inventory ratio rebound soon, forward earnings growth should decline by roughly 10%. These two cycle indicators are basically telling us that we are potentially going into a manufacturing recession and that earnings are more likely to fall in the coming 9 months.
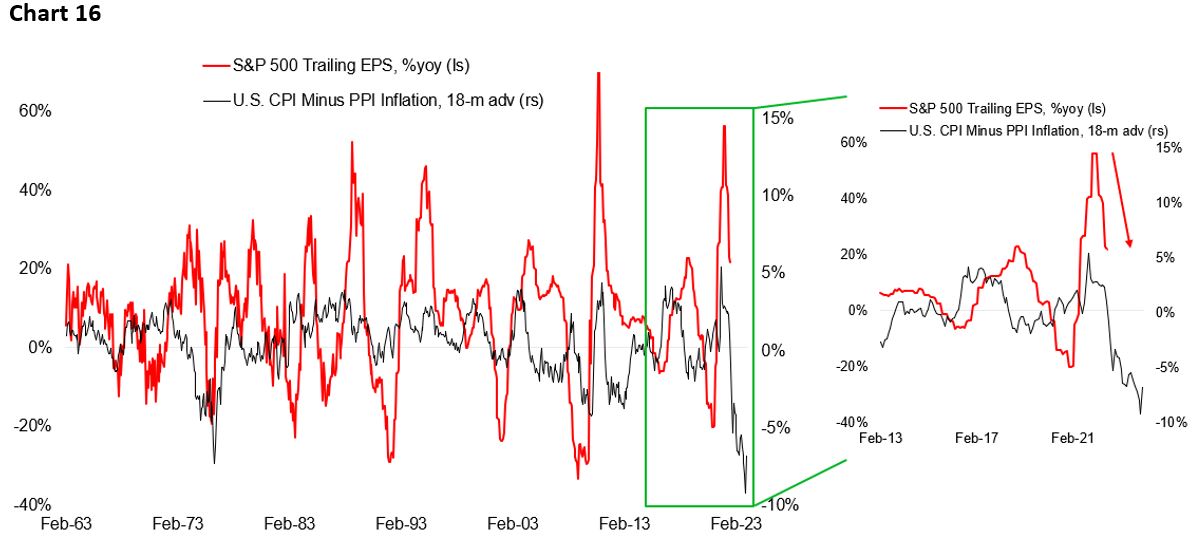
Aside from the growth slowdown, companies are also facing margin pressure from rising raw material cost and wage pressure. The combination of slowing revenue growth and inability for companies to continue passing-through price increases to consumers means margin will get squeezed. The difference in output and input price inflation, proxied by CPI and PPI, is pointing to a 20% decline in earnings (Chart 16). Anecdotally, we are reading that companies are also more reluctant to fire employees and opt to retain them amid tight labor market condition, which should increase firm’s operating leverage somewhat going into a downturn.
We acknowledge, however, that the three indicators above sometimes provide a false positive – meaning that a deterioration in the leading indicators was not followed by earnings declining. But considering the sharp move of these leading indicators in this cycle, it is difficult to argue that earnings forecast will not be cut further. Lastly, one indicator that never fail in predicting earnings contraction is the yield curve (Chart 17). An earnings contraction does not necessarily saw the yield curve inverting in advance, but a yield curve inversion has almost always been followed by earnings contraction in the quarters ahead. Currently, the 10/2-year spread is inverted by over 40 bps.

To us, the body of evidence points unanimously to an earnings contraction ahead. But a good analyst should never be dogmatic. We will change our mind when the facts change and welcome others to poke a hole in our thesis. With growth outlook and its impact to earnings already discussed in depth, we now move on to the state of liquidity in the market currently and its impact to equity valuation.
Liquidity: The Worst is Yet to Come
The problem with monetary policy tightening is that the impact to the real economy is normally only felt with a lag of 6-12 months, which translate to the risk of it being overdone and deepening the coming growth slump. We agree that currently monetary policy needs to stay tight until inflation is clearly trending back to 2% Fed’s target, but this also means that the impact of rate hikes done since early this year will only be felt the months ahead while quantitative tightening (QT) has yet to drain liquidity in the market.
Chart 18 shows that despite the spike in real yields, which rose from -1.2% to +0.9%, Federal Reserve’s reverse repo balance is still increasing. Reverse repos are a sign of excess liquidity in the system, meaning that banks have money left over after covering their liabilities and investing and lending what they are comfortable with. In fact, reverse repo share of Fed’s balance sheet has risen from 2.5% to 27.5% today – highlighting the still plenty liquidity despite the QT, which began in June, that supposedly reduces Fed’s balance sheet size (Chart 19). This will likely change going forward as the decline in Fed’s assets is no longer being offset by the fall in Treasury General Account (TGA) balance. The bottom line is that the impact of tightening liquidity will only be increasingly felt and its impact to risk assets will likely also be greater than what we have seen so far this year.

Other than the lag for monetary policy transmission, the elevated inflationary pressure also increases the risk that the Fed will maintain tighter-than-warranted policy that bodes poorly for growth and market liquidity, at a time when the growth is slowing. In most of the past two decades, monetary policy tends to ease whenever growth outlook is deteriorating, as seen in the period between 2005-2015 (Chart 20). In 2018, when the Fed keeps on hiking and maintaining the pace of QT as the yield curve invert, risk assets were thrown into tailspin that forces Chairman Powell to do the infamous “Powell Pivot” just a month after saying that the Fed was “a long way” from neutral. Today, there are similarities that the Fed is again tightening into a slowing growth amid inflation, which should drive risk asset valuation much below today’s level.
For us to turn positive towards liquidity, there are two main prerequisites: yield curve has to steepen, and money growth has to exceed credit growth (Chart 21). This means the Fed has to be clearly sounding dovish and cutting rates – unlikely in the near term – and growth outlook has to bottomed. The dollar and long-term yield will likely fall significantly in this case. This scenario will very much depend on the trajectory of inflation, employment, and growth in the coming months.

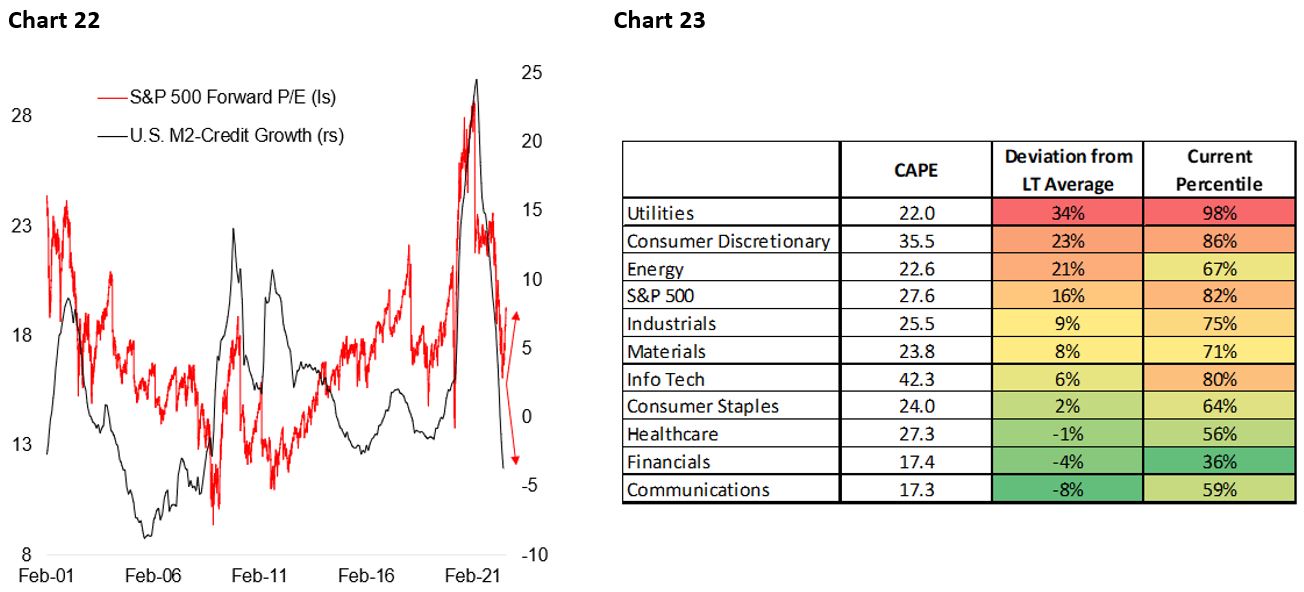
To tie in our liquidity outlook to equity valuation, Chart 22 shows the relationship between S&P 500 forward P/E ratio and an indicator of excess liquidity proxied by M2 money supply minus credit growth. Although the correlation is not clear-cut, the direction of both series is clear. Considering the growth and liquidity outlook it is not unlikely that we will see S&P 500 trading at below 14x forward P/E in the coming quarters. Chart 23 highlights sectors that potentially suffer the most during a liquidity crunch based on its deviation from long-term average of cyclically adjusted P/E ratio.
Conclusion:
- Remain underweight risk assets and use the current strength as an opportunity to decrease exposure towards low-quality and expensive growth stocks. Remain overweigh defensives over cyclicals.
- Increase exposure to U.S. government bonds in the expectation of a slower growth and potential monetary policy pivot. We don’t see much room for long-term yields to rise from current level amid deterioration in growth. Meanwhile, yields could fall significantly if inflation turns out to be more benign than current swap pricing. The risk/reward profile favors buying long-duration government bonds.
- Maintain USD exposure. Japanese Yen will become an attractive hedge especially if the Fed does turn more dovish and inflation is moving closer to 2% target.
Copyright © 2022, Putamen Capital. All rights reserved.
The information, recommendations, analysis and research materials presented in this document are provided for information purposes only and should not be considered or used as an offer or solicitation to sell or buy financial securities or other financial instruments or products, nor to constitute any advice or recommendation with respect to such securities, financial instruments or products. The text, images and other materials contained or displayed on any Putamen Capital products, services, reports, emails or website are proprietary to Putamen Capital and should not be circulated without the expressed authorization of Putamen Capital. Any use of graphs, text or other material from this report by the recipient must acknowledge Putamen Capital as the source and requires advance authorization. Putamen Capital relies on a variety of data providers for economic and financial market information. The data used in this publication may have been obtained from a variety of sources including Bloomberg, Macrobond, CEIC, Choice, MSCI, BofA Merrill Lynch and JP Morgan. The data used, or referred to, in this report are judged to be reliable, but Putamen Capital cannot be held responsible for the accuracy of data used herein.
