Download PDF:
Remains Overweight Russia
Russia and other oil-exporting countries historically perform poorly during a global slowdown, but tighter discipline among OPEC+ and shale producers since last year has bolstered oil prices to above $80/bbl, which creates a positive spin for energy producers. We have been constructive on Russian and energy sector since last quarter, and continue to recommend overweight position until the end of year for the following reasons:
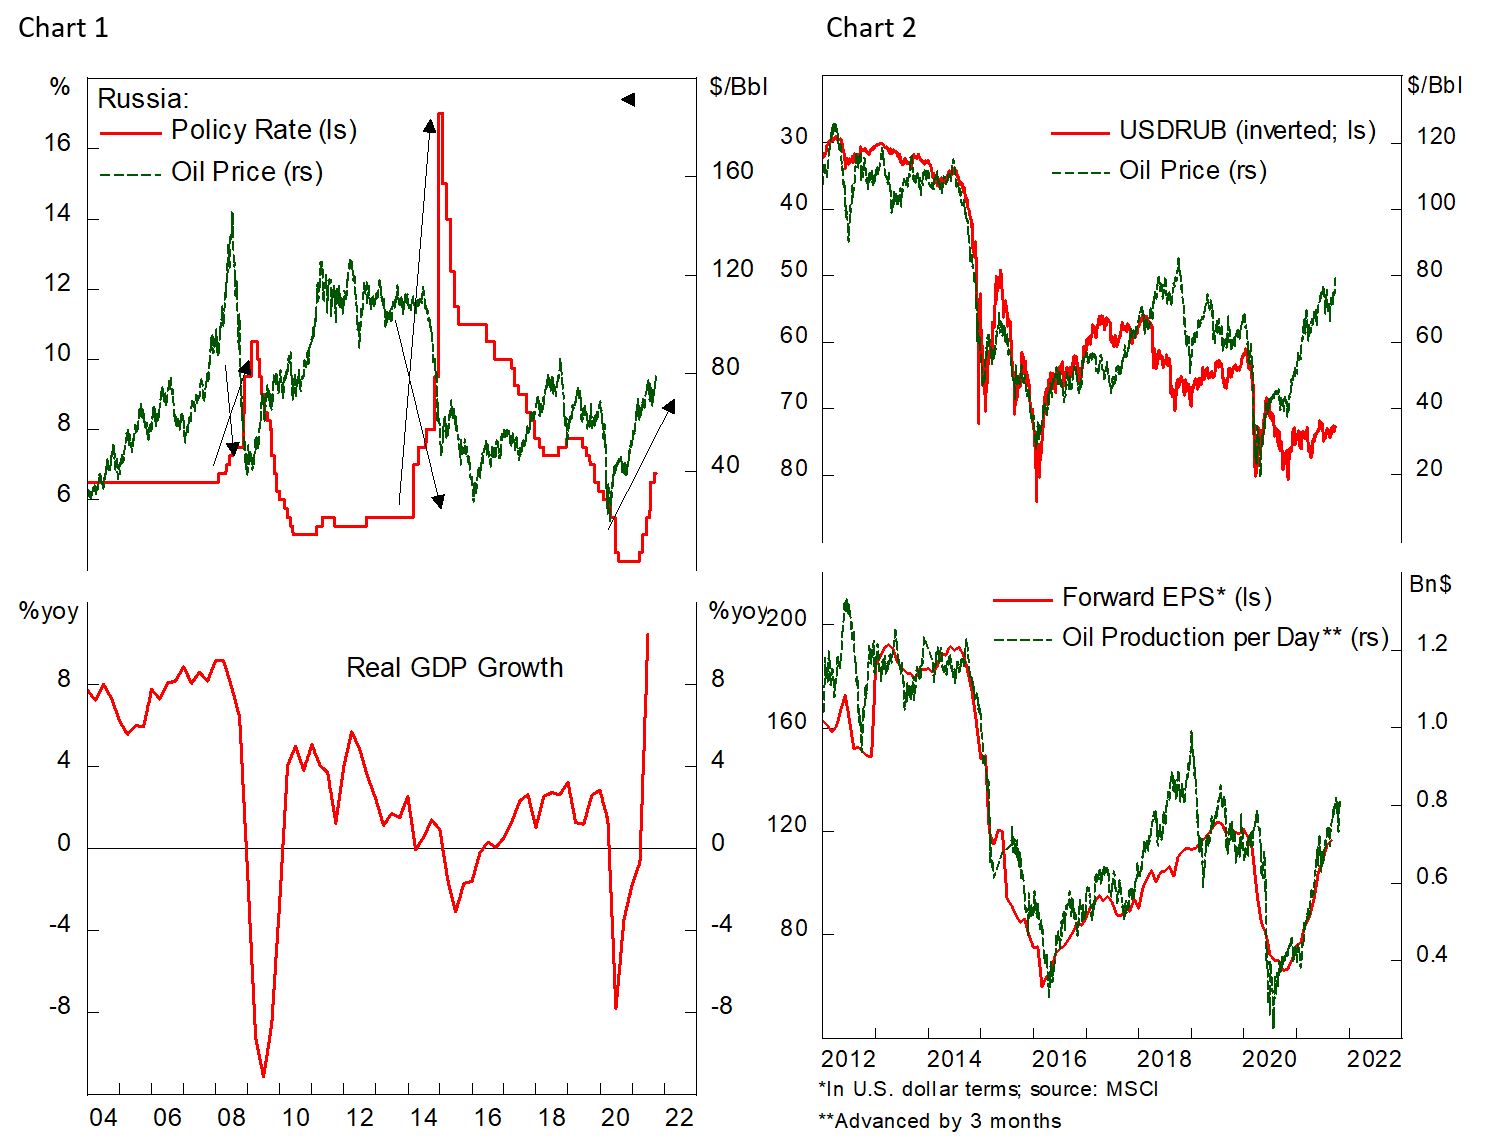
- Aggressive monetary tightening will bolster the Ruble and should not hurt the economy significantly as it benefits from the trickle-down effect of higher oil prices. Previously the country was forced to tighten policies at a time when oil prices were collapsing, which results in a sharp contraction of the economy (Chart 1). This time around, elevated oil price should ease the downward pressure from higher borrowing rates.
- Cheap valuation also provides a buffer against selloff in EM assets. Russian stocks are trading at only 6.8 times forward earnings, and both the ruble and profit outlook is favorable (Chart 2). Moreover, the country is among the least vulnerable to external shocks in EM since the crisis in 2015 amid U.S. sanctions, as discussed in previous piece. If oil prices remain above $70/bbl, the Ruble and Russian stocks should continue to be well bid.
- In addition, in April we were making the argument that geopolitical risk in Russia is peaking out, which should dampen risk premium of both bonds and stocks (EMC_20210428). On the domestic front, last month’s legislative election went without major incident, with the incumbent United Russia retaining its majority, and going forward domestic political risk will likely be a non-event.
Stay Neutral on Mexico
The outlook for Mexican stocks is mixed. In the short term, chip shortages have become an issue for Mexican auto production and exports that is weighing the country’s manufacturing activity (Chart 3). Not only exports have been weak but deteriorating terms of trade is also putting downward pressure on the peso (Chart 4).

Beyond the near-term outlook, however, we believe the structural underperformance of Mexican equity is coming to an end.
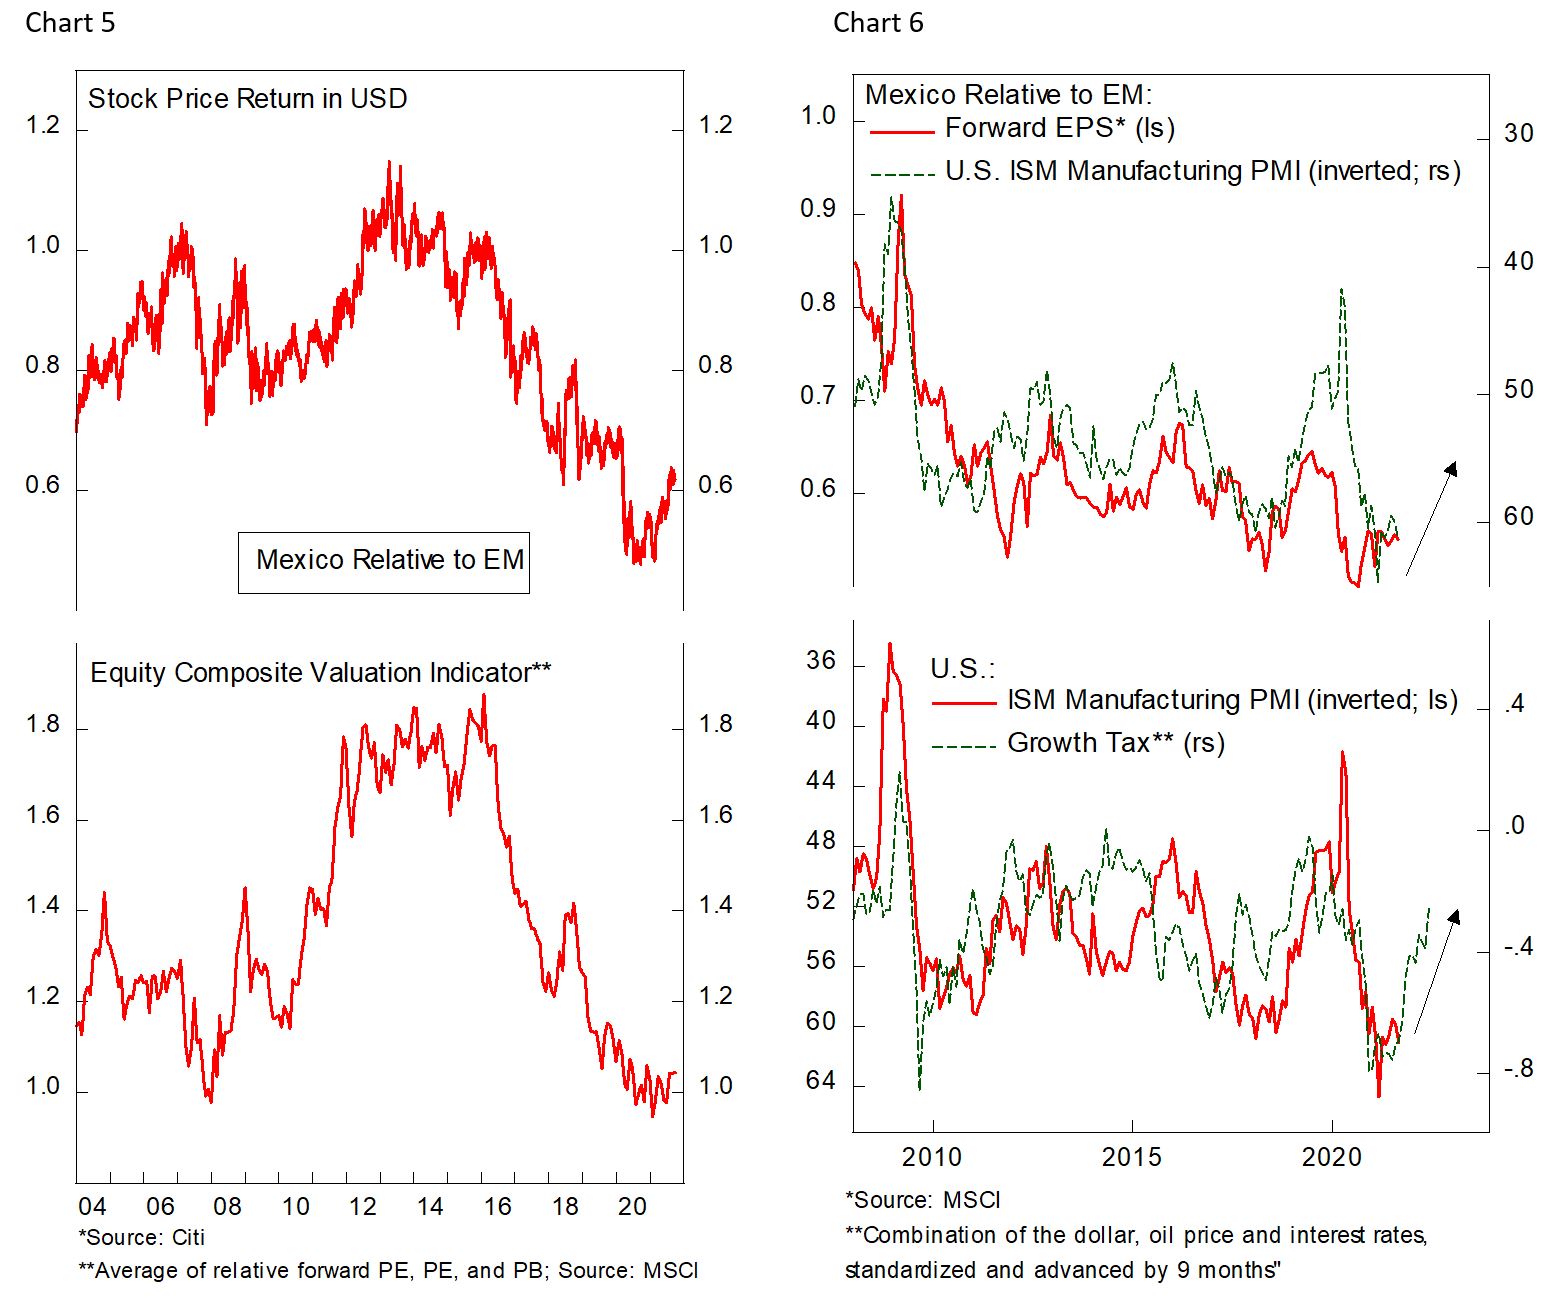
- First, relative valuation to EM benchmark is currently near record low level, which historically points to the outperformance of Mexican stocks in subsequent years (Chart 5). The stock market has been derated massively from trading at 80% premium in 2016 to now on par with EM benchmark, and sentiment on the country’s assets has turned excessively bearish.
- Second, Mexican bourse is tilted towards defensive sector whose earnings outperforms EM benchmark during slowdown in U.S. economic activity. Chart 6 shows that U.S. manufacturing PMI is set to decelerate in the coming quarters because of firmer dollar, higher rates, and rising oil prices, all of which is a drag to the economy.
- Taken together, multiple expansion and earnings of Mexican stocks will likely become a structural tailwind for Mexican outperformance in the years to come. For next quarter, however, we remained cautious as we expect volatility of risk assets to remain high.
Copyright © 2021, Putamen Capital. All rights reserved.
The information, recommendations, analysis and research materials presented in this document are provided for information purposes only and should not be considered or used as an offer or solicitation to sell or buy financial securities or other financial instruments or products, nor to constitute any advice or recommendation with respect to such securities, financial instruments or products. The text, images and other materials contained or displayed on any Putamen Capital products, services, reports, emails or website are proprietary to Putamen Capital and should not be circulated without the expressed authorization of Putamen Capital. Any use of graphs, text or other material from this report by the recipient must acknowledge Putamen Capital as the source and requires advance authorization. Putamen Capital relies on a variety of data providers for economic and financial market information. The data used in this publication may have been obtained from a variety of sources including Bloomberg, Macrobond, CEIC, Choice, MSCI, BofA Merrill Lynch and JP Morgan. The data used, or referred to, in this report are judged to be reliable, but Putamen Capital cannot be held responsible for the accuracy of data used herein.
