Download PDF:
Potential peak in U.S. Treasury yield and copper/gold ratio, and gangbuster data coming from China, U.S., and Europe point to the passing of maximum growth momentum in post-pandemic recovery. Despite the pandemic still raging in parts of the world, especially in EM countries, strong recovery in China and the developed world mean ultra-easy policies are no longer warranted and withdrawal of both fiscal and monetary measures is a matter of when and not if. As the first country to suffer and recover from the pandemic last year, Chinese authorities are already scaling back government support and our measure of credit impulse has turned decisively negative, which has historically boded poorly for growth and risk assets, with a time lag of 9-12 months. Meanwhile, in the U.S. the Federal Reserve is likely to taper its quantitative easing (QE) program in the Summer, although the still high unemployment numbers mean timing of the first policy rate hike is still far down the road.
As a high beta asset, EM stocks are highly sensitive to global growth and policy changes, which characterized its boom-bust cycle (Chart 1). With the asset class always had above 20% correction every two years, investors are right to question whether another down leg in EM equity is coming amid the peak in growth momentum and tighter policy environment. However, we think it is too early to turn bearish this year due to the still strong earnings growth in the coming quarters and depressed valuation in parts of the EM universe.

In addition, the policy shift in both China and U.S. has also been gradual and communicated well in advance, while liquidity remains easy. This time around Chinese policy tightening has been less harsh compared to previous cycles – short-term rates have been falling despite the decline in credit impulse and diverged from the rebound in both the economy and stock price (Chart 2) – and outright tightening in the U.S. will not happen anytime soon. Globally, policymakers concern on various issues – flare up of infection cases, high unemployment rate, rising food prices, and social instability – means policy support is unlikely to be withdrawn abruptly. This, combined with a still favorable global growth outlook for the second half of the year should translate to capital flow going back to EM assets and for lagging countries to catch up (Chart 3).

And What If Policy Is Tightened?
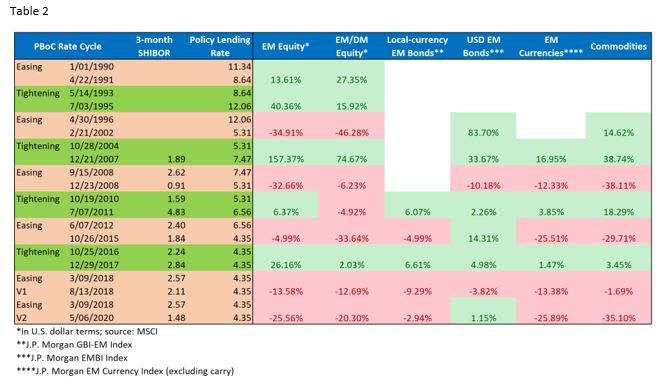
Table 1 and 2 show the performance of EM assets during previous easing and tightening cycle (here defined as between the first policy rate hike/cut to the last) by the Fed and PBoC. The message is that investors should not be afraid of tightening cycle as it reflects global growth and earnings picture, with EM assets performing well across the board since the turn of the century. If anything, investors want to invest in EM assets when policy is being tightened and short the asset class when policy is being eased. Not only EM assets performed well during the Fed and PBoC tightening cycle, but EM stocks tend to also outperform its DM counterpart, likely reflecting its higher cyclical stocks weight in the benchmark.

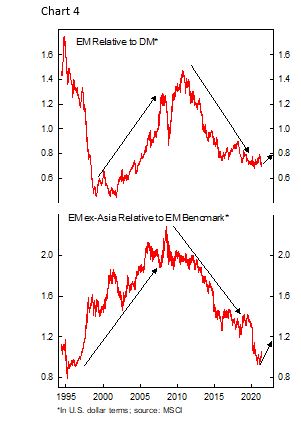
Then the question du jour is why EM has not outperformed DM significantly of late (Chart 4)? We think we are still in the early phase of the recovery and EM will outperform going forward, for a few reasons. First, many EM countries are still heavily weighed by the pandemic, which means economic activity is still below potential and unlikely to recover fully until vaccination campaign reach the threshold for herd immunity – a story for next 12 months. Second, the size of fiscal and monetary stimulus in EM countries is pale compared to in the developed world, especially U.S., which has caused its asset prices to soar into bubbly territory. This does not happen in any EM countries. And lastly, equity risk premium for EM, especially ex-Asia, has not come down as historically happened after a recession. In addition, spreads of local-currency bonds are elevated, and EM currencies remain cheap, likely due to investors’ wait-and-see approach as the pandemic situation is still highly fluid. Taken together, this potentially means the outperformance of EM assets will be more gradual compared to history but should accelerate in the coming quarters as the recovery in hard-hit countries take place.
Dissecting EM Stocks Performance
The 2000s were great years for EM stocks with almost all countries outperforming their DM counterpart on the back of rapid Chinese growth, post 1990 crisis in Latam and Asia, and rising global trade. Demand for commodities become a tailwind for resource-rich countries, which flush their government coffer and lift domestic living standard; Russian GDP per capita grew 5 times between 2000 and 2010, whereas China, Indonesia, and Brazil, grew 3.7 times, 2.7 times, and 2 times, respectively. The boom in EM countries, in turn, further increase demand for commodities as infrastructure investment in these countries accelerated.
Global financial crisis (GFC) stopped the party in its track. FDI flew back from emerging countries to the U.S. and Europe, forcing domestic policymakers to tighten fiscal and monetary policy to prevent their currency from falling, which only exacerbate slump in domestic growth. Once the storm passes, vulnerabilities in the weaker EM countries were laid bare. Commodity-dependent countries with discipline monetary and fiscal management, high savings rate, and functional politics are able to continue its growth trajectory, among them Indonesia, Chile, Peru, and Colombia. Meanwhile, growth in Brazil, South Africa, and Russia have been constraint by the rigid government spending obligation, lack of domestic savings, and low FDI inflows amid less attractive investment environment. Richer East Asian countries manage to resume its growth, and their stock market performs in-line with the DM counterpart, a rebuttal to the thesis that EM stocks are not an attractive investment opportunity (Chart 5). On the contrary, the most exciting consumer technology story and investments are now located in China and South Korea.

However, the market is mean-reverting and the headwind for EM ex-Asia is now turning into a tailwind. If commodity bear market of past decade is the main cause of EM underperformance by dragging down EM ex-Asia bourses’ performance, then the still developing rally in commodity prices should be a tailwind for EM outperformance in the coming years (Chart 6). We believe this is the case, as low prices in the past decade have resulted in underinvestment of the commodity complex in face of rising demand that has only recently been corrected by a much higher price and it will take years to bring new supply to the market (Chart 7).
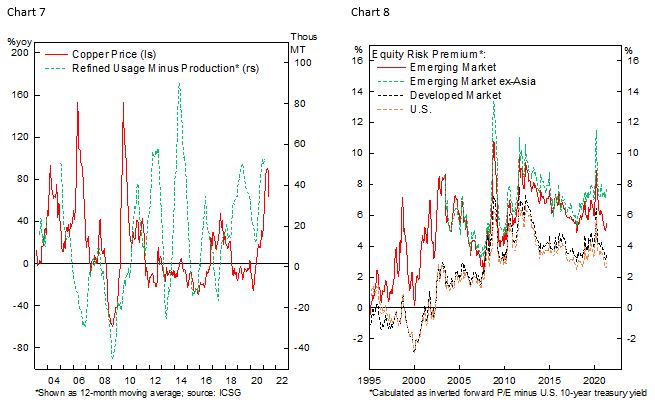
More importantly, EM ex-Asia valuation is still cheap, and rolling global recovery – from China, U.S., now Europe, and potentially EM after – means commodity demand and price should remain firm, which bodes well for the earnings of resource-rich nations. Despite this, market enthusiasm remains muted, with EM ex-Asia trading at 24% discount relative to EM benchmark based on forward earnings multiple (Chart 6, bottom panel) and equity risk premium has not come down in-line with its EM and DM peers’ trajectory (Chart 8).
Investment Conclusion
In this light, the dichotomy of EM equities – between resource-driven and East Asian countries – warrants thinking EM portfolio strategy in terms of core-satellite approach. Investors should hold a core position on East Asian bourses that are the growth drivers of EM and represent over half of MSCI EM weight, while playing the cyclical opportunities currently present in the developing commodity boom. In the current environment, we favor reducing the portion of our core portfolio and up our exposure on Latam stocks.

Copyright © 2021, Putamen Capital. All rights reserved.
The information, recommendations, analysis and research materials presented in this document are provided for information purposes only and should not be considered or used as an offer or solicitation to sell or buy financial securities or other financial instruments or products, nor to constitute any advice or recommendation with respect to such securities, financial instruments or products. The text, images and other materials contained or displayed on any Putamen Capital products, services, reports, emails or website are proprietary to Putamen Capital and should not be circulated without the expressed authorization of Putamen Capital. Any use of graphs, text or other material from this report by the recipient must acknowledge Putamen Capital as the source and requires advance authorization. Putamen Capital relies on a variety of data providers for economic and financial market information. The data used, or referred to, in this report are judged to be reliable, but Putamen Capital cannot be held responsible for the accuracy of data used herein.
