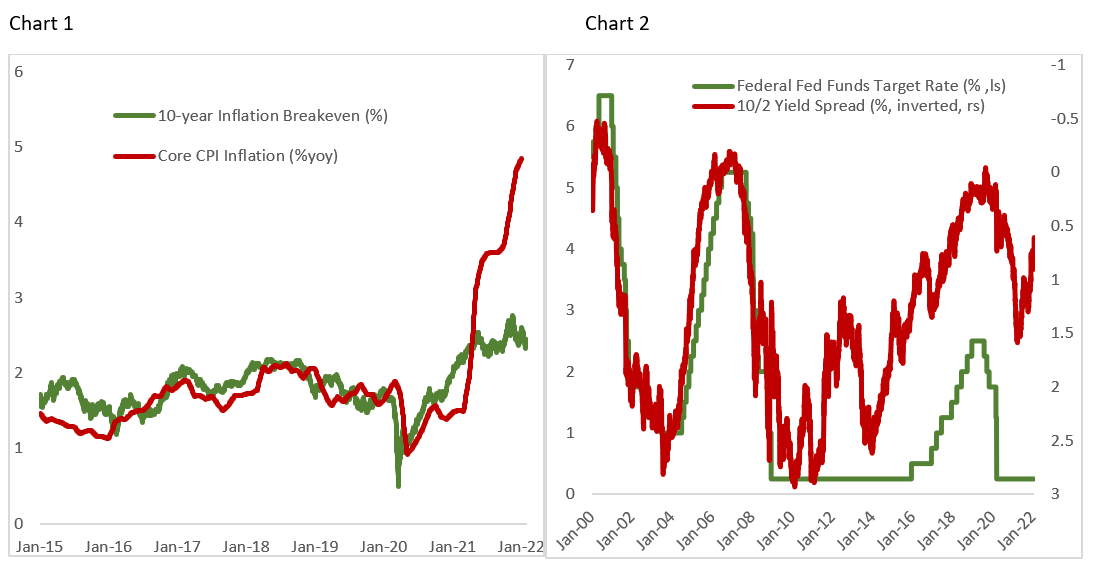
Expectation of a more aggressive Fed rate hike amid longer-than-expected inflationary pressure triggered a violent repricing of U.S. stock market in January this year. Core PCE inflation in December continue to rise 4.85% over the previous year, driven primarily by higher energy and food prices, and pandemic-related items. Meanwhile, unemployment rate continues to decline to 3.9% and quit rate is surging to 3% – the highest level in decades. However, it is notable that despite inflation being among on the top in investors’ mind and headline news, gold price is nowhere near its high and 10-year inflation breakeven rate continued to decline to 2.44% after peaking at 2.76% in November (Chart 1). This highlights that the market believes inflationary pressure will eventually abate and settle at a rate closer to the pre-pandemic averages.
The upside surprises in inflation seen over the past few quarters sent the Fed to recalibrate its policy and guidance into a more hawkish stance to fulfill its mandate of price stability. In January press conference Chairman Powell noted that, “wages have also risen briskly, and we are attentive to the risks that persistent real wage growth in excess of productivity could put upward pressure on inflation.”
It remains to be seen whether the Fed will be able to increase policy rate 5 times this year without inverting the curve and putting undue pressure on growth. The 10/2 yield spread currently trades at 76 bps while market is currently expecting 125 bps policy rate increase this year. Should the Fed start to increase policy rate in March as the market expects, it will do so with the flattest yield curve seen over the beginning of a tightening cycle since 2000 (Chart 2).
The aggressive monetary tightening come at a time when U.S. domestic growth is peaking, and manufacturing activity is likely to shift downward. The fourth quarter GDP number shows that U.S. GDP growth has been supported by inventory rebuilding that counter the normalization in consumption and investment demand. In the next few quarters, manufacturing PMI will most likely come down albeit still at an expansionary level (Chart 3). It is important to note, however, that several sectors such as auto manufacturing are still facing acute supply-side constraints and low inventory level and may see manufacturing activity accelerating in the second half of the year.
The monetary tightening and growth deceleration in U.S. stand in contrast to the increasingly aggressive easing by Chinese authorities to bolster weak domestic demand. Chinese credit impulse bottomed in the second half last year, which historically heralds the bottom in business cycle, while economic data has surprised to the upside on the back of weak expectations (Chart 4). In the near term, easing exports demand for Chinese goods will weight GDP growth in the coming months while the rolling lockdown to prevent explosive spike in Covid infections bode poorly for domestic consumptions. The good news is that Beijing has instructed local governments to speed up bond issuance – mainly directed towards infrastructure construction – which may support demand for industrial metals amid the crisis among domestic property developers.

Investment Implication and Sector Strategy
The risk of a “Fed mistake” and growth slowdown warrant a more defensive equity positioning in the ETF portfolio. However, with the likelihood of a recession remaining low, energy and material sectors are still very attractive despite the peaking domestic growth. Table 1 shows that during the downturn in manufacturing cycle between 2004 and 2008 these two sectors massively outperformed the index. After years of underinvestment among energy producers and miners, we believe that commodity prices will stay high for longer than expected.

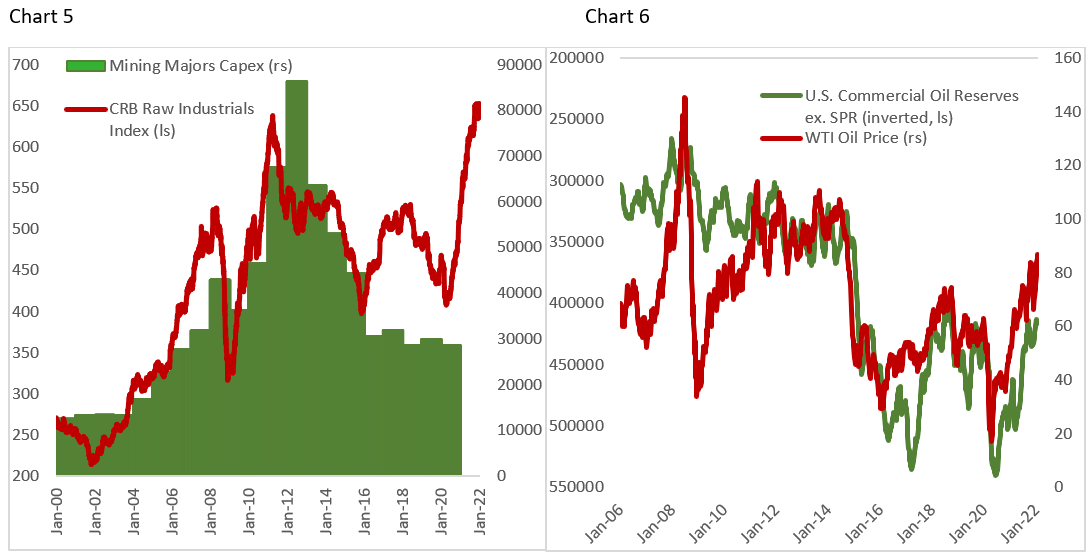
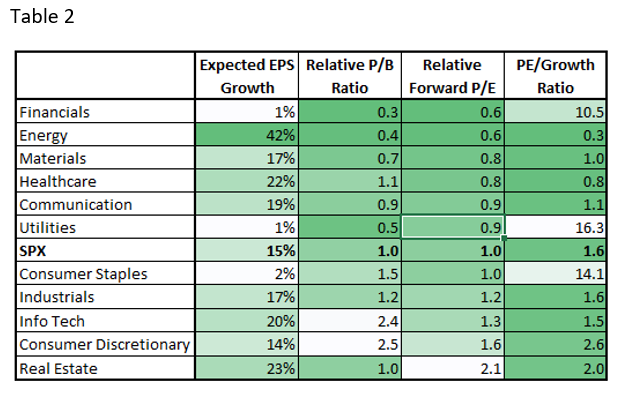
Capex of large miners has settled at half of the peak in 2013 and management’s focus remains on shareholders return rather than expanding production, which constrains supply while demand continues to grow – sending prices to level we see today (Chart 5). The shortage in energy and industrial metals is also confirmed by the record low inventory levels for oil and many base metals, in particular copper. Last week’s Department of Energy data shows U.S. oil inventory fell to near the lowest level since 2015 (Chart 6). In addition, energy and materials are cheap relative to benchmark, offer attractive free cash flow yields, and under-represented in the benchmark (Table 2).
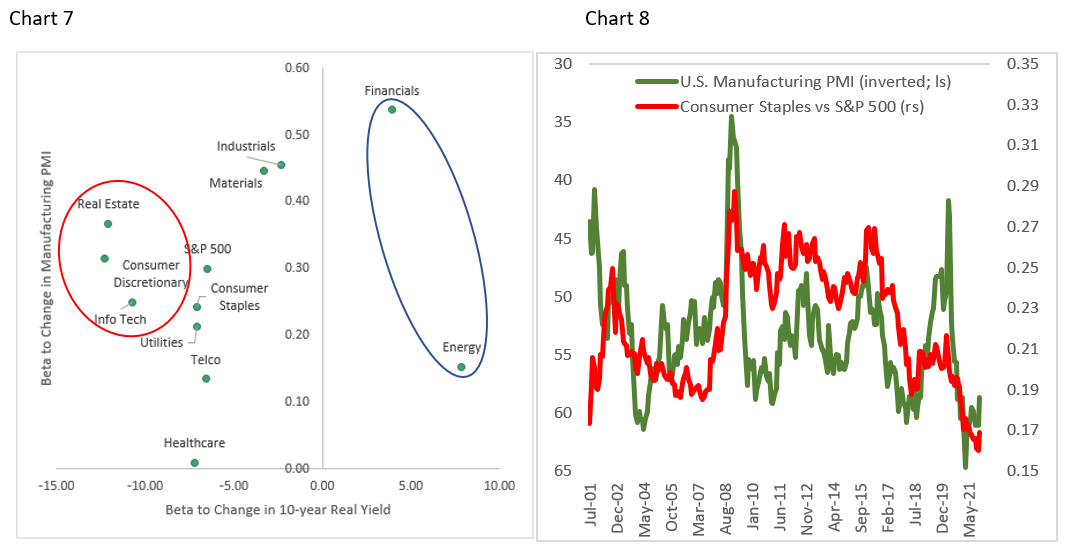
In the coming quarters, Fed policy will likely remain the top market concern that potentially spur sector rotation from growth to value, as seen in January’s market move when real yield rise from -1.2% to -0.6%. High-multiple tech stocks that have been the pandemic winners are relatively more fragile and their growth outlook should moderate this year as 2022/23 revenue growth was pulled into 2021 and companies front-run their IT capex spending. Chart 7 shows that energy and financials benefit from rising real yields – hence our overweight recommendation – while real estate, consumer discretionary, and info tech tend to suffer the most during periods of rising real yield and declining manufacturing PMI.
Lastly, investors should also overweight consumer staples to offset the underweight in info tech and consumer discretionary. Staples has historically outperformed the benchmark during period of declining manufacturing PMI and flatter yield curve (Chart 8).
Copyright © 2022, Putamen Capital. All rights reserved.
The information, recommendations, analysis and research materials presented in this document are provided for information purposes only and should not be considered or used as an offer or solicitation to sell or buy financial securities or other financial instruments or products, nor to constitute any advice or recommendation with respect to such securities, financial instruments or products. The text, images and other materials contained or displayed on any Putamen Capital products, services, reports, emails or website are proprietary to Putamen Capital and should not be circulated without the expressed authorization of Putamen Capital. Any use of graphs, text or other material from this report by the recipient must acknowledge Putamen Capital as the source and requires advance authorization. Putamen Capital relies on a variety of data providers for economic and financial market information. The data used in this publication may have been obtained from a variety of sources including Bloomberg, Macrobond, CEIC, Choice, MSCI, BofA Merrill Lynch and JP Morgan. The data used, or referred to, in this report are judged to be reliable, but Putamen Capital cannot be held responsible for the accuracy of data used herein.
