Download PDF:
Three market moves have dominated the macro landscape in the past quarter amid the Fed tightening policy and geopolitical tension in Eastern Europe: rise in Treasury yields, strengthening dollar, and rally in oil prices. These all amount to a growth tax for consumers, which will inevitably lead to a growth slowdown in the coming months (Chart 1). We could divide the real economy into three parts: household, corporate, and government sector.
Household’s real spending in the economy has only got back to trend despite the headline news of strong nominal consumer spending and tight labor market in past year (Chart 2). Mortgage rates have also creeped up alongside the increase in long-term yield, which will be an additional burden for households and potentially be offset by decline in spending on other segments. Although households’ balance sheet is relatively strong amid the rally in asset prices and healthy income growth and variable-rate mortgage estimated to account for only 10% of total in the U.S., the figure is higher in Canada (35%), Euro Area (50%), U.K. (65%), and Australia (90%). The bottom line is that consumer spending in the U.S. is not as strong as the nominal figure implies due to inflationary pressure. Going forward, the deterioration we saw in consumer sentiment will further weigh real household spending in the coming quarters.

The corporate sector’s capex and manufacturing cycle are also past its peak, although there few industries such as automotive, airplanes, and semiconductor likely experience a prolonged cycle to rebuild inventory and satisfy pent-up demand from pandemic-related disruption. As Chart 1 shows, new order indicator has rolled over and likely continue downward for the next 6 months, while inventory starts to improve. Barring recession, however, we will likely see the cycle accelerating again towards the end of the year.
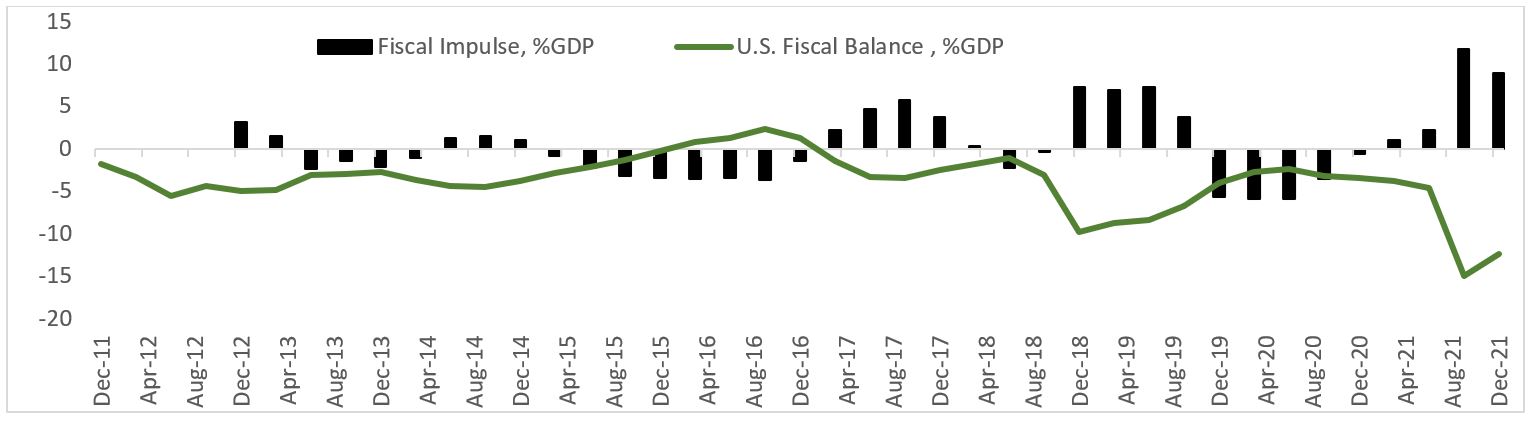
The large fiscal impulse seen in 2020 and 2021, combined with normalizing private sector demand, mean that government spending will be a drag on growth this year (Chart 3). There are large uncertainties on President Biden’s Build Back Better package, which will likely underwhelm its initial $1.75 trillion proposal. Regardless, U.S. fiscal spending will not be the source of upside growth surprise in the near term.
Given the deteriorating domestic growth outlook, concerns on inflation, and uncertainties related to Russia-Ukraine war, we develop a bull and bear case of how the macro landscape could evolve.
- In the bull case, normalization in supply-chain leads to a peak in core inflation number, although energy and food inflation could remain elevated. And as it became obvious that the economy is slowing fast, the Fed backs off from its aggressive tightening stance, allowing 10-year Treasury yield to come down. This is supported by the fact that historically the market has always been too optimistic in pricing short-term interest rate expectation. Meanwhile, Chinese reflation effort could start to push its growth higher, fueling demand for commodities and bolstering the global manufacturing cycle. This scenario will be a green light for risk assets, with growth stocks resuming its rally and the dollar weakening.
- The bear case involves a prolonged war situation in the Eastern Europe, which alongside heighten risk premium demanded by investors also push corporate earnings lower as consumer’s spending weaken. The upside risk to energy and food inflation intensifies as oil holds above $100/bbl and prices of wheat, soybean, and other agricultural commodities continue to rise. This possibly feeds into prices of other goods and services, and central banks are forced to tighten to prevent price-wage spiral in a weakening economy. In this case, the dollar strengthens while risk assets sold off.
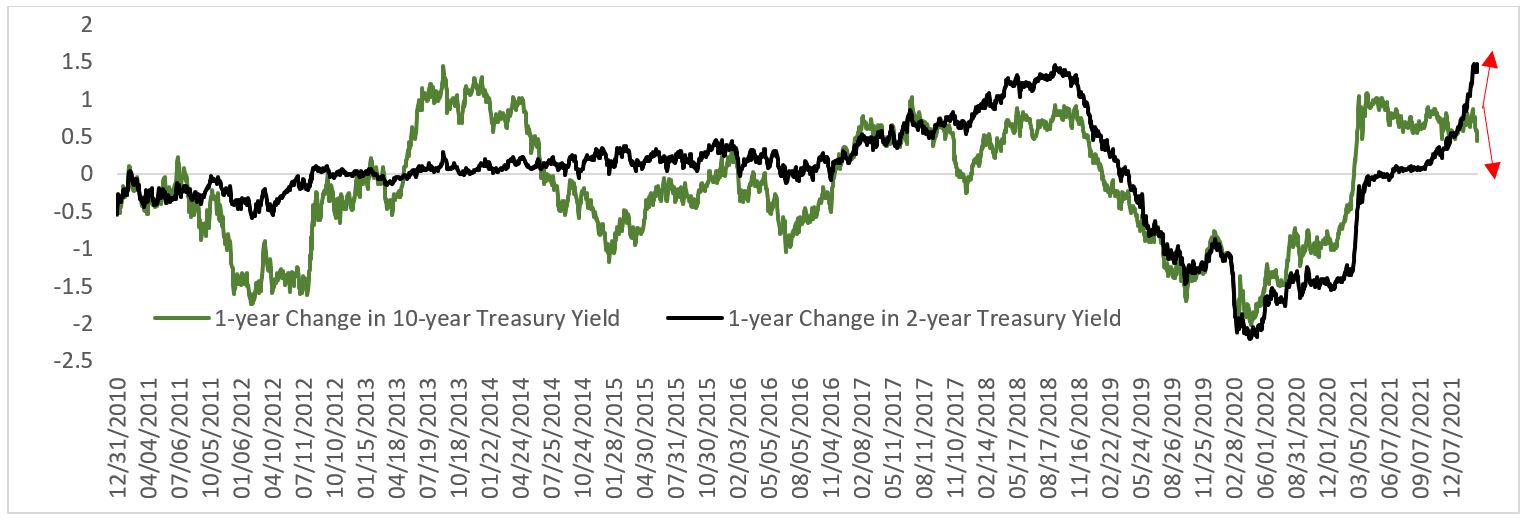
We are assigning 70% odds that the Fed will moderate its hawkish guidance later this year. The 10/2 yield curve spread is now only 30 bps and the 1-year forward has inverted. Chart 4 shows the relationship between changes in 10-year yield to those of 2-year yield. Between 2013-2014 when the Fed announced its intention to reduce its balance sheet size the 10-year yield was staging a rally from 1.65% to 3% and the 10/2 spread steepened from 1.4% to 2.6%, reflecting the strength of the economy, while 2-year yield – a proxy for Fed Funds Rate expectation – rose only slowly. The 2-year and 10-year yield then rose in tandem between late 2016 and 2018 as the Fed hiked its policy rate from 0% in 2015 to 2.5% in 2018. The U.S.-China trade war and slowing domestic economy, alongside 20% correction in S&P 500 and inversion in 10/2 spread, forced Chairman Powell to reverse policy and cut rates in mid-2019, which saw Treasury yields fell significantly.
The question in our mind today is whether the Fed will recognize the deteriorating outlook for U.S. economy before a market riot occur, or – as has historically the case – the equity market and spread products sold off first, either because of the Fed being late or its hands are tied amid persistent inflationary pressure. At some point, Fed’s aggressive rate hike guidance will push down long-term yield lower and invert the curve. Either way, we are positioning our portfolio allocation towards defensive asset class and sector in the coming 3-6 months.
Specifically related to the risk of financial market contagion from Russia-Ukraine war, we are mindful of the impact of high energy and food prices to Emerging Market countries, at a time when the Fed is set to hike rates. The rise in Treasury yield and the dollar amount to a tightening in global dollar liquidity, which bodes poorly for countries with large foreign debt refinancing needs. Turkey is probably one of the weakest among major EM countries due to its large oil imports, inadequate FX reserves, and high inflation. This year the country is facing $8.1 billion debt maturing (Chart 5), which is equivalent to only 1.1% of GDP but accounts for around 50% of its net reserves. We see a call option on USD/TRY as a good hedge against the risk of broadening conflicts in Eastern Europe, on top of going long oil, wheat, and select industrial metals.

Investment Implications
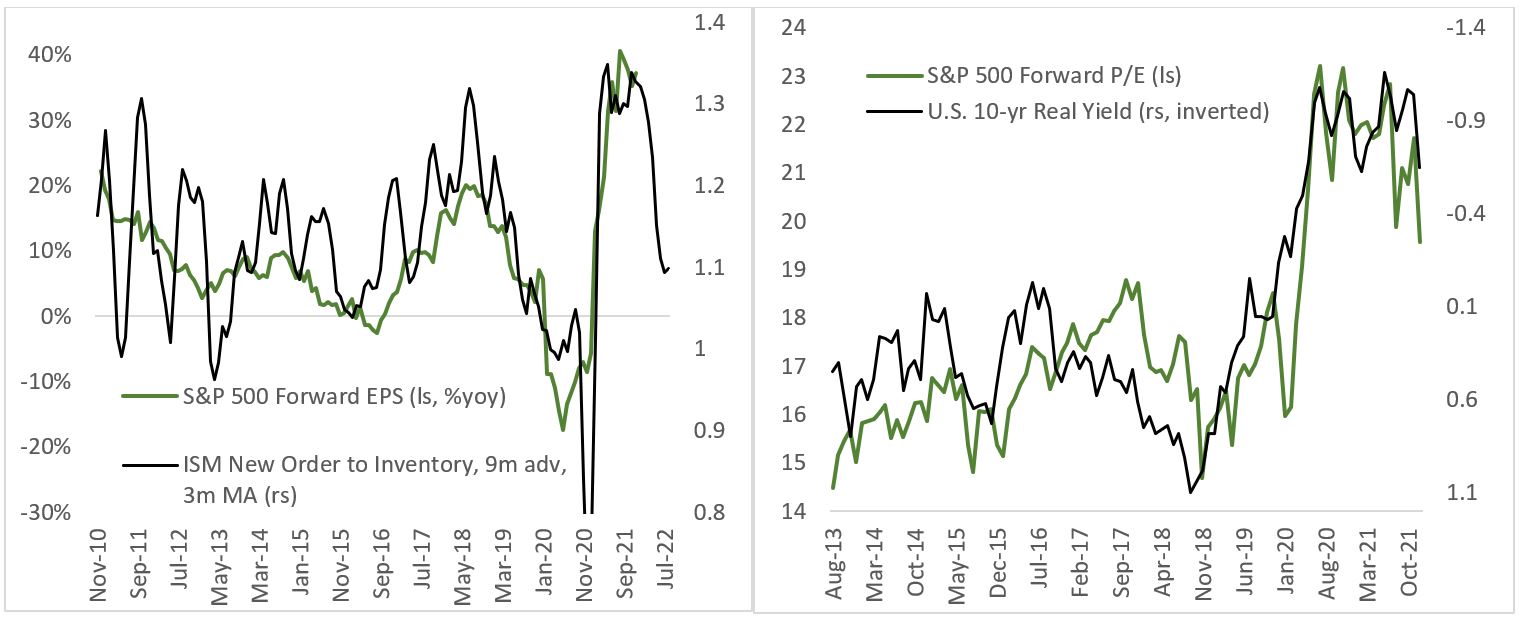
U.S. stocks’ stellar performance last year was aided by a strong rebound in the economy and very loose financial condition, which propelled valuation to record high levels. The outlook for U.S. equity this year is less rosy. First, the business cycle is entering a late stage and inventory-to-order ratio has already plummeted – which historically led S&P 500 earnings growth with a lag (Chart 6). Meanwhile, the Fed is ready to hike its interest rate faster than in 2015 hiking cycle amid heightened inflationary pressure, and an abrupt tightening in liquidity could not be ruled out. Already, real yields are marching higher, and multiples of many growth stocks have fallen (Chart 7). However, barring a recession, U.S. stocks could still deliver positive return this year as forward earnings growth expectation remains in positive territory and the Fed could backoff from aggressively hiking rate should inflation topped out in the coming months.
The macro environment discussed in the previous section and still rich valuation of broad equity markets justify a tilt towards defensive positioning by increasing cash position and allocation towards government bond. Investors should shy away from spread products, as higher borrowing cost could start to pressure junk companies in rolling over their debt. The risk-reward profile of HY bonds is unattractive at current level, while IG bonds suffer from its relatively high duration and spread widening.
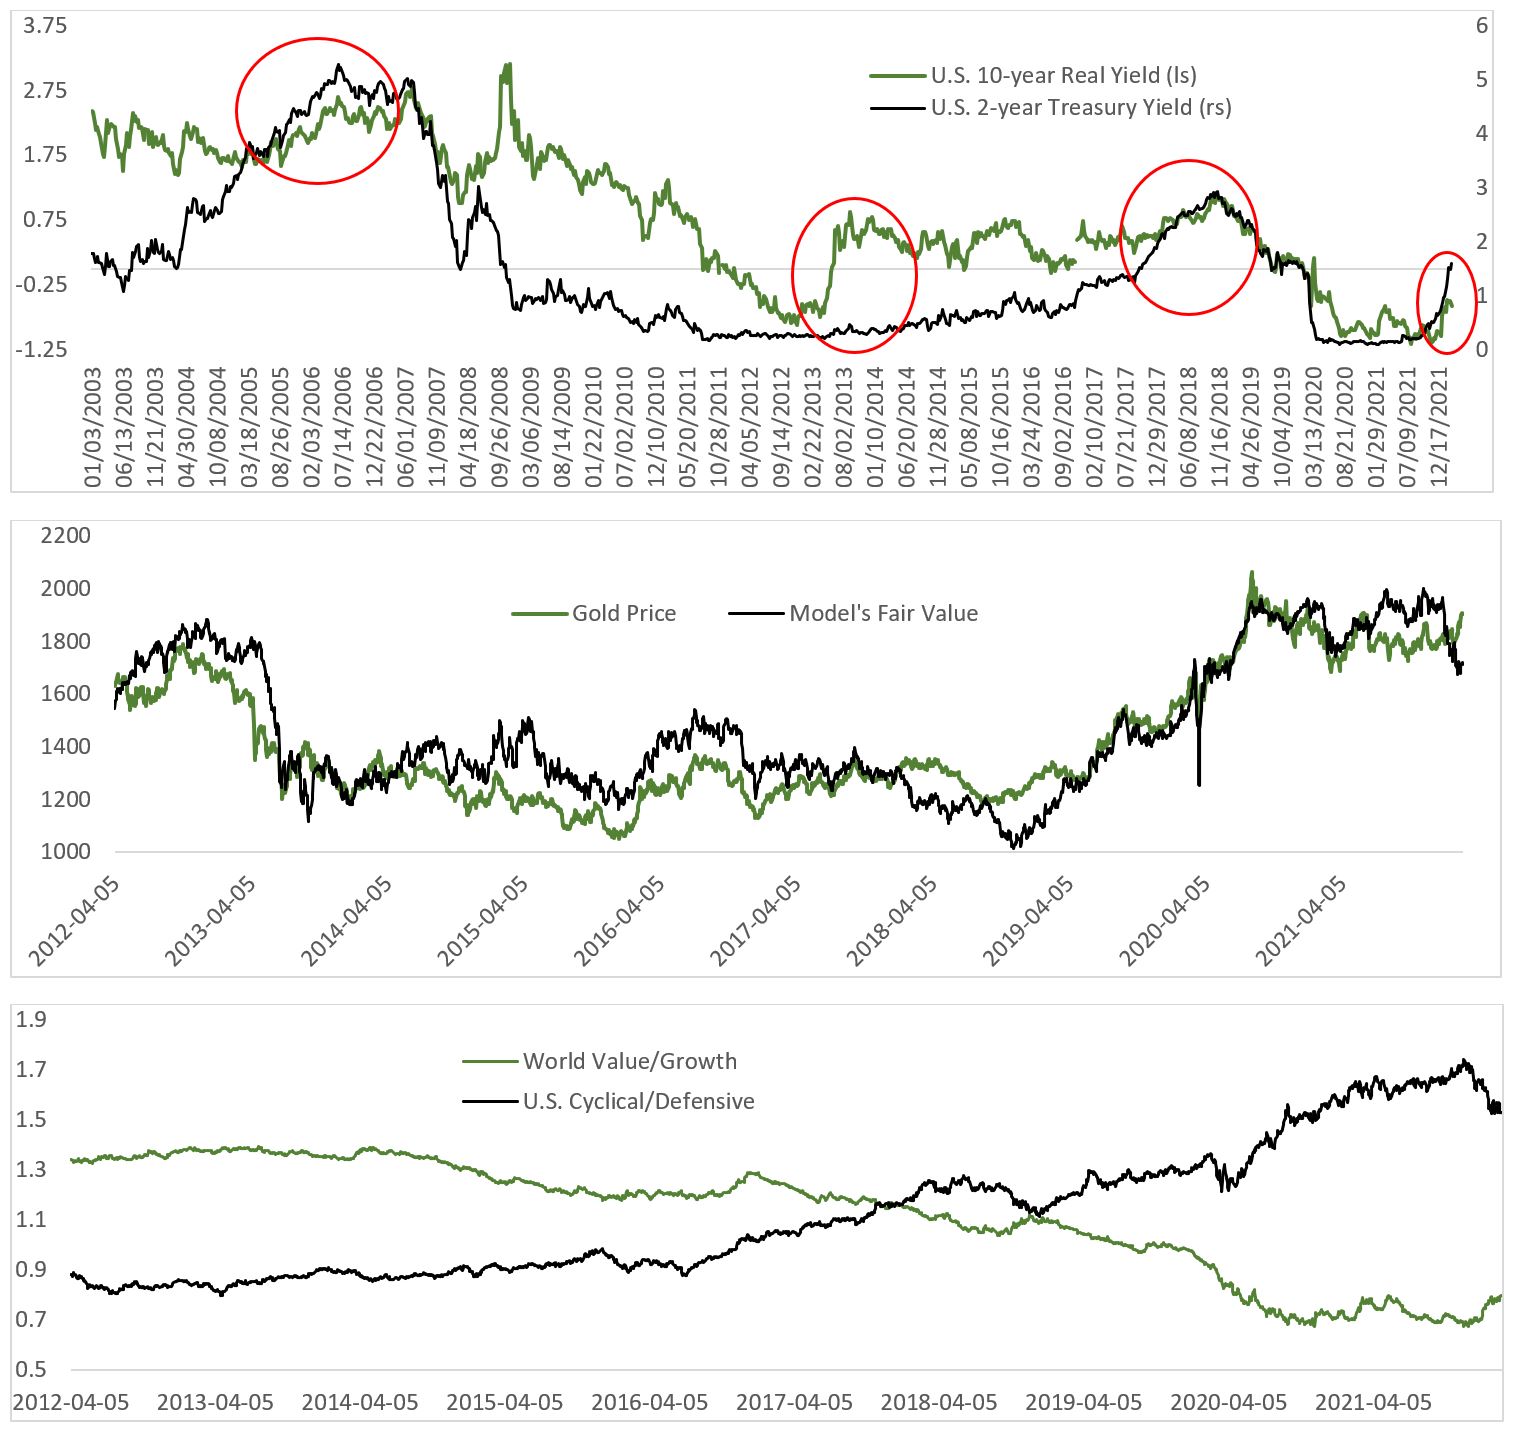
We also have reservation on using gold as a hedge despite the recent spike amid Russia-Ukraine war. Gold is a good hedge against volatility and in a period when central banks are behind the curve in fighting against inflation, which historically coincides with depreciation of domestic currency. Currently, however, the dollar is strong and real yields are rising on the back of aggressive Fed hike expectation. We expect real yields to continue to rise as monetary policy tighten (Chart 8), which should weigh down the rally in precious metals (Chart 9) and continue to support outperformance of value relative to growth (Chart 10). Note that we expect nominal Treasury yield to fall and real yield to rise, which is not inconsistent given our view that inflation breakeven will continue to moderate as supply chain bottleneck eases.
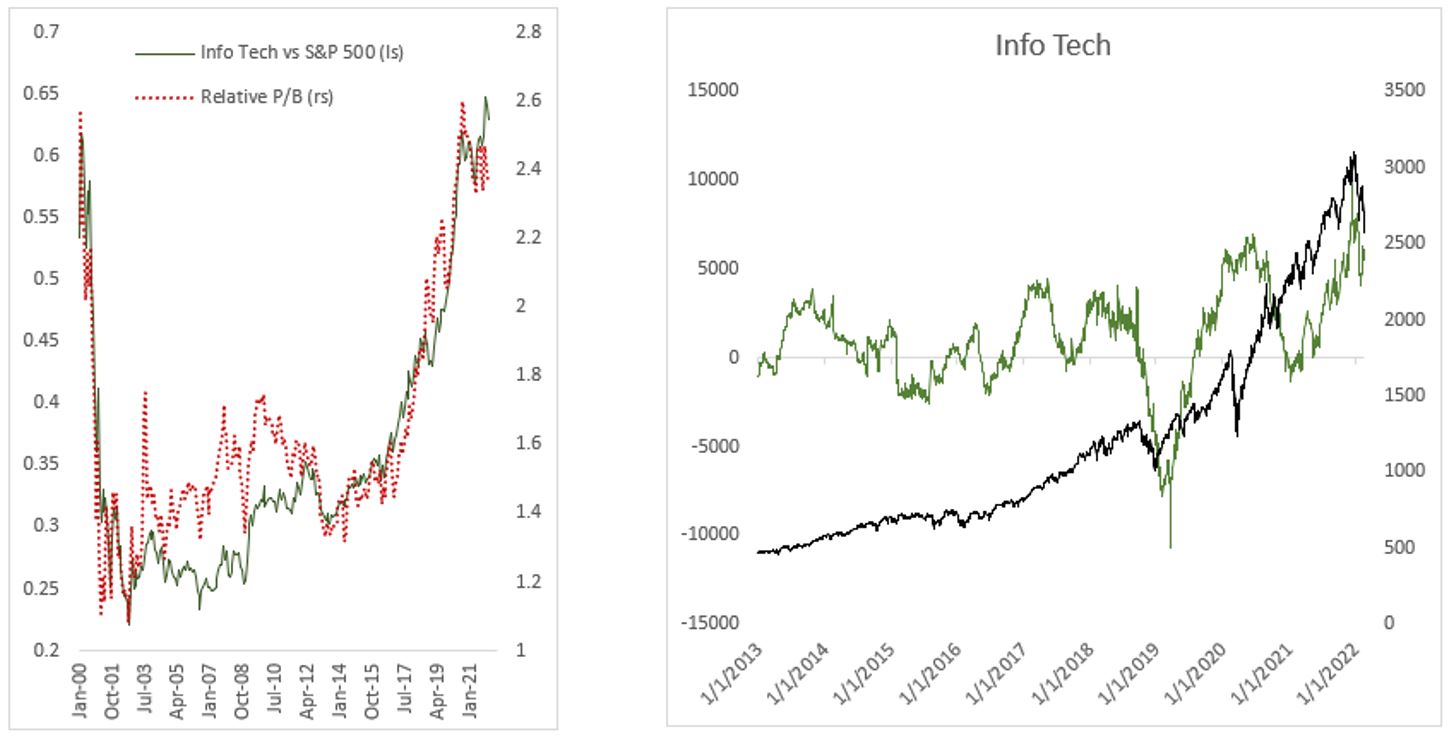
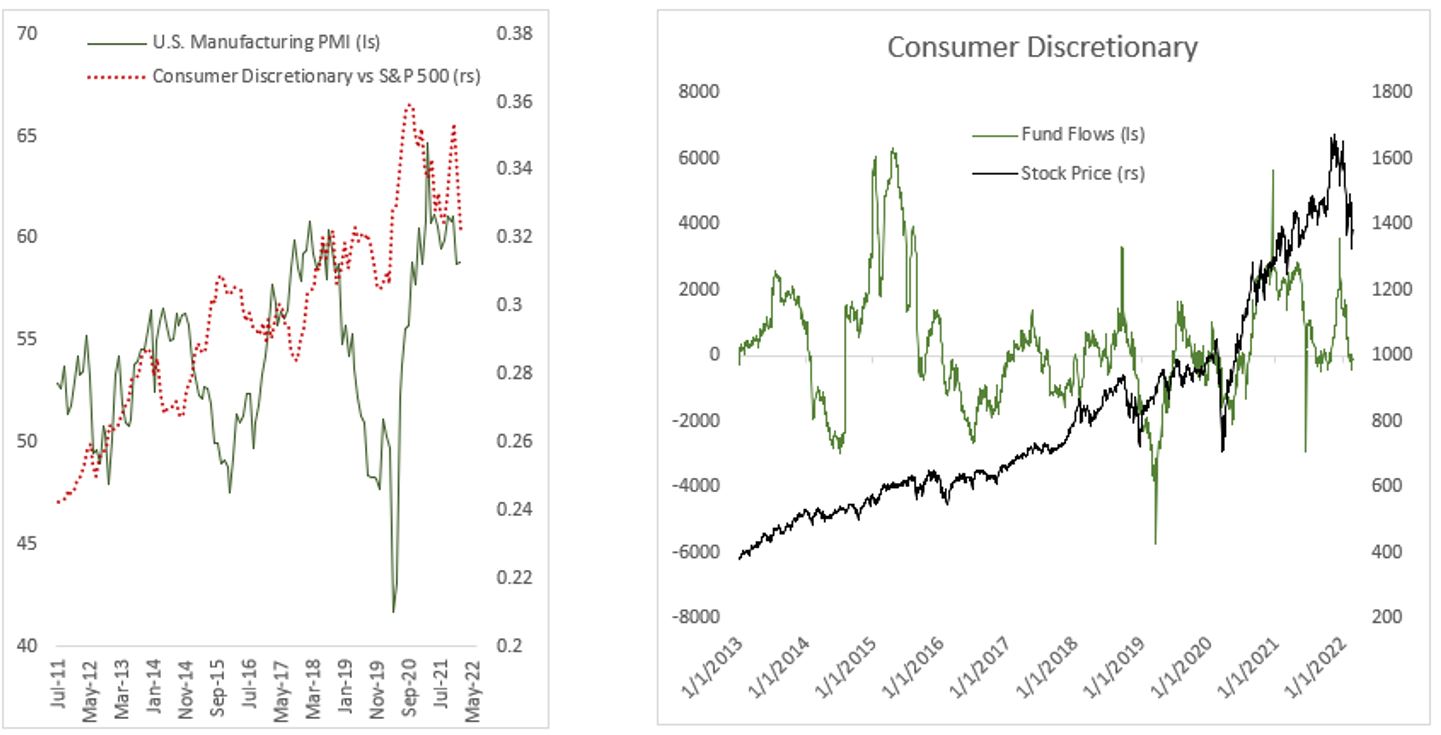
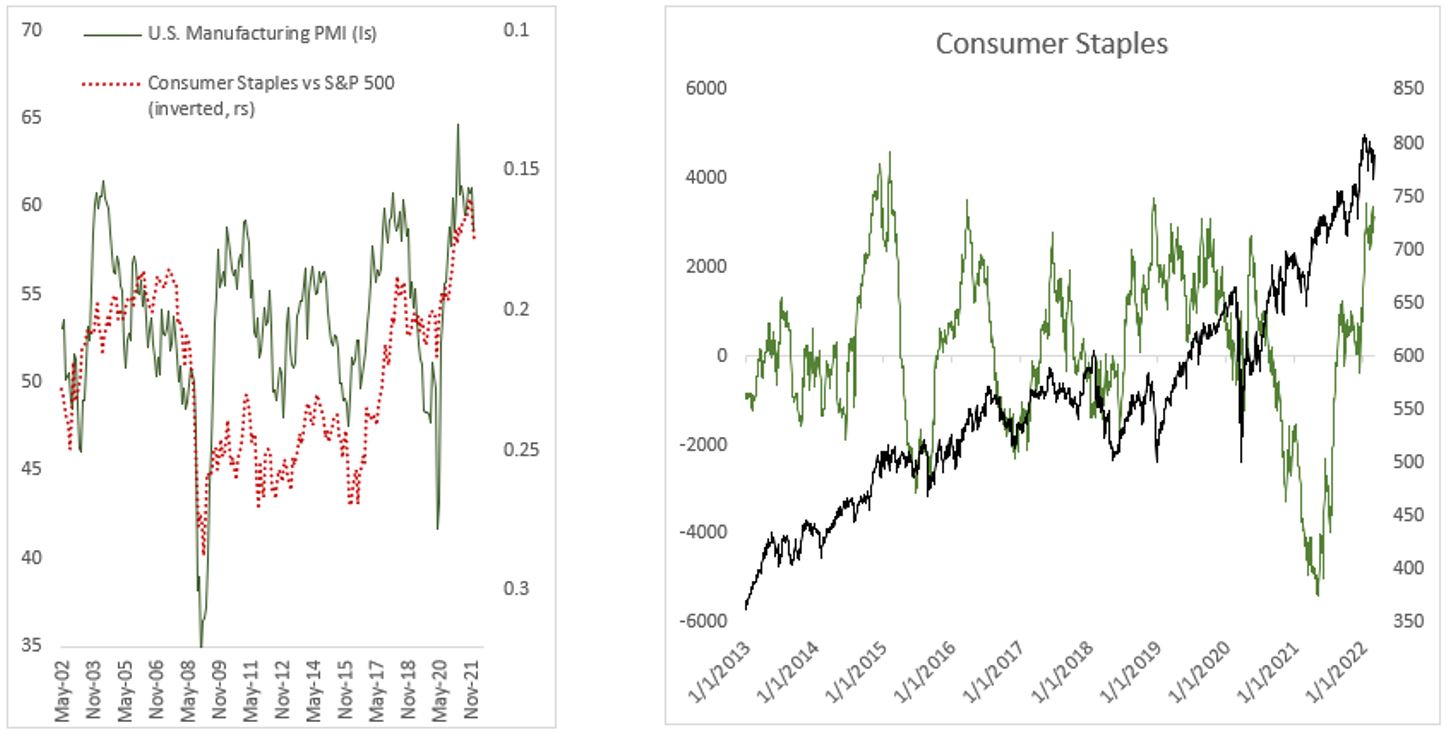
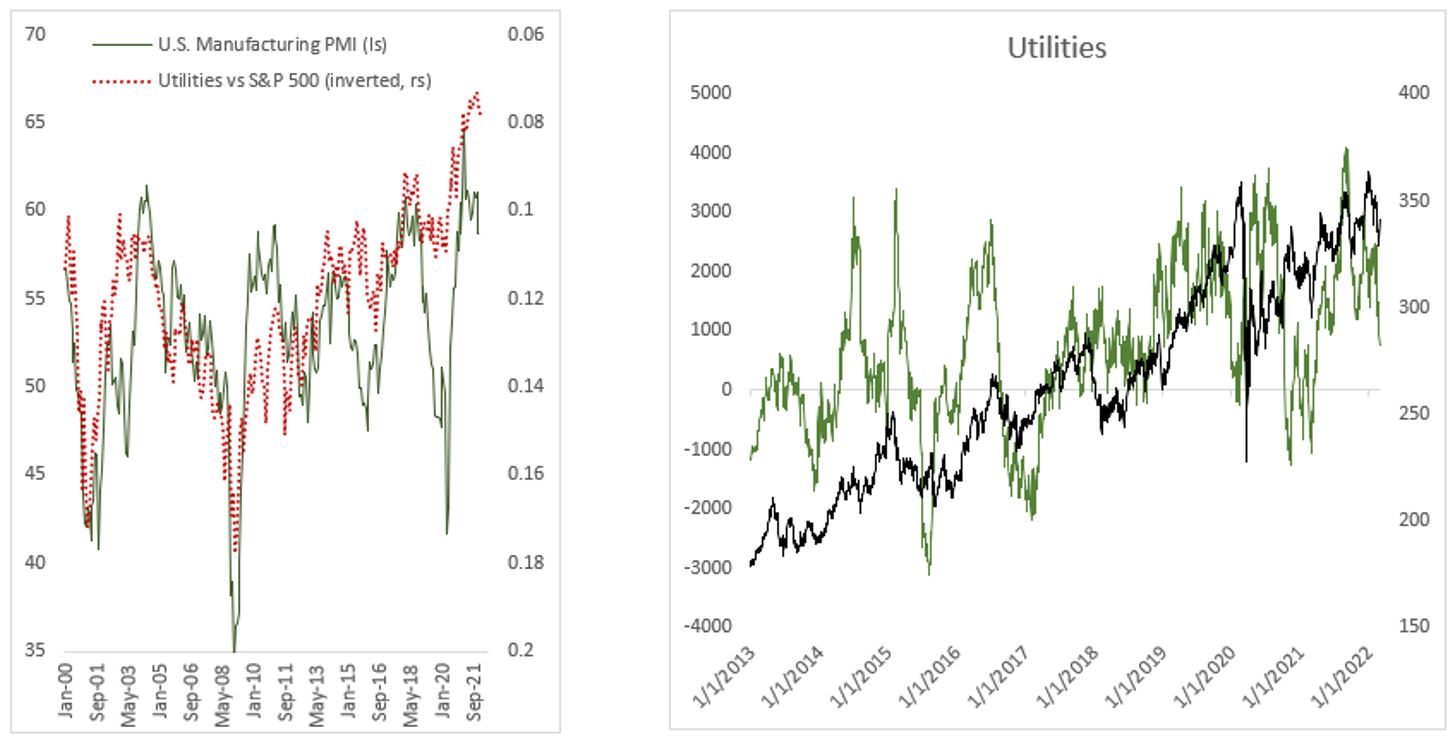
In terms of equity sector allocation, we dislike growth-sensitive sector such as IT and consumer discretionary amid downturn in the cycle and real yield pressure, while overweigh yield-proxy (utilities, staples, real estate). We remain overweigh energy due to a potentially longer higher oil price while maintaining neutral on materials.

Underweight
Info Tech: increase in real yield will moderate valuation froth in the medium term. The sector will be attractive once again near the end of Fed’s tightening cycle. Despite recent correction across growth stocks, multiples remain above historical average and fund flows to the sector likely to moderate.
Consumer Discretionary: growth deceleration bodes poorly for discretionary, frothy valuation and compressing margin (AMZN), bubble stocks (TSLA), end of goods spending binge (LVMH). Fund flows have reversed more drastically relative to its IT counterpart.
Overweight
Consumer Staples: the sector outperforms during period of decline in manufacturing PMI and fund flows have surged this year, which will likely continue in the coming months.
Utilities: a bond-like proxy and defensive sector, utilities tend to outperform during business cycle downturn. Fund flows have moderated but are still in positive territory. Fall in Treasury yields should support the sector.
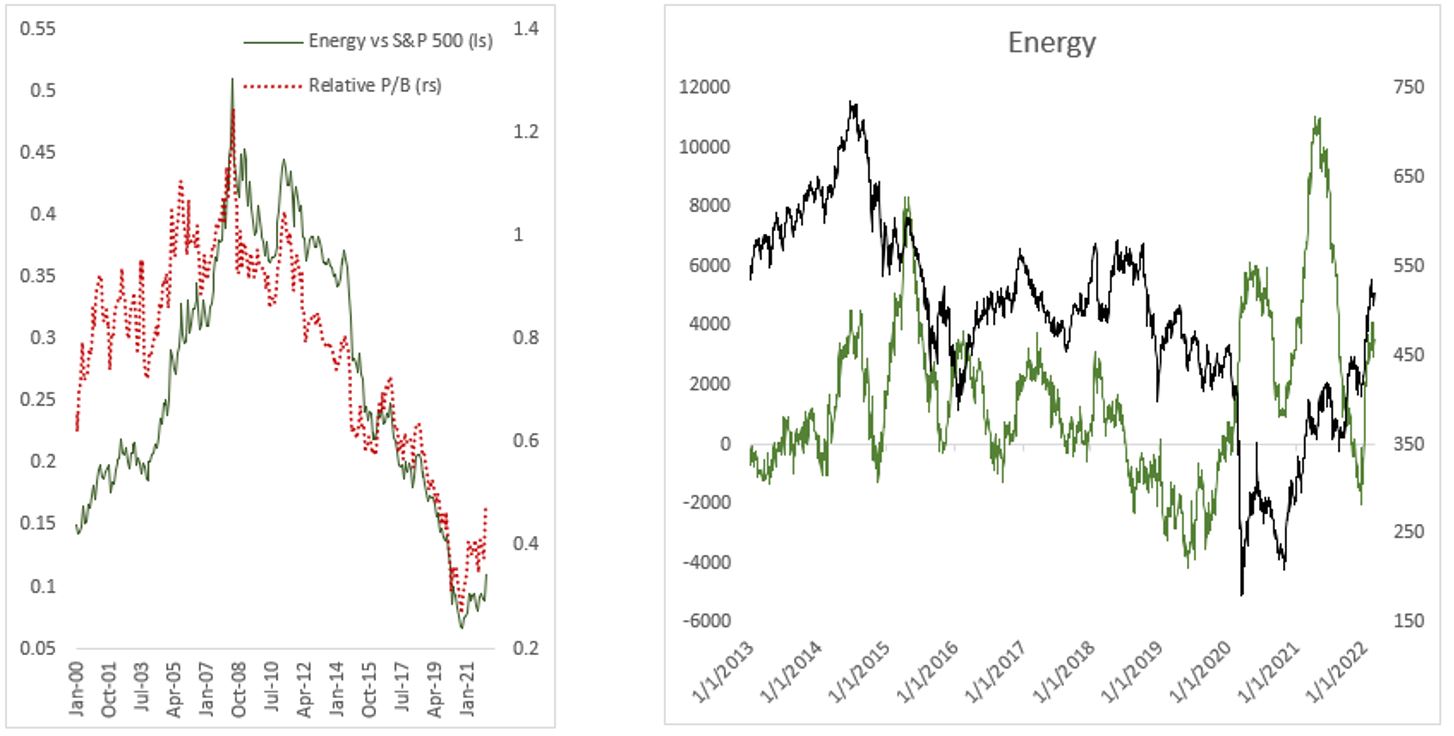
Energy: despite the rally in energy stocks in the past year, the sector remains cheap while earnings outlook is very attractive amid the higher for longer theme for global energy prices. Fund flows will continue to the sector as long as discipline among OPEC+ producers is maintained.
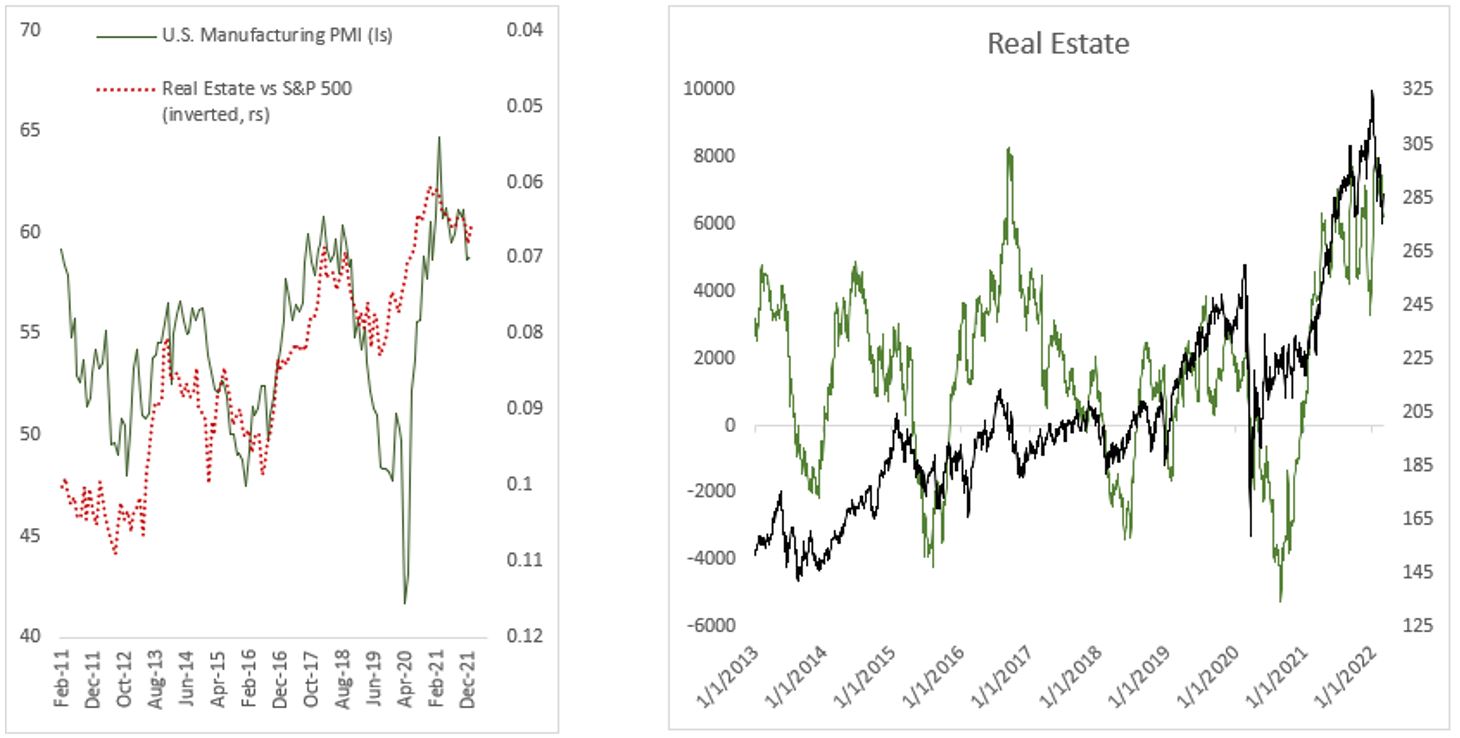
Real Estate: the sector’s defensive nature bodes well during cycle downturn and diminishing concerns related to the pandemic should see occupancy rate normalizes to pre-pandemic level and growth in rental prices.
Neutral
Healthcare: as the Omicron waves abate, surgical procedures and other in-patient hospital treatment should gradually recover. This bodes well for medical devices and non-generic pharma revenues. Exposure to healthcare sector also provides diversification in the portfolio due to its low correlation to changes in monetary policy and defensive nature of the sector.

Financials: Bank stocks benefit from an extended expansion in the economic cycle and rise in real rates. Headwinds from cycle downturn could translate to dramatically lower IB revenue and put a ceiling on loan growth, but potentially be offset by rise in NIM.

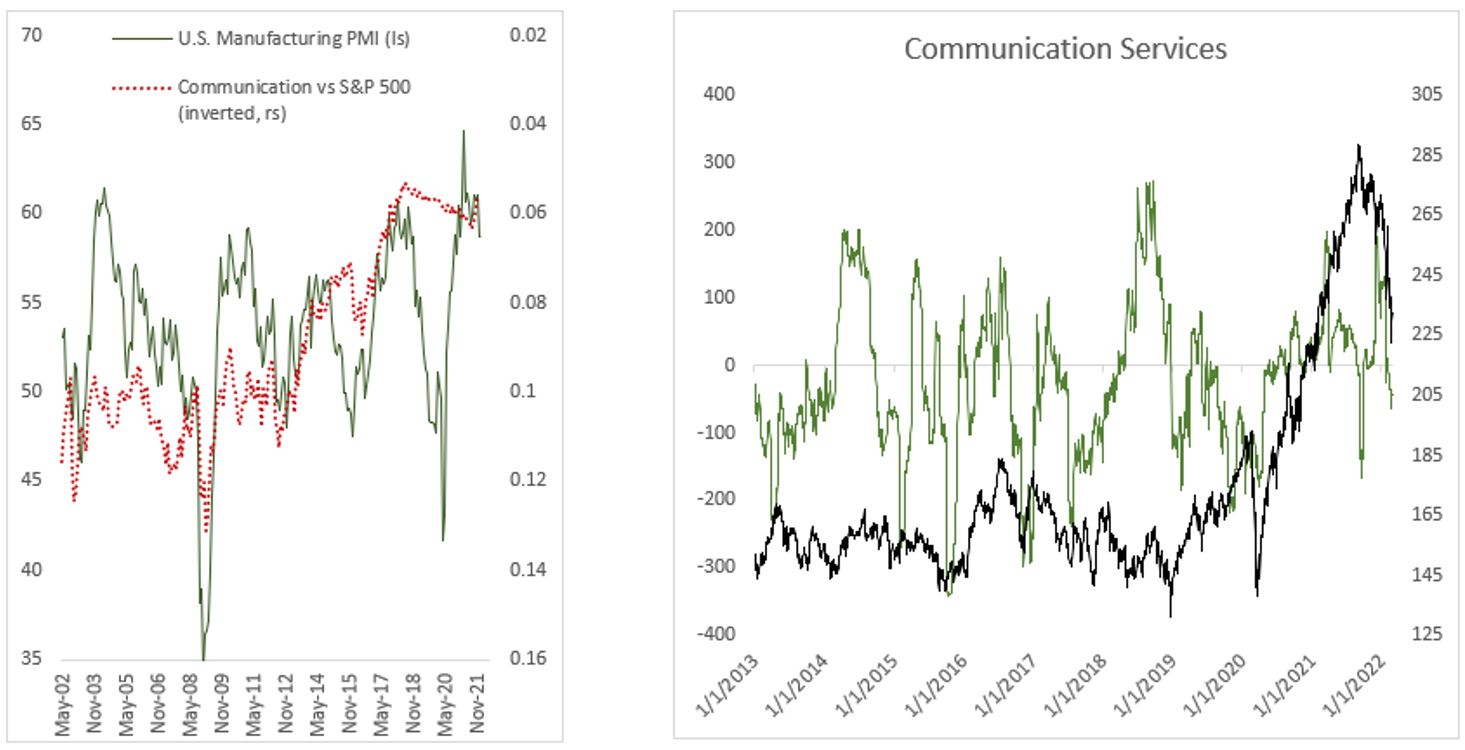
Communications: defensive sector, but fund flows is going to the other direction.
Materials: issue on sector composition that is weighed heavily towards chemicals rather than industrial metals.

Industrials: cycle downturn will weigh the sector’s performance and investors remain heavily bearish, as indicated by fund flows.
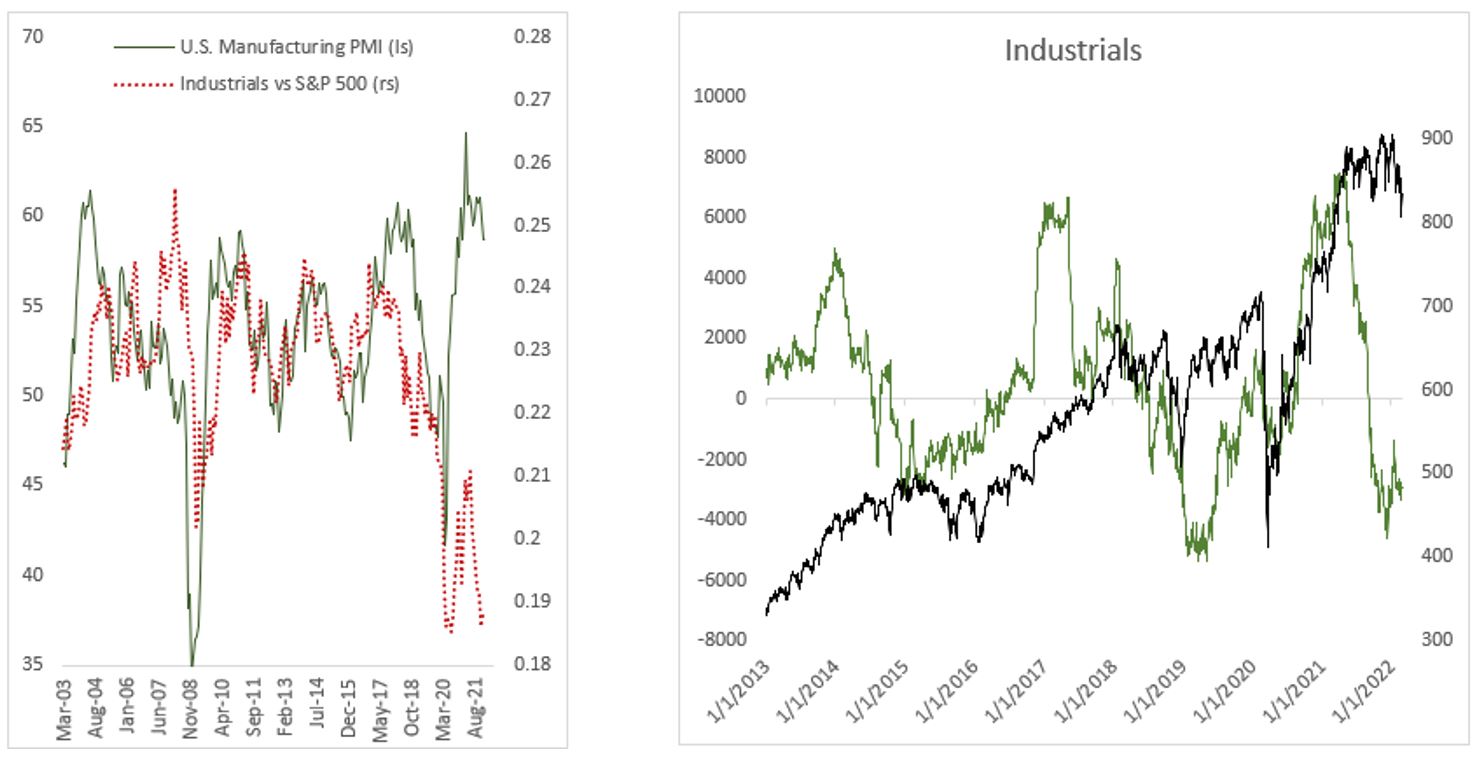
Table 1 shows the valuation percentile of every country in the MSCI ACWI universe based on trailing P/E, forward P/E, and P/B ratio. Broadly speaking, the recent correction has brought valuation to a more reasonable level but remains vulnerable especially for the developed world ex. Japan. Japanese stocks are trading at the 17th percentile, meaning that 83% of the time it was trading at a valuation level higher than currently is. Spanish, British, and Italian stocks are also attractive from valuation perspective. Meanwhile, investors should start accumulating Brazilian stocks, which could deliver sizeable gains once the Fed backs off and the business cycle ticks up again.

Copyright © 2022, Putamen Capital. All rights reserved.
The information, recommendations, analysis and research materials presented in this document are provided for information purposes only and should not be considered or used as an offer or solicitation to sell or buy financial securities or other financial instruments or products, nor to constitute any advice or recommendation with respect to such securities, financial instruments or products. The text, images and other materials contained or displayed on any Putamen Capital products, services, reports, emails or website are proprietary to Putamen Capital and should not be circulated without the expressed authorization of Putamen Capital. Any use of graphs, text or other material from this report by the recipient must acknowledge Putamen Capital as the source and requires advance authorization. Putamen Capital relies on a variety of data providers for economic and financial market information. The data used in this publication may have been obtained from a variety of sources including Bloomberg, Macrobond, CEIC, Choice, MSCI, BofA Merrill Lynch and JP Morgan. The data used, or referred to, in this report are judged to be reliable, but Putamen Capital cannot be held responsible for the accuracy of data used herein.
