Download PDF:
The 2021 post-pandemic recovery has been impressive, with record amount of fiscal stimulus propping up household spending and the corporate sector turning into a capex hyperdrive. Meanwhile, the Fed maintained an ultra-loose monetary policy and tilted toward the dovish side in the first half of the year, which fuel the froth and equities and drove spreads to record low (Chart 1).

Going into 2022, both fiscal and monetary policies will become tighter, and growth will normalize to trend – meaning that the risk to equity multiples is to the downside and earnings growth will moderate. More importantly, the yield curve has started to flatten, which has historically marked increased volatility down the road (Chart 2). To be clear, we are not outright bearish on U.S. stocks amid the impressive trajectory of technology-related companies’ earnings. However, we doubt the S&P500 could return double digit next year.

From a cycle perspective, the peak in U.S. growth is also in the rear-view mirror and global growth will continue to decelerate in the first half of 2022. Chart 3 shows that the lagged impact of tightening in Chinese credit will be increasingly felt until the end of Q1 2022, before the business cycle picks up again – a tailwind for risk assets.

We are on the camp that thinks Fed’s hawkish posturing has become excessive and may drag growth down the road, as has been highlighted by the flattening yield curve, which eventually will force them to backtrack once inflation number disappoints – probably in the Q2 next year. Investors should overweigh duration in a fixed income portfolio in the next 3 months, in anticipation of U.S. 10-year yield dropping to below 1% due to growth issues and rising risk aversion. This means growth stocks could continue to outperform, despite being already expensive. The bottom line is that macro backdrop warrants a more defensive tilt in equity allocation.
Sector Allocation Framework
There are two main inputs in our equity allocation framework: macro factors and fundamentals. For the former, we select sectors that historically benefits during the up and down in the business cycle and layered them with our subjective judgement. Whereas for fundamentals we screen 11 of the GICS sectors by 6 metrics, namely earnings, leverage, margin, return, valuation, and yield. We standardized these factors and averaged them to get a reading of its attractiveness relative to history and other sectors. Ideally, we are looking to overweight (sub)sectors with favorable fundamentals that historically do well during the up/down cycle, which relates to our macro view.

Table 1 shows the Global Industry Classification System (GICS) for stocks, with the breakdown of the 11 main sectors into their more refined level 2 category, and Table 2 shows the correlation of all of these (sub)sectors with the business cycle as proxied by copper/gold ratio, ranked. Unsurprisingly, cyclical sectors such as financials, materials, energy, and industrials all correlate well with the cycle, while healthcare and consumer staples do well during the cycle downturn. Surprisingly, consumer discretionary and IT have a significantly negative correlation with the cycle and mixed performance historically– probably driven by the change in the sector constituent since 2019 MSCI rebalancing. The correlation of these (sub)sectors with the business cycle is visually displayed in Appendix 1.
U.S. stocks are currently trading at an unattractive valuation, despite their strong earnings profile. Our fundamental equity screening (Table 3) shows that only three out of eleven sectors – namely materials, financials, and IT – screen as attractive relative to their respective history. The middle panel of Table 3 ranked the GICS level 2 classification of these subsectors, which allows for a more refined screening method when selecting equity names. Discussion of select (sub)sectors are provided in the next section.

The last panel of Table 3 shows the fundamentals of value/growth and cyclical/defensive stocks, and Appendix 2 highlights the relative performance of these equity styles across the cycle. The message is clear: investors should overweight defensive and growth stocks during the down cycle, despite the worse ranking of these styles relative to cyclical and value.
U.S. Sector Strategy for Q1 2022
The macro environment for early next year supports defensive tilt towards sector that outperforms during business cycle slowdown, as discussed in the first section. This means healthcare and consumer staples are among our top overweight recommendations in the coming 3 months, alongside utilities. Table 3 shows that household & personal products and food, beverages & tobacco rank favorably, whereas pharmaceuticals, biotech & life sciences and food & staples retailing rank poorly amid a mix of declining margin, deteriorating leverage, and poor valuation. Nevertheless, investors should overweight these sectors that will do relatively well during growth deceleration. We will follow up this report with bottom-up equity names selection for each (sub)sectors in the coming months.
The energy sector could also be an exception this time around, despite its relatively poor performance during downturn and bottom rank relative to history and other sectors. We like integrated players such as Exxon and Chevron due to their large reserves and ability to quickly capitalize the ongoing energy crisis. Their forward P/E ratio, at 10.9 and 12.5 time, respectively, is cheap and their outlook is improving as the world realizes that the energy transition to green infrastructure will take longer than previously forecasted. So far, investment in renewables is only meeting the increase in energy demand, keeping the current demand for fossil fuels largely intact – as the recent shortage of coal in India and China and European natural gas shown.
Investors should also accumulate material stocks on weakness amid Chinese policymakers’ effort to reflate the economy. The outlook for materials is negative in the short-term, but weak exploration and investment in the past decade means supplies of various base metals will not keep up with increasing demand that is boosted by investments in renewables. This could be the reason copper price has been remarkably resilient of late despite obvious weakness in the Chinese economy, which consumes over half of global refined copper demand. We believe that the bear market in commodities is in the rear-view mirror, although prices will fluctuate along the global cycle. If our view is correct, current valuation for major miners are cheap, and rising earnings will eventually translate to higher dividend yield – allowing multiples to expand.
On a more negative note, the impact of covid-19 pandemic is particularly prominent on U.S. consumer services, previously known as hotels, restaurants & leisure, which stand out as the worst subsector by various metrics. Not only earnings are down, but leverage profile for these stocks has deteriorated significantly. New covid-19 variants and re-tightening of travel restrictions bode poorly for this sector. The loss of business revenue has hurt the balance sheet of these companies significantly and their recovery will only be gradual. This means their near-term outlook will remain cloudy.
Food & staples retailing also ranks poorly according to our metric (Table 3). This sector includes Walmart, Sysco, Walgreens, Costco, and Kroger. We are recommending underweight this sector amid the tight labor market condition in the U.S., which will pressure margins lower. More importantly, current valuation does not justify the poor outlook of the industry.
The more difficult call for most investors is related to their core holdings: financials and technology stocks listed in consumer discretionary, IT, and communication sector. With the yield curve flattening, will banks’ margin compression be offset by the booming investment banking revenue? And how far could multiple expansion go for the bulletproof tech stocks? Will their earnings growth be impeded by the regulatory headwind, as has been happening in China? We do not pretend to have the answer to these questions, but some observations are in order.
First, related to financial sector, despite being cheap and rank favorably in our selection framework, the sector will continue to face a structural headwind. The decline in U.S. 10-year yield is a sign of excess savings problem that has plagued the world since turn of millennium. The lack of investment opportunities translates to weak credit growth and narrowing net interest margin, whereas zombie firms – propped up by easy credit and low interest rate – weighed down credit quality. It is difficult for financials to do well when the overall economy is weak (Chart 4). Japanese banks are prime example of how the excess savings and flat yield curve weighed down the banking sector. The difference in the U.S. is that it has deeper pool of capital and market innovation where companies largely borrow in the bond market rather than through bank loans, which allows investment banking revenue to thrive.

Second, on the “tech” valuation issue, we think the stars are still aligned for them to outperform the equity benchmark, although risks are rising. U.S. Treasury yield could go lower to 1% level in the firsts half next year and drive multiple expansion into an overdrive as growth opportunities becoming scarcer while earnings of these tech champions will continue to grow at a rapid pace. Chart 5 shows the forward P/E ratio of three sectors where tech companies are listed and dominate the index. It is interesting how these three sectors valuation is largely driven by its tech constituents.
- Consumer discretionary includes Amazon (50.1x forward earnings)
- IT includes Microsoft (34.7x), Apple (31x), NVIDIA (60.3x)
- Communication includes Google (23.9x), Facebook (21.3x), Netflix (46.6x)
This leave investors the risk of regulatory tightening in the U.S., not unlike those happening in China this year. For example, Alibaba’s multiple has been cut by more than half since the Chinese government crackdown on tech companies began. In Q2 2021, Alibaba P/E, P/B and P/S ratio is 55x, 6.3x, and 9.1x, respectively, vs 18.5x, 2.2x, and 2.6x currently. BABA’s stock price has dropped 44% since July despite its earnings estimated to grow 30% this year. Tencent’s multiple de-rating has been milder, with P/E, P/B, and P/S ratio in Q2 2021 being 24.5x, 5.5x, and 8.7x, respectively, vs 19.5x, 4.4x, and 6.7x currently. The lesson from Chinese tech implies 20-50% downside risk in U.S. tech stocks coming from multiple contraction.
Given the “tech” accounts for about 30% of U.S. index, a simple back of the envelope calculation suggests that S&P500 could be 6-12% lower should the regulatory front becomes an issue. We doubt this is imminent, given the lax tendency of U.S. regulators for the tech giants.
Appendix 1
Sectors that are underperforming during growth slowdown: Energy, Financials, Industrials, Materials

Sectors that are outperforming during growth slowdown: Consumer Staples, Health Care, Utilities, Communication

Sectors with mixed performance across the cycle: IT and Consumer Discretionary

Appendix 2
Growth Slowdown = outperformance of defensive and growth stocks

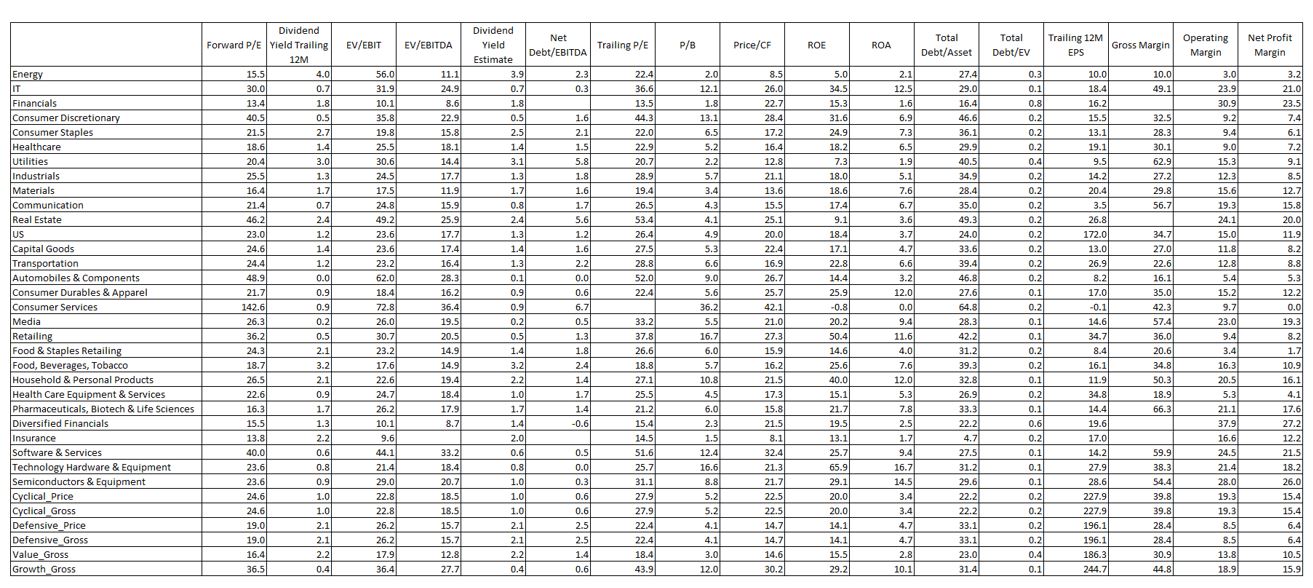
Appendix 3 – U.S. Sector Fundamental Ratios
Copyright © 2021, Putamen Capital. All rights reserved.
The information, recommendations, analysis and research materials presented in this document are provided for information purposes only and should not be considered or used as an offer or solicitation to sell or buy financial securities or other financial instruments or products, nor to constitute any advice or recommendation with respect to such securities, financial instruments or products. The text, images and other materials contained or displayed on any Putamen Capital products, services, reports, emails or website are proprietary to Putamen Capital and should not be circulated without the expressed authorization of Putamen Capital. Any use of graphs, text or other material from this report by the recipient must acknowledge Putamen Capital as the source and requires advance authorization. Putamen Capital relies on a variety of data providers for economic and financial market information. The data used in this publication may have been obtained from a variety of sources including Bloomberg, Macrobond, CEIC, Choice, MSCI, BofA Merrill Lynch and JP Morgan. The data used, or referred to, in this report are judged to be reliable, but Putamen Capital cannot be held responsible for the accuracy of data used herein.
