Download PDF:
EM Equity Earnings Outlook
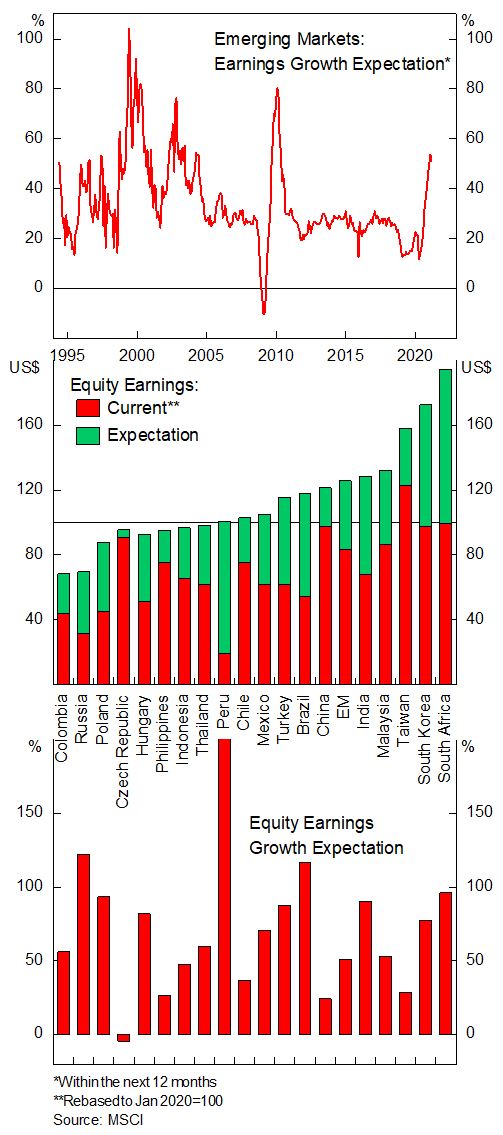
The broad EM benchmark has rallied hard in the past year and is now some 15% above the pre-pandemic level. After the fall in earnings for most EM countries – with EM benchmark’s earnings currently still 17% below January 2020 level – the market is now expecting sharp earnings rebound, with most countries’ earnings expected to increase to above pre-pandemic level by year end (Chart 1). Some observations are noteworthy related to EM earnings outlook going forward that support our rotation strategy towards resource-rich countries:
- China, South Korea, and Taiwan – three bourses that account for 65% of EM benchmark – were able to withstand the pandemic without seeing significant earnings contraction in the past year and hence will see much lower earnings growth this year relative to the rest of EM. Emerging Asian stocks are no longer cheap, relative to their historical average and EM benchmark, and their earnings will have to deliver for these bourses to justify their current valuation.
- Countries whose earnings were hit the hardest last year will also be the one to see large rise this year, with Peruvian, Brazilian, and Russian stocks’ profit set to more than double the current level. In addition to the positive earnings outlook, these commodity-intensive bourses are also trading at cheaper valuation relative to EM benchmark, meaning that unlike those for EM Asia, there is room for multiples to rise amid earnings improvement. Currencies in these countries also tend to be undervalued, according to our fair value estimate.
- We maintain our constructive view towards commodity prices, which play an important role for Latam countries’ earnings, and see potential for large positive surprise. For instance, copper, soybean, and iron ore prices are now 40%, 45%, and 80% above pre-pandemic level, respectively, while expectation for commodity-heavy bourse’s earnings has not caught up fast enough. Chilean and Peruvian earnings are only expected to rebound to January 2020 level by next year, while Brazilian earnings to grow by only 18%. Historically, such double digit rise in commodity prices has led to a dramatic improvement in these bourses’ earnings, with a lag of six to twelve months, and is a strong tailwind for their currencies.
The bottom line is that EM equities should continue to do well going forward amid still favorable policy environment and broad earnings improvement. Going forward, returns will increasingly be driven by earnings improvement rather than multiplier expansion, and we are betting that Latam stocks will outperform their Asian counterpart on both.
EM Equity Valuation
The broad rally since the pandemic bottom last March has propelled EM equity valuation to an elevated level – with traditional valuation indicator such as P/E, forward P/E, and P/B ratio for many countries now above the 90th percentile – but our favorite indicator for equity valuation, cyclically adjusted P/E (CAPE) ratio, only points to an above average but not extreme valuation for major countries (Table 1 and Chart 2), except for Taiwan that has benefitted from massive boost in semiconductor demand and has rallied hard in the past year.

The policy and growth environment are still conducive for EM risk assets to go higher, but investors need to be more selective in terms of country and sector allocation. EM countries’ valuation divergences and EM benchmark discount relative to DM could be explained by the sectoral composition of respective indices – with tech-heavy bourse commanding higher multiples – and controlling for sector weight eliminates the valuation discount (Chart 3). In the past few quarters, we have been recommending clients to rotate from the expensive Asian bourse into commodity rich Latin American countries and reiterate this view for the coming months. We are not excluding the possibility that these expensive and tech-heavy Asian bourses could rally further but see greater value outside Asia.

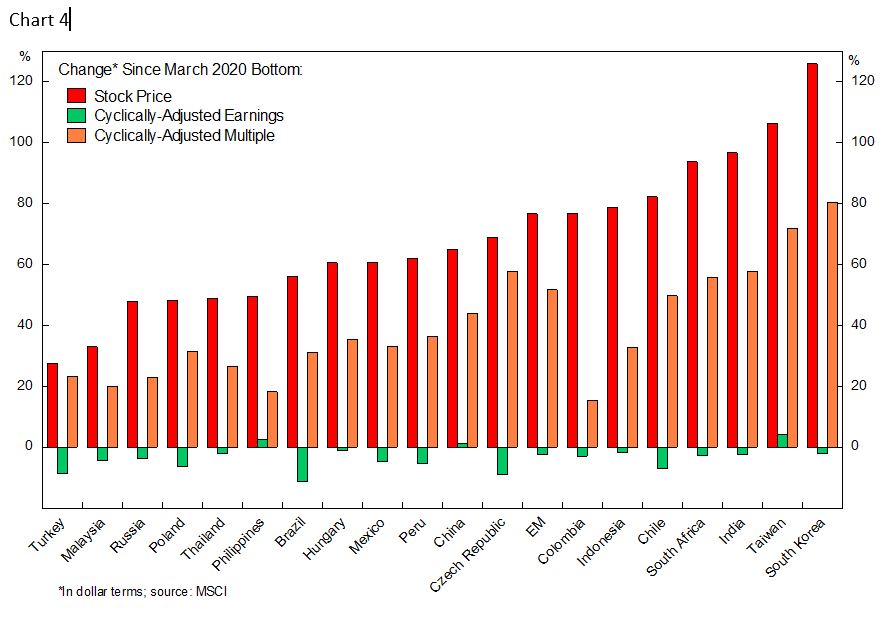
More importantly, Chart 4 shows that the outperformance of Asian bourse has been driven mainly by multiple expansion, which should have difficulty expanding further going forward, while the increase in valuation multiples outside Asia has not been as dramatic. Investors should rotate out of South Korean, Taiwanese, and Indian equities into resource-heavy countries, which will benefit from the boom in commodity prices and whose valuation are still cheap. Few observations are in order:
- Russian and Colombian cyclically adjusted earnings are currently near its historical low and should enjoy tailwind from higher oil prices, which not only will directly boost the EPS of its market, but also a boon for their currency value against the dollar.
- Chile and Peru will benefit from higher copper prices, as discussed in a previous report. The two countries’ economy and exports are heavily dependent on the global consumption of the metal, which will see structural rise and potentially develop into multi-year bull market amid rising renewables demand and EVs trend.
- The broad rally in metals and agriculture products will also increase the profitability of Brazilian, Malaysian, and Indonesian stocks. Rising palm oil and coal prices are boosting Indonesian and Malaysian terms of trade, while higher iron ore prices have resulted in the surge of Brazilian exports price, all of which has historically led earnings of these countries.
- The outlook for Turkish equity is also improving. The country’s reserves situation and inflation have started to stabilize, and foreign capital has been flowing back in recent quarter, which should help the country avoids crunch in its balance of payment. The valuation case for the country asset market is straightforward, Turkish equity is trading at only 4.9x cyclically adjusted earnings and the Lira is 20% undervalued, according to our fair value estimate.
Value Sector Selection
Energy stocks have been battered hard amid the low oil prices in the past decade and hit to the EPS. With profitability on a structural decline after peaking in the mid-2000’s, it is difficult for multiples to rise from current level, meaning that earnings will drive the performance of the sector.
Financials relative performance has historically ebb and flow with the business cycle, however, recent undershoot may be proven to be unwarranted. Historic fiscal and monetary support provided by the government during the pandemic creates a buffer for business from defaulting, which should cap the rise in non-performing loans. Moreover, rising long-term yield amid low policy rate should further bolster banks’ profit margin.
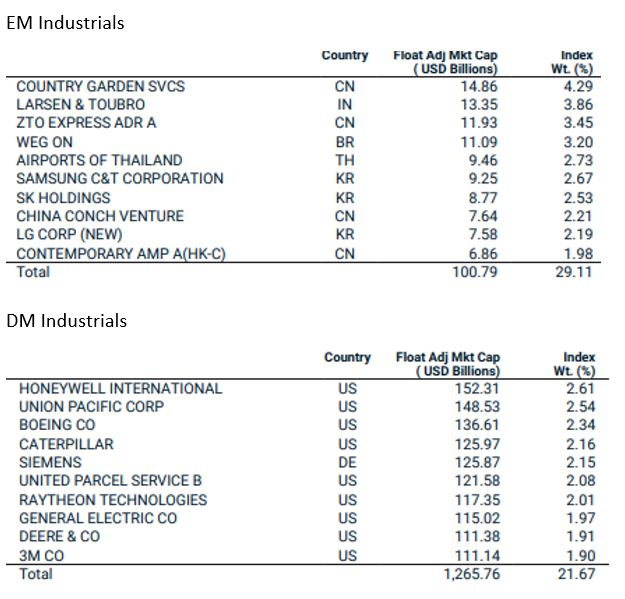
EM Industrials have underperformed massively since 1995, weighed by the falling earnings. Unlike DM industrials, where many innovative world leaders in engineering are classified, EM industrials are dominated by construction companies, which depends on local political and growth environment to thrive. In the past decade, a combination of low growth, political uncertainty, and crackdown on corruption – especially in China and South Korea – has translated to a stricter vetting process for construction projects and may have weighed the performance of EM industrials.
Materials relative performance tracked commodity prices, and forward P/E, currently at 10 times, has room for further upside amid rising earnings. The outlook for materials should remain bullish especially if overkill in policy tightening in China is avoided.
Copyright © 2021, Putamen Capital. All rights reserved.
The information, recommendations, analysis and research materials presented in this document are provided for information purposes only and should not be considered or used as an offer or solicitation to sell or buy financial securities or other financial instruments or products, nor to constitute any advice or recommendation with respect to such securities, financial instruments or products. The text, images and other materials contained or displayed on any Putamen Capital products, services, reports, emails or website are proprietary to Putamen Capital and should not be circulated without the expressed authorization of Putamen Capital. Any use of graphs, text or other material from this report by the recipient must acknowledge Putamen Capital as the source and requires advance authorization. Putamen Capital relies on a variety of data providers for economic and financial market information. The data used, or referred to, in this report are judged to be reliable, but Putamen Capital cannot be held responsible for the accuracy of data used herein.
