Download PDF:
Part I: Silver
Last week seen silver prices dropped remarkably amid rising long-term bond yield and receding dollar weakness. We have been constructive on the precious metal and commodity complex for a while now and remain to be so in the reflationary environment. There are reasons to believe that the commodity bull market is driven by structural forces, such as low investment in the past decade and demand from green energy infrastructure. We will follow up on this topic in coming week. As for silver, we think the metal still has plenty of room on the upside and outperform gold, based on few reasons:
- Despite the broad dollar weakness that has been happening since last year, we believe that further downside of the dollar is likely due to relatively lower real yield and higher fiscal and current account deficit in the U.S. It is not impossible for the DXY to trend lower to 80 level in this cycle, which will benefit commodities, emerging market assets, and precious metals. Between 2001 and the Global Financial Crisis when the dollar was on a cyclical bear market, gold price jumped 3.5 times while silver surged 5 times; the dollar index topped out in early 2017 during the current cycle and both gold and silver prices have surged over 60% since.
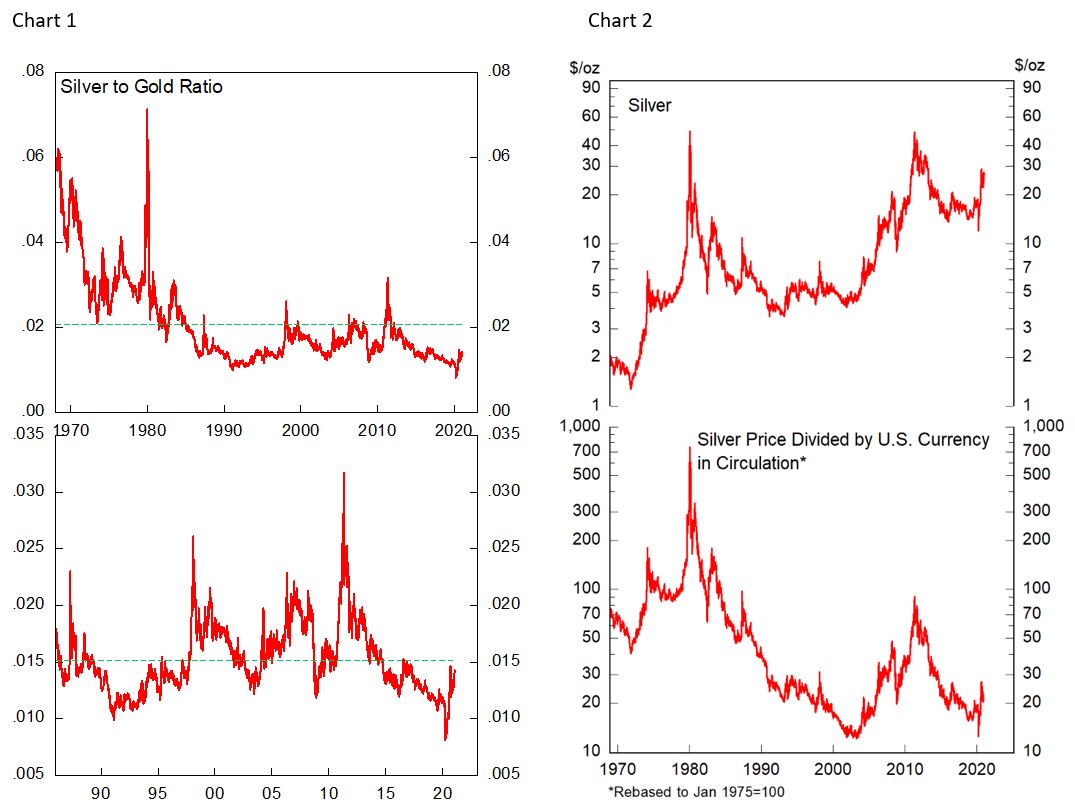
- Chart 1 shows Silver/Gold ratio remains below its long-term average, whether measured since 1970s or 1985 (post-bubble crash). A mean-reversal of the ratio to 60:1 would imply further 15% appreciation of silver relative to gold ($25 per Oz at the time of writing). On the issue of currency debasement, silver relative to U.S. money in circulation is also still hovering below historical average (Chart 2). Further fiscal and monetary stimulus in the U.S. will drive up M2 and push silver price higher just to maintain the ratio at current level. Moreover, on the technical side, much of the froth in price speculation in Summer 2020 has been quelled with silver correcting over 15% in matter of days in September.
- U.S. real yield will likely stay at -1% rate, as 10-year Treasury likely peak around 1.5% and inflation breakeven reach 2.5%, buoying risky asset and precious metal prices. Under the current Fed framework, where inflation need to overshoot 2% before the Fed start raising rate, long-term Treasury yield will remain depressed while inflation breakeven rise (Chart 3). Our bet is that 10-year yield would peak before 1.5% while inflation breakeven creep to 2.5% as growth outlook improves. Historical correlation in this scenario suggests silver price around $30-50/Oz (Chart 4 and 5).


The bottom line is that we see further increase in silver price to at least $30/Oz with a potential to overshoot to $50/Oz depending on the underlying macro condition and prospect of stronger than expected inflation.
Part II: Global Equity
Last quarter we rotated our core equity holdings from Mexican to Chilean and Turkish assets, taking profit on our call options on Mexican equity amid overbought condition that we thought was overdue for consolidation (the market rally another 10% afterward). Meanwhile, our LEAPS positions on Chile and Turkey’s equity have more than doubled and we remain to be bullish for few reasons:
- First, stock valuation for both countries remain among the cheapest globally and far below historical average (Chart 6). In fact, both Turkish and Chilean cyclically adjusted P/E ratio has the greatest downward deviation from its long-term average at a time when equity valuation in the developing world is far above its historical average or even at all time high (Chart 7).

- Second, both countries’ currency is undervalued, with the TRY massively depressed amid an exodus from Turkish assets in 2020 amid ultra-loose monetary policy and concerns on reserves adequacy. Going forward, there has been fundamental changes in Turkish monetary policy that could further propel rally in the Lira while Chilean Peso is likely buoyed by high copper prices, which has not been reflected in the currency appreciation.
- Third, the cyclical rebound in global growth will continue to propel commodity prices higher and boost equity earnings. High copper price bodes well for Chilean stocks’ earnings and the manufacturing rebound in Europe will benefit Turkish stocks, which are integrated to EU manufacturing complex. We are forecasting a 25% rise in both earnings in dollar terms and forward earnings multiple for Turkish equity, which point to a further 56% increase in prices from current level. Meanwhile, we are expecting 60% rise in forward earnings and 15% contraction in forward earnings multiple, which combined sum to a potential 36% increase in prices.
In sum, investors need to be selective in terms of country allocation, as many are already bid up into extreme level while few are still providing attractive valuation and growth prospect. At Putamen Capital, we remain overweight the laggards and have benefitted from their catch-up to the developed world.
Copyright © 2021, Putamen Capital. All rights reserved.
The information, recommendations, analysis and research materials presented in this document are provided for information purposes only and should not be considered or used as an offer or solicitation to sell or buy financial securities or other financial instruments or products, nor to constitute any advice or recommendation with respect to such securities, financial instruments or products. The text, images and other materials contained or displayed on any Putamen Capital products, services, reports, emails or website are proprietary to Putamen Capital and should not be circulated without the expressed authorization of Putamen Capital. Any use of graphs, text or other material from this report by the recipient must acknowledge Putamen Capital as the source and requires advance authorization. Putamen Capital relies on a variety of data providers for economic and financial market information. The data used, or referred to, in this report are judged to be reliable, but Putamen Capital cannot be held responsible for the accuracy of data used herein.
