Download PDF:
Preparing the Groundwork for A Takeoff
Indonesia’s macro profile has significantly improved in the past decade despite still running fiscal and current account deficit. First, government spending has been reoriented toward building human and capital stock, supported by the country’s high savings rate, while public debt level remained among the lowest across EM countries. Second, monetary policy has been kept on a tighter stance, resulting in disinflationary forces in recent years and a relatively stable rupiah. Lastly, foreign-currency borrowing, albeit more than doubled in the past decade, is coming from a low base and has largely been due to the government rather than corporate sector.
Under the current government led by Jokowi, the government has been shifting more public spending toward productivity-enhancing investment and cutting the controversial (oil) subsidies that has taken a third of the government budget in the past (Chart 1). Historically, such action has led to a spiral in inflation and weakened the rupiah, the consequences of which often result in social unrest. However, by keeping monetary policy on a tighter stance and implementing macroprudential regulation amid falling oil prices, inflationary pressure was muted, and the economic growth was only slightly slowed (Chart 2).

The theme of his presidency centered around building transportation infrastructure across the country and improving the welfare of poor people, realized by the introduction of national health insurance (Jaminan Kesehatan Nasional) and educational aid (Kartu Indonesia Pintar) for poor or vulnerable families. For the second term of Jokowi presidency, he further planned infrastructure projects worth some $400 billion (40% GDP) for the period of 2020-2024, including building 25 airports, power plants and various transports and roads connecting the country. Around 60% of the total will be financed directly by the government, a quarter through SOE and the rest through private enterprises. This is in-line with the government spending on infrastructure averaging 2.5% of GDP in the first term of his presidency (Chart 3).
To finance the fiscal deficit, Indonesian government has been increasing its issuance of foreign-currency debt (Chart 4). Although this increases the sovereign default risk, it is important to note that Indonesian government borrowing relative to the size of its economy is among the lower one in EM space (Chart 5). Moreover, the average nominal growth of the country is still higher than its borrowing cost, easing the concern related to debt sustainability.

Post-2008 financial crisis, Indonesian savings rate have risen tremendously. Gross national savings rate increased from 24% in 2007 to 32% currently, while investment demand also accelerated, resulting in a necessary capital inflow to the country (Chart 6). The high savings rate relative to other developing countries and proactive government policy to boost capital building activities bode well for the country’s outlook, as increasing capital stock boost productivity in the long run (Chart 7 and 8).

Indonesian exports are still reliant of primary goods, with a third of the total dominated by palm oils, coal, natural gas, and base metals. The country’s goods trade balance has largely recorded surplus, with a large amount of non-oil and gas trade surplus offset by oil & gas trade deficits (Chart 9). However, the government’s push toward greater use of biodiesel for public transport fuels, although still at a small scale, and the fuel self-sufficiency goal introduced in 2017 are likely to reduce the oil & gas trade deficit in the long run. Capital investment of Pertamina, the national oil producer, has been ramping up in recent years and oil lifting has risen from 550 million barrel/day in 2014 to 923 million barrel/day this year, a significant chunk of the national energy consumption of 1.8 million barrel/day.

Real interest rate has always been largely kept above zero post-2008 as Bank Indonesia prioritize monetary stability over supporting growth (Chart 10). Due to traumatic experience of repeated crisis resulting from widespread foreign currency borrowing in the corporate sector and rupiah’s depreciation, Indonesian central bank has always been wary of excessive depreciation in the rupiah and often intervene to reduce volatility. The bias for tighter monetary policy has resulted in disinflationary trend in the past few years.

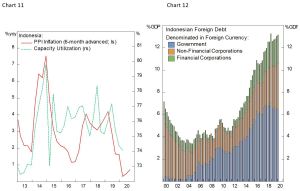
As a result of uncertain global growth prospect of late and weaker domestic demand, PPI inflation has been decelerating, a trend supported by declining capacity utilization, both of which bode poorly for corporate profits, a topic discussed on the section below (Chart 11).
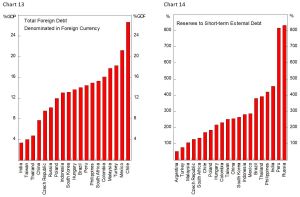
Prior to the Asian crisis, Indonesian corporates have largely borrowed in foreign-currency denominated loans. The banking crisis and wave of defaults proceeding the collapse in Rupiah have shifted the trend, with the government’s foreign-currency borrowing increasing significantly while corporate sector’s borrowing size remains the same, relative to the economy (Chart 12). However, despite foreign-currency borrowing has more than doubled in post-2008 crisis from 5% of GDP to 13% of GDP currently, Indonesia still ranks favorably in EM universe in terms of foreign debt level relative to its economy and foreign reserves (Chart 13 and 14).
The Under-levered Economy and Investment Case for Indonesian Equities
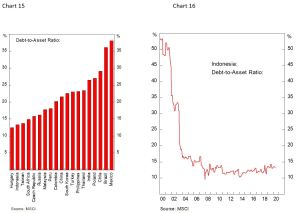
Indonesian corporate sector balance sheet is probably one of the healthiest in EM universe, with debt-to-asset ratio as low as 13% (Chart 15). In a previous report, we have noted that EM firms have much lower leveraged compared to DM, even after adjusting for sector differences. In this case, Indonesia is an extreme example of conservativeness among EM corporates, which make the country’s corporate sector much more likely to survive from the halt in economic activities resulting from COVID-19 lockdown.
The hesitancy of corporate sector to gobble up debt resulted from its traumatic experience during the Asian crisis, when almost all banks in the country went to a restructuring process or a government bailout while non-financial firms were being bought out for cheap by foreign investors (Chart 16). This “survival first” instinct, although bode well for solvency, has been a drag on profitability. Going forward, it is likely that declining borrowing cost attract more firms to lever up their balance sheet and improve return to shareholders.
In fact, the return on assets (ROA) of Indonesian firms is among the highest across EM, second only to Russia (Chart 17). Levering up the balance sheet of Indonesian corporates toward EM average will boost shareholder’s profit (EPS) significantly and rerating of valuation multiples is likely. Fundamentally, Indonesian firms are supported from the demand of its large population and rising living standard, providing a tailwind for consumer-related firms.
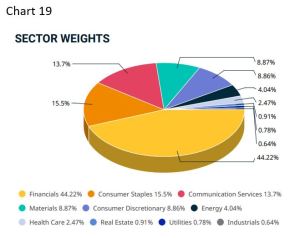
Indonesian banking sector’s profits are high and Capital Adequacy Ratio (CAR) is well above Basel III standard, highlighting the capacity for domestic banks to supply credit to the economy (Chart 18). The still low credit disbursement in the economy and high net interest margin set the positive outlook for the sector, although valuation is not cheap for the top big banks, dominated by 4 large SOE and 1 private banks. Indonesian benchmark equity index is heavily tilted towards financials, in which many are exposed to commodity-related activities (Chart 19).

Over the past decade, Indonesian firms’ profitability have been drifting downward, driven by lower commodity prices, and is reflected in the weak PPI inflation relative to consumer price index (Chart 20). Cyclically, however, the continuation of weakening dollar amid Chinese growth acceleration and easy Fed policy may drive commodity prices much higher, which bode well for EM in general and commodity-sensitive markets in particular, such as Latin American countries, Russia and Indonesia.
The trend of lower ROE in the past decade, exacerbated by the current market rout, has pushed down price-to-book value of Indonesian equities to near all time low today and forward P/E ratio is trading at the lower end of 10-16 times (Chart 21). The market has cheapened enough that further downside risk is limited. Meanwhile, several tailwinds will likely drive Indonesian stocks higher. First, with Bank Indonesia holding interest rate at a low level amid low inflationary pressure and stable rupiah, it is very likely that Indonesian bond yields will drift further downward, reducing the country’s risk premium and equity’s cost of capital, both of which will drive valuation multiple higher. Second, earnings will likely bottom at the second half of the year as the lockdown-induced slowdown hit demands for Indonesian primary goods exports and domestic demand. Third, with a much stronger corporate balance sheet and banking system compared to other EM countries, Indonesian equities deserve a premium over EM at large, especially over a stricken country like India.
Bottom line: Structural and cyclical forces are favorable for Indonesian equities to go significantly higher.

Copyright© 2020, Putamen Capital. All rights reserved. The information, recommendations, analysis and research materials presented in this document are provided for information purposes only and should not be considered or used as an offer or solicitation to sell or buy financial securities or other financial instruments or products, nor to constitute any advice or recommendation with respect to such securities, financial instruments or products. The text, images and other materials contained or displayed on any Putamen Capital products, services, reports, emails or website are proprietary to Putamen Capital and should not be circulated without the expressed authorization of Putamen Capital. Any use of graphs, text or other material from this report by the recipient must acknowledge Putamen Capital as the source and requires advance authorization. Putamen Capital relies on a variety of data providers for economic and financial market information. The data used, or referred to, in this report are judged to be reliable, but Putamen Capital cannot be held responsible for the accuracy of data used herein.
