Download PDF: Monthly_202002
Part I: EM Equity Performance in the Past Decade
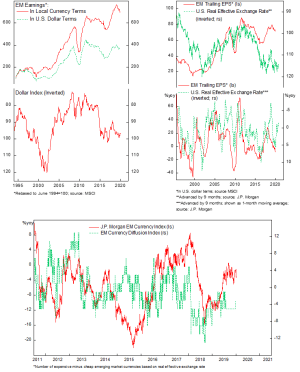
In the past decade, investing in Emerging Markets equity has not been particularly rewarding for most investors. Much of it could be blamed to the weakness of EM currencies against the greenback, rather than lackluster earnings growth in EM countries. All EM economies, except Thailand and South Korea, posted a currency depreciation against the dollar between 2011 and 2019 (Chart 1). As a result, EM earnings in U.S. dollar terms are currently on a similar level as it was before the GFC.

The factors that resulted in dollar strength, on top of the negative translation effect, also impact EM earnings cycle itself. This mostly related to global liquidity condition, change in commodity prices and monetary policy response from EM central banks as the Fed tightens. Chart 2 and 3 show that EM earnings in local-currency terms follow the ebb and flow of the dollar.
The good news is that after rounds of U.S. monetary tightening last year, the Fed is putting further rate hike off the table and the dollar seems to have peaked out late last year. These should bode well for Emerging Markets stocks and currencies:
- Emerging Markets equities are a leveraged play of the dollar with both earnings and multiples expanding during dollar bear cycles. After a sluggish profit growth since 2018, this year our EM EPS model is predicting 20% gain for earnings in local-currency terms. Meanwhile, valuation multiples, at the average of historical level, is not particularly demanding.
- EM currencies have remained cheap. Our EM currency diffusion index, which summarize the number of expensive relative to cheap currencies based of real effective exchange rate, indicates that EM currencies in general are cheap and unlikely to depreciate much from the current level (Chart 4). We particularly like Turkish Lira, Malaysian Ringgit, South African Rand and Mexican Peso.

Part II: Sector-Adjusted EM Valuation
For a while, we have been cautious against lumping EM countries into one EM basket as the growth characteristics, external profile, inflation and outlook vary widely across the cycle. In short, each EM country profile must be scrutinized individually, including the sector composition of their equity market. As an aggregate, however, EM equities tend to have higher weights of cyclical sector such as financials, consumer discretionary, energy and materials (Table 1).
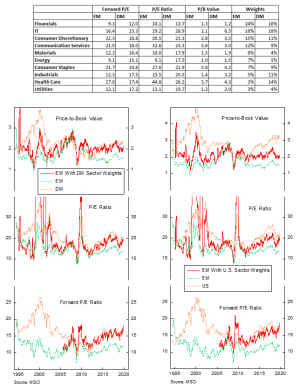
Pundits have correctly argued that after adjusting for sectoral weights, EM stocks do not look as cheap and are trading at a similar P/E multiple to developed countries benchmark (Chart 5 and 6). Price-to-book ratio, however, is still lower than DM or U.S. benchmark, which highlights the lower ROE of EM stocks. Several observations are in order (Chart 7 and 8):
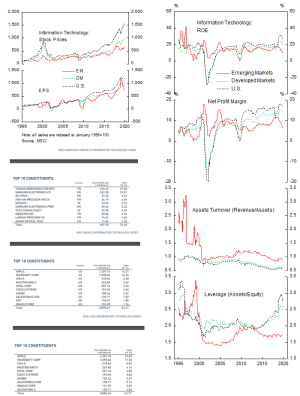
- Net profit margin of EM firms overall is on par with DM counterparts, but lower than U.S, after adjusting for sector weights. This implies similar competitive environment for both EM and DM firms in a globalized world that benefits firm with the lowest cost structure for commoditized products. However, this generalization is not true for two sectors, financials and technology, as the former is affected by different regulation between countries and the later is comprised of a widely different part of the value chain in the EM vs DM framework, as we will discuss below.
- ROA of EM equities after adjusting for the sector difference is much higher than the DM and U.S. counterparts. This implies higher asset turnover for EM firms in general, being more efficient in utilizing their assets. The higher margin and turnover of financial firms in EM compared to DM overall contributed to this trend.
- Similar margin and a higher turnover, but still a lower ROE points out to the lower leverage of EM equities. This is indeed the case. The leverage gap between sector-adjusted EM equities against DM and U.S. stocks is large and has not narrowed significantly in the past decade. Whereas DM, especially U.S., firms have been aggressively buying back its stocks, EM firms have been run conservatively and avoid leveraging its balance sheet. This condition is particularly acute for South Korean firms, which has been known to withhold cash instead of distributing it to shareholders.

Part III: Sector Comparison of Emerging, Developed and U.S. Equity Market
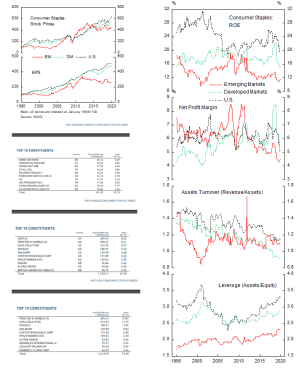
- Consumer Staples sector’s EPS in EM has been flat since 2013 due to the falling net profit margin. The weak growth in EM countries have played a part in depressing consumer demand and limit firms’ pricing power; net profit margin has consistently decline since GFC, which is also the beginning of downtrend of commodity prices and is currently at an all time low. The weak ROE (12%) against DM (16%) and US (20%) has also been driven by the lower gearing of EM (2.4x vs 2.9x for DM and 3.4x for US). Story: low inflation and wage growth in EM countries will increase consumer’s purchasing power and allow daily goods producers to raise prices and margin. Moreover, the increasing middle-class family across EM countries should bode well for demand growth of consumer products (Indonesia, India, Mexico, Brazil, Vietnam, Russia). However, the “Amazon effect” may limit the expansion of profit margin.
- In Consumer Discretionary, EM underperformance is mainly driven by the outperformance of Amazon in the DM and US index. However, ROE have also been contracting due to declining leverage and asset turnover contributed by the declining revenue of the sector related to the weak consumer’s wage growth. Story: the EM Consumer Discretionary is a play on China tech firms (Alibaba, Tencent, JD).

- Energy sector in EM/DM/US have all similar characteristics. EM ROE is higher than DM/U.S. but valuation is cheaper. Story: prefer EM energy, especially Russia, compared to DM/US energy on the up cycle

- EM Financials’ earnings have been stagnant for the past decade, as higher profit margin is offset by lower efficiency. US banks have been massively outperforming DM and EM due to the negative yield in Europe that depress banks’ profit in DM benchmark and the deeper financial market that allows bank to profit from securitizing loans instead of holding it in the book for EM banks. Moreover, EM banks have been more conservatively run, as highlighted by the relatively higher Capital Ratio. Story: pick-up in global growth and commodity prices should allow faster credit intermediation in EM countries, which will a boon for EM banks. EM banks should also benefit from the deeper penetration of financial literacy in EM countries. We will follow up with EM financials by country going forward, as different financial depth and regulation between countries justify a stand-alone analysis of EM financials.

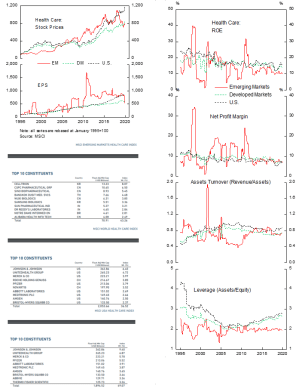
- EM Health Care performance have been stellar until last year when EPS took a hit and valuation moderates. The sector’s lower leverage compared to DM/US counterparts has contributed to the lower ROE. Story: Although the weights of health care sector are still very low in EM benchmark, the favorable demographic and increasing purchasing power bode well for the sector in the long term.
- Industrials is the money-losing sector in EM for the past two decades. Margin and asset turnover have been declining and leverage increasing. Perhaps this is due to the more tech-advanced countries having higher competitive advantage relative to EM in the sector. Story: We think EM industrials will underperform DM/U.S. in the long term and investors would be better off avoiding this sector of EM equity.

- Information Technology in EM has higher turnover and lower leverage than DM/US, but profit margin has been declining of late. This is mainly driven by the drastic decline in semiconductor sector and Samsung earnings last year. Story: EM tech stocks are likely to outperform the benchmark due to the rebound in semi sector.
- EM Materials is interesting to OW or buy outright, as profit margin and asset turnover is on par with DM/U.S., but leverage is lower. EM Materials EPS has been volatile, but the prospect of improving global growth and depressed valuation should be a tailwind to the sector.

- EM Utilities is also one of the potential outperformers. ROE is on part with DM/US despite lower leverage, boosted by the higher asset turnover.

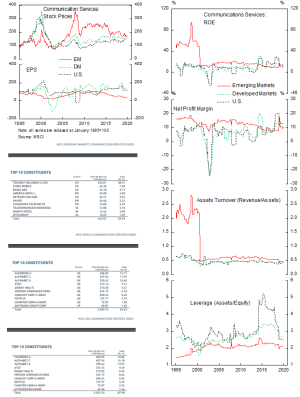
- Communication services in EM is a play on Chinese tech and communication firms. EPS has been trending lower as turnover declined of late, but Tencent promising growth put the sector on our overweight list.
Copyright © 2020, Putamen Capital. All rights reserved.
The information, recommendations, analysis and research materials presented in this document are provided for information purposes only and should not be considered or used as an offer or solicitation to sell or buy financial securities or other financial instruments or products, nor to constitute any advice or recommendation with respect to such securities, financial instruments or products. The text, images and other materials contained or displayed on any Putamen Capital products, services, reports, emails or website are proprietary to Putamen Capital and should not be circulated without the expressed authorization of Putamen Capital. Any use of graphs, text or other material from this report by the recipient must acknowledge Putamen Capital as the source and requires advance authorization. Putamen Capital relies on a variety of data providers for economic and financial market information. The data used in this publication may have been obtained from a variety of sources including Bloomberg, Macrobond, CEIC, Choice, MSCI, BofA Merrill Lynch and JP Morgan. The data used, or referred to, in this report are judged to be reliable, but Putamen Capital cannot be held responsible for the accuracy of data used herein.
