Download PDF: South Africa Research
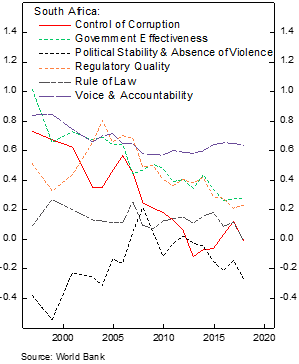
South Africa could easily pass as a country that combine various Emerging Markets sins: rampant corruption, mismanagement of government assets and low productivity. Unless a clear economic and political reform is done, it is likely that the country will slowly drift deeper into the abyss. From a political point of view, the country is now led by a pro-reform president. The ascendancy of Cyril Ramaphosa last year brings hope that he will fix the country problem and rejuvenate his party from corrupt officials. From an economic perspective, however, the country is still in a dire state. Various governance indicators are still pointing downward, savings rate has been low, resulting in low investment of capital and productivity. All these results in higher unit labor cost over time, which discourage firms to hire more employee, pushing unemployment rate upward and depress consumer spending.
South Africa has the lowest savings rate among EM countries

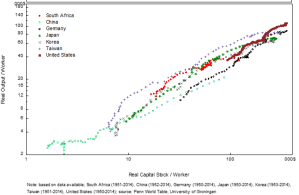
Capital stock has been flat for almost a decade while output has been declining
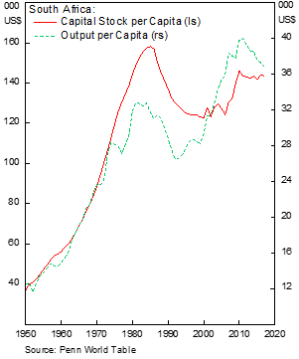
Implying a decline in productivity

For the last decade, savings and investment have been trending lower
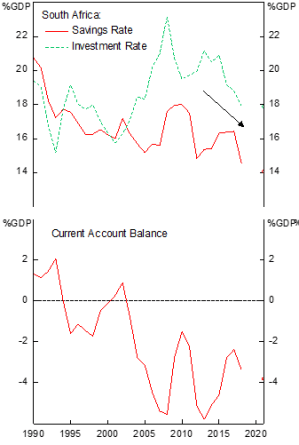
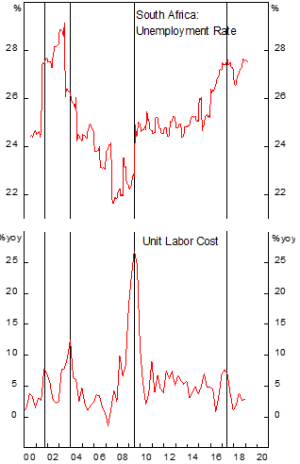
Resulting in low productivity and higher unit labor cost. Combined with rigid labor regulation, it pushes unemployment higher
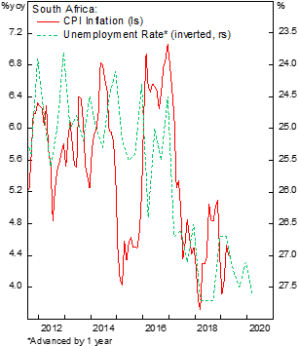
The increase in unemployment depress consumer demand and inflation
Business environment has not been conducive for investment
Savings rate need to be boosted in order to accelerate investment and attain higher growth rate
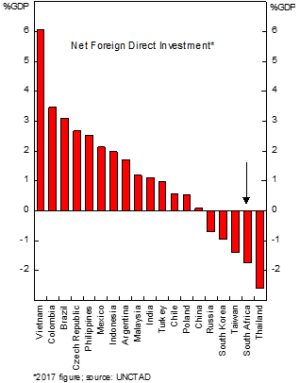
Investors have been fleeing the country in the past few years
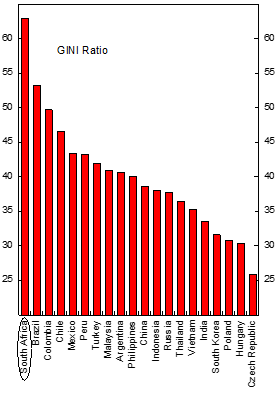
The very high unemployment rate results in South Africa being one of the most unequal countries in the world, exacerbating many social issues such as land reform, uneven education and health service between the “have” and “have not” and high crime rate

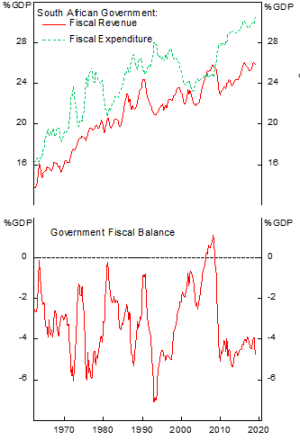
Government Fiscal and Public Debt
Since the financial crisis South African government has always recorded a deficit, driven by the falling SOE revenues and bail out of Eskom, its national electricity company that almost collapse in 2018. The problem lies more on the spending side rather than the revenue side. Quality of expenditure has declined, with public services and transfers taking an increasing chunk of the government coffer. The government plan to reduce spending in medium term amounting to 0.8% GDP, half of which coming from compensation budget.
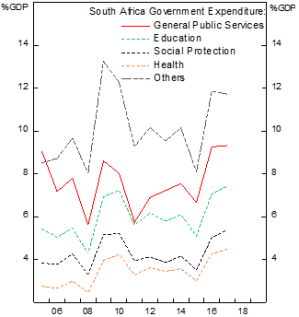
Government expenditure has been rising faster on the back of unproductive spending, such as bailing out Eskom
Expenditure has been focused on less productive spending such as public salary and transfers
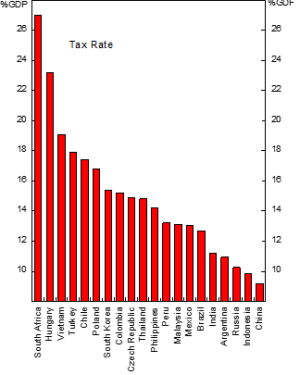
South Africa tax collection is among the highest in Emerging Markets
As debt-financed expenditure rise uncontrollably in the past decade, South African government debt has also been rising from less than 45% GDP in 2015 to over 55% GDP currently, which will limit counter-cyclical policy during a downturn. Most of the government debt issued is denominated in local currency, reducing the risk of balance of payment crisis in the future. Although debt-to-GDP ratio rise in the past decade, nominal yield has been trading at a range-bound as inflation rate declined substantially.
Eskom, its national electricity producer, has been wobbly and requiring government assistance to keep operating. Non-payment of electricity cost and illegal connection have been documented across country and Eskom has declined to fix its infrastructure in region with repeated failures due to illegal connection, tampering and bypassing.
Decline in inflation has kept government yield stable despite rising debt level

Rising borrowing cost and expenditure have been putting Eskom under strain

Relatively high foreign ownership of government bond puts South Africa at a risk of capital flight
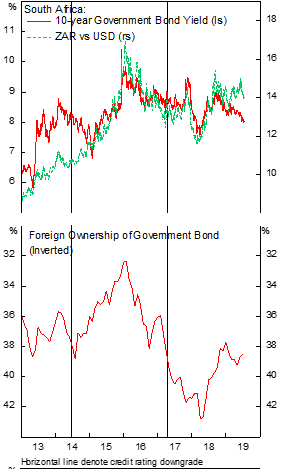
Policy rate has been kept high despite falling inflation. SARB is expected to cut rates should inflation remain benign

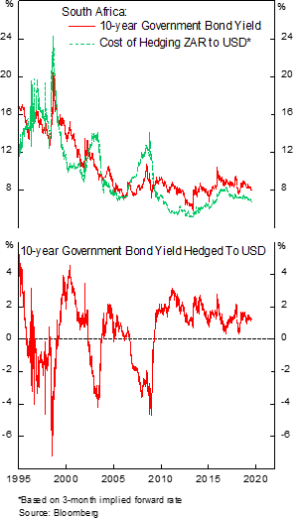
Yield of hedging local currency government bond is still on positive territory, highlighting the expectation of relatively stable currency
Pocket of Vulnerabilities
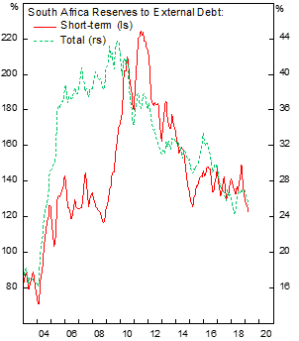
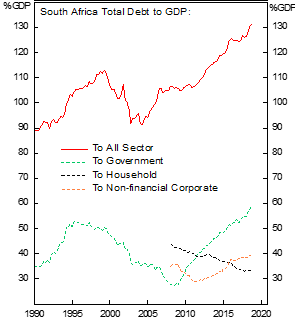
South African reserves is low compared to international level and has been deteriorating since 2012. The level of the reserves itself has been relatively constant at US$ 40-45 billion since 2011 but external debt issuance has risen significantly during the period. On a more positive note, the major increase in external debt issuance has long-term maturity. The increase in issuance of local currency and FX bond have been dominated by the government financing need, contrary to household that has been deleveraging.
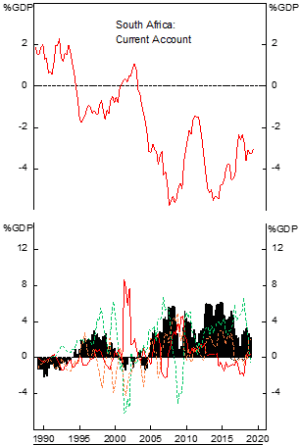
Current account deficit has been financed by portfolio flow that is prone to reversal during period of weak economic growth, as seen in Q1 2019. However, industrial production and LEI have shown an improvement of economic activity in Q2, which should avert South Africa from having technical recession.
Deterioration in South Africa’s external position
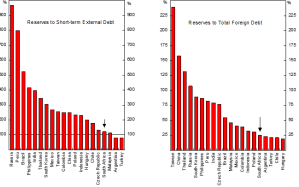
International reserves relative to external debt has been on the low side among EM countries
Current account deficit has been financed mostly by portfolio flow
Increase in debt issuance is dominated by government financing need
External debt issuance is tilted toward long-term maturity

The economy has shown improvement in Q2 2019 (bottom)

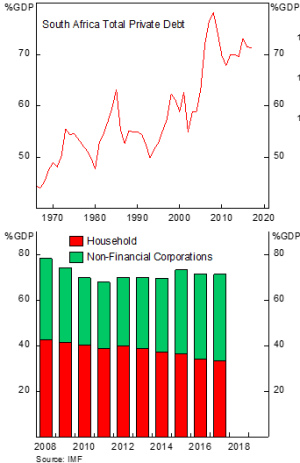
Household deleveraging has been offset by corporates sector
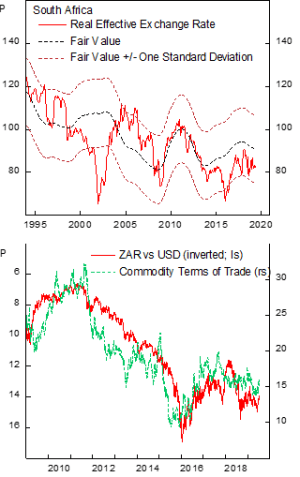
The free-floating currency has been acting as a shock absorber for the economy. Benign inflation and “undervalued” ZAR should limit the extent of ZAR depreciation
Commodities play fewer role in South African export as the country diversify from primary goods export.
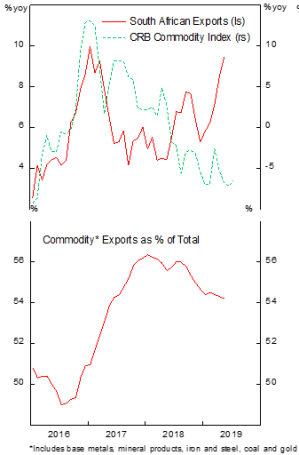
Share of South African exports relative to its GDP and to world exports has became less volatile due to diversification from commodity products and prices to transport equipment

Credit Growth and the Banking Sector
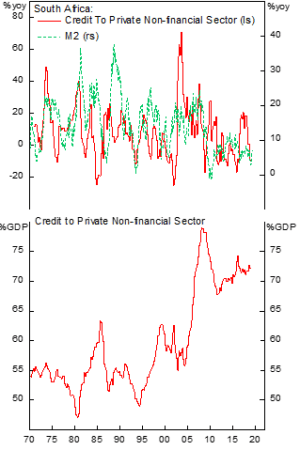
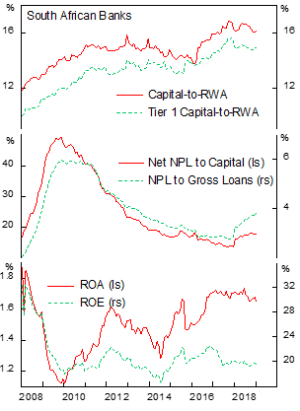
South African credit cycle seems to be bottoming and point to higher growth ahead. M2 grew by 7.1% y-o-y in May compared to 2.85% in its bottom in January. The banking sector has more than adequate capital adequacy despite recent uptick in NPL, all while maintaining high profitability. However, vulnerabilities remain in small and medium sized banks.
Credit cycle in South Africa seems to be bottoming, signaling a better growth ahead
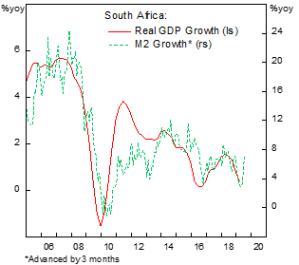
Although credit demand is still weak, recent improvement in M2 growth has been encouraging
South African banking sector is solid: Capital ratio far exceeds minimum requirement, NPL is rising but has been provisioned and banks have maintained high ROE
Equity Markets
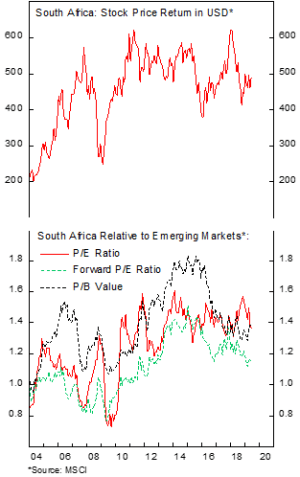
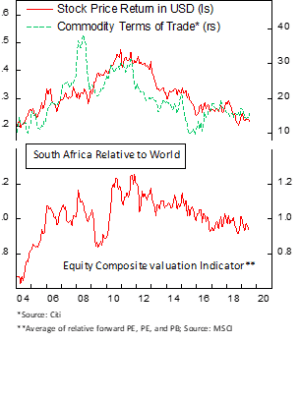
South African equities is still trading at a premium relative to EM but is at the lower band of last five years’ valuation range. Relative to world, however, the country has erased its premium valuation, now trading at a 5% discount due to its constant underperformance since the financial crisis and relatively higher valuation in DM vs EM bourse.
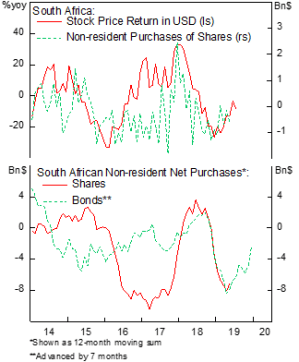
Recently the trend in foreign purchases in South African bonds and stocks have started to reverse. Combined with the expected improvement in macro picture, South African equity is interesting for a cyclical play.
South African equities are trading at the lower band of its 5-year range
The trend in net foreign purchases of bonds and equities have reversed somewhat
Underperformance of ZA equities are massive and has erased most of the valuation premium
Copyright © 2019, Putamen Capital. All rights reserved.
The information, recommendations, analysis and research materials presented in this document are provided for information purposes only and should not be considered or used as an offer or solicitation to sell or buy financial securities or other financial instruments or products, nor to constitute any advice or recommendation with respect to such securities, financial instruments or products. The text, images and other materials contained or displayed on any Putamen Capital products, services, reports, emails or website are proprietary to Putamen Capital and should not be circulated without the expressed authorization of Putamen Capital. Any use of graphs, text or other material from this report by the recipient must acknowledge Putamen Capital as the source and requires advance authorization. Putamen Capital relies on a variety of data providers for economic and financial market information. The data used in this publication may have been obtained from a variety of sources including Bloomberg, Macrobond, CEIC, Choice, MSCI, BofA Merrill Lynch and JP Morgan. The data used, or referred to, in this report are judged to be reliable, but Putamen Capital cannot be held responsible for the accuracy of data used herein.
