Download PDF: monthly_201912
Risk aversion has come down of late, as highlighted by the rebound in real yield from a deep negative level in G7 economies ex-Italy. The improving global outlook despite apparent weakness in credit Chinese data, however, is concerning. The less forceful and diminishing stimulus administered by the Chinese government in the last two months means that majority of the planned stimulus is done and the impact to Chinese economy has peaked. Hence, global growth will likely remain sluggish, albeit better, in 2020. Asian countries are likely to lead the mini upturn, followed by European and Latin American countries. High frequency data is also pointing to a bottoming U.S. cycle and recent PMI figure continued to show a rebound in manufacturing activities.
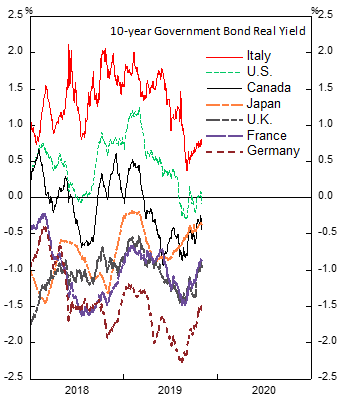
On the other side, US High Yield bond spread has remained elevated despite the compression in EM sovereign dollar bond, which is partly reflective of the high corporate leverage of U.S. companies and improving external profile of many EM countries. On this basis, we believe that the market response to recent decline in risk aversion is justified.

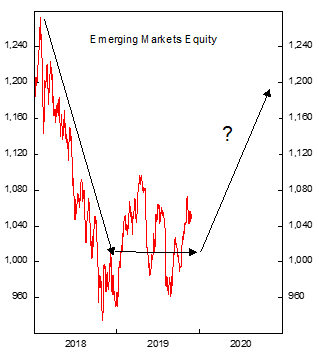
We have been rather negative on U.S. equities relative to the world for the past year, a stance that has not served us well on the broader EM/DM view. However, our country selection has resulted in significant alpha that outperform the rather flat S&P500. With the growth condition In U.S. start to improve in recent months, we believe 2020 will be a year of synchronized global rebound, albeit being a weaker one than those in 2017.

More Thoughts on Copper
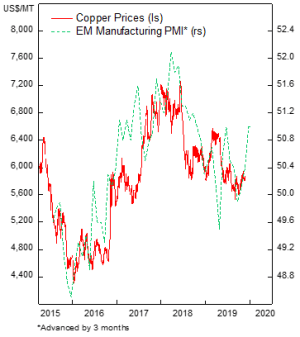
In the previous report, we argue that commodity is underpriced relative to global equity and being undervalued. We make the case especially on copper, where the stronger global growth and demand from infrastructure building, electric batteries and other electronic goods manufacturing will likely push prices higher than current level. Moreover, the supply-demand mix has been tilting toward undersupply since 2018.
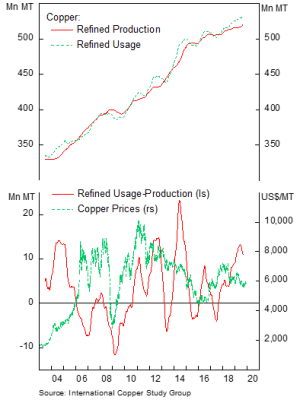
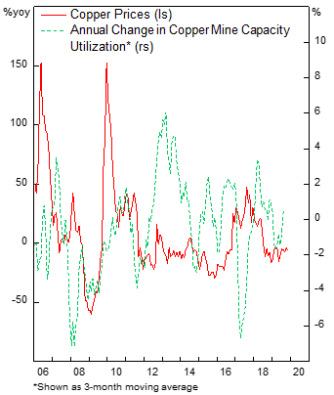
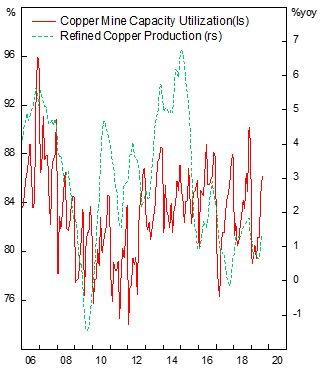
Periods of oversupply in copper and drastic decline in prices have usually coincided with global downturn, as seen in 2008, 2013, 2015 and 2017. Since consumption plays a greater role in determining copper prices, we are confident that the rebound in global growth next year will boost price further. Meanwhile, on the supply side we note a lack of capacity to ramp up production significantly to meet positive shock in demand. This is highlighted by the recent slight increase in production that already brought the capacity utilization to the higher side of last decade’s range, caused mostly by the lack of investment resulting from declining copper prices.
Bottom line, we are expecting 2020 to be a better year than 2019 for risk assets, with assets that have historically benefit from the rebound in growth to benefit the most, i.e. commodity, EM equities. But at the same time, we are only expecting a convergence toward trend growth for Latin American countries (2%), EM Asia (4-5%) and Europe (1.5-2%). This is mainly due to the weaker reflation effort from Chinese government and its shift in priority toward a less credit-driven growth (contraction in shadow banking activities, less forceful infrastructure spending, crackdown on bad banks).
Investment Thesis
In line with our view on the improving global growth, we prefer the higher beta of EM equities relative to DM equities. The dollar is likely at the end of its bull cycle as Fed has reduced rates three times at the second half of 2019, and the bottoming of growth in many countries, driven by trade war rhetoric, manufacturing recession, dollar strength and significantly slower Chinese growth, is likely to put a floor on local currencies relative to the USD. In hindsight, the 2018 was a bad year for risk assets, especially EM, as the Fed tighten. Meanwhile, 2019 is a less-worse year than 2018, driven by the mix of trade war escalation, slowing Chinese growth and turnaround of U.S. monetary policy. And if we are right, in 2020 we will see a rally in risk assets.
Bonds
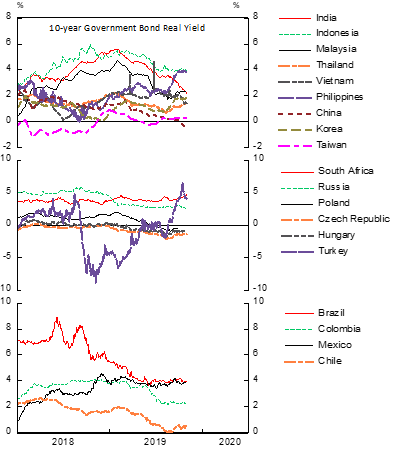
On the bonds side, we maintain a positive stance on Turkish, Indonesian and Mexican bonds, all of which has high real yields and improving outlook compared to peers. Inflation has stayed low in many EM countries, as domestic demand continues to be weak and currency has not been falling as drastic as in 2018, limiting the spike in CPI. However, we think the risk-reward is more attractive on the equity side, as the compression in yield translates to lower cost of capital for equities, leading to higher multiples, and earnings outlook on select EM countries are improving.
Equities
Although we acknowledge our bias toward EM equity, this is for few reasons. First, from historical standpoint EM equities have always outperformed U.S. and DM after a slump in growth. 2018 and 2019 were two years of deceleration in growth, and now that we are seeing signs of growth rebound in many countries, we are expecting a rebound in 2020. Partly this is due to the greater cyclical sector weighting of EM countries, amplified by the small cap and value factor of EM equities. Second, as capital inflow into DM equities have made it relatively more expensive than the EM counterparts, money will flow into the relative cheaper alternatives, such as European and EM equities, in search of value. We maintain our bullish stance on Turkey, Chile and Mexico due to both valuation and improving outlook.
Turkey
Our thesis on Turkish inflation and assets have played out nicely, with inflation tumbling into single digit and nominal bond yield dropped 800 bps from its peak this year. The Lira has also stabilized, which should limit inflation from spiking up again. However, risks are still lurking, mainly from the low reserve adequacy ratio.
Long Turkish bond and equities will continue to benefit from the economic recovery and stabilizing inflation. The decline in interest rates, combined with reduction in risk premium from improving outlook, should drive equity multiples higher. Earnings outlook is improving as well from a more competitive exports and rebound in domestic demand.

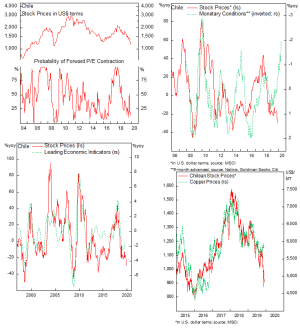
Chile
Chilean monetary conditions have eased further as a result from collapsing Peso. The equity market is also likely to benefit from copper price increase, should our thesis prove to be correct. The equity has historically correlated very tightly to movement in copper prices, which are currently diverging due to the political situation in Chile. Moreover, the cycle is bottoming and signs of de-escalation of the social unrest have emerged of late.
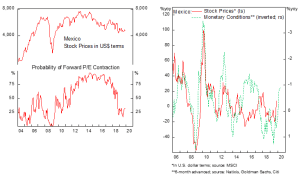
Mexico
Our thesis on Mexican equity remains intact, despite the recent pullback in stock prices and the Peso. The country is at the bottoming stage currently and a period of stabilization may ensue in the next 3-6 months before gaining momentum. Mexican equity valuation is very attractive at current level and earnings improvement as the cycle rebound should add a boost to the multiple expansion. Moreover, the Central Bank is still at the early phase of its easing policy and inflation has remained low, giving ample room for loosening in the monetary side. However, the combination of tight fiscal policy and easy monetary policy may translate to a further weakness in the Peso, but at the same time increase the competitiveness of Mexican exports, which should boost stock prices in local currency terms.
In the next 12-18 months, we expect that global recovery in manufacturing sector should translate to the outperformance of manufacturing and export heavy countries such as Mexico, Czech Republic, Hungary, Poland, Turkey, South Korea, Taiwan and Malaysia.
Copyright © 2019, Putamen Capital. All rights reserved.
The information, recommendations, analysis and research materials presented in this document are provided for information purposes only and should not be considered or used as an offer or solicitation to sell or buy financial securities or other financial instruments or products, nor to constitute any advice or recommendation with respect to such securities, financial instruments or products. The text, images and other materials contained or displayed on any Putamen Capital products, services, reports, emails or website are proprietary to Putamen Capital and should not be circulated without the expressed authorization of Putamen Capital. Any use of graphs, text or other material from this report by the recipient must acknowledge Putamen Capital as the source and requires advance authorization. Putamen Capital relies on a variety of data providers for economic and financial market information. The data used in this publication may have been obtained from a variety of sources including Bloomberg, Macrobond, CEIC, Choice, MSCI, BofA Merrill Lynch and JP Morgan. The data used, or referred to, in this report are judged to be reliable, but Putamen Capital cannot be held responsible for the accuracy of data used herein.
