The week between Christmas and New Year last year was exceptionally cold, with snowstorms in both the Eastern and Western Coast of Canada and the U.S. Many flights were cancelled and those that managed to land at their destination, including the one that I was in, experienced heavy turbulence. The exceptionally cold winter this year is perhaps a sign of things to come next year for the global economy. As equity and bond prices fell for the most part of 2022, economists and strategists are raising the probability of recession in the U.S. this year even as the labor market remains tight and inflation is finally starting to fall faster than consensus expectation. If recession indeed happen in this year, it is probably among the most anticipated one in recent history amid policymakers’ explicit intention to slow economic growth to better match supply capacity with demand.
Comparing the economic and macro backdrop to a year ago, currently we are facing a tougher condition resulting from the downturn in the business cycle and lagged impact of last year’s monetary policy tightening. Whereas in the beginning of last year consumers were bullish and flushed by savings accumulated during the pandemic and companies had little difficulty in passing through the higher cost from supply-chain disruption, today the tone among households and managers have turned decisively bearish. For one, households in the bottom income quintile have run down their excess savings and continue to suffer the most from the still elevated inflationary pressure, and there are reasons that consumer spending will be challenged in 2023.
- First, the still firm headline retail sales figure masks the strength of consumer demand. Chart 1 shows that after adjusting for inflation, consumers have been spending less than in the previous year. This is not surprising given that real income growth for the average worker has been negative even though nominal wage growth is at a level not seen in previous two decades. Little wonder that most consumers think it is not a good time to buy durable goods, with the sentiment index at a worse level compared to during the global financial crisis.

- In 2022, consumers could be thankful for the fact that despite inflation eating into their purchasing power, finding work was easy and tight labor market allows workers to gain the upper hand when negotiating salary with their employer. As growth slows and consumer demand is slowing, however, this year companies will likely reduce their hiring to protect margin. NFIB surveys show that small businesses have been scaling down their hiring plans, and this historically led to a higher unemployment rate in the subsequent 6 months (Chart 2). Slowing consumer demand should limit pricing power and top-line growth, which combined with rising labor, material, and interest cost could force managers to shrink their workforce. If not managed carefully, a negative loop of lower demand and higher unemployment could become a self-fulfilling prophecy (Chart 3).
- The good news is that lower consumer demand and looser labor market condition would help the Fed to tame inflation back to its 2% target. With demand for workers cooling down, job vacancy to unemployment ratio should continue to fall and push wage growth lower (Chart 4).

It is also difficult to make the case for stronger business investment this year. Our growth tax indicator – an average of oil price, the dollar, and 10-year yield, all standardized – continue to point to lower manufacturing PMI surveys until mid-2023 (Chart 5). New orders and new export orders for goods are falling to levels last seen during the global financial crisis, which reduce the need to expand capacity this year. Moreover, many companies have made the bulk of their capex in 2021/22 following the supply-chain disruption and are now having excess capacity, i.e., Amazon subleasing its warehouse space. The deterioration in macro-outlook this year has weighed down CEO confidence and should keep business investment muted (Chart 6).

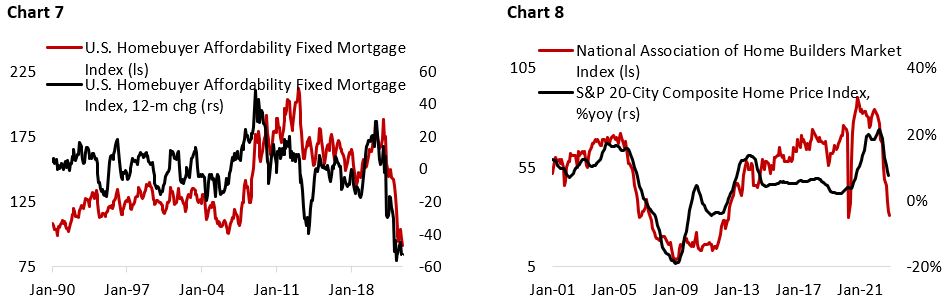
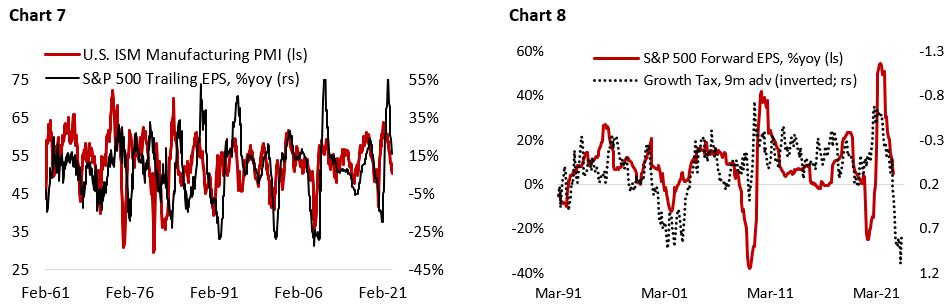
Meanwhile, residential investments is not expected to rebound anytime soon amid the slump in housing market activity and prices. Although long-term yields and mortgage cost have started to come down as the bond market is pricing in a growth slowdown, housing affordability continues to worsen to 30-year low. In fact, the deterioration in housing affordability in the U.S. is the sharpest over the past three decades and is unlikely to improve much this year, especially if the labor market starts to weaken (Chart 7). With fewer buyers in the market, the deterioration in home builders’ sentiment could reach GFC’s low and translate to a much lower housing starts (Chart 8). Residential property prices will likely have to correct further and/or mortgage cost falling before property market activity could provide a boost to economic growth.
Signs of deteriorating consumption and investment demand, however, has not deter the Fed from continuing with its rate hike amid the falling but still above-target inflation. This raises the risk of policy mistake as the U.S. and global economy has yet to see the full impact of last year’s interest rate hike and quantitative tightening. Whereas the Fed was too late to tighten monetary policy in 2021, it could be too late to ease policy in 2023. As growth continue to slow in the months ahead, inflation should also fall at a faster pace especially if recession hit. Chart 9 shows that the gap between retail sales growth, a proxy for demand, and industrial production growth, a proxy for supply, is now back to historical average level after spiking during the pandemic, which should help bring inflation lower in the coming quarters.
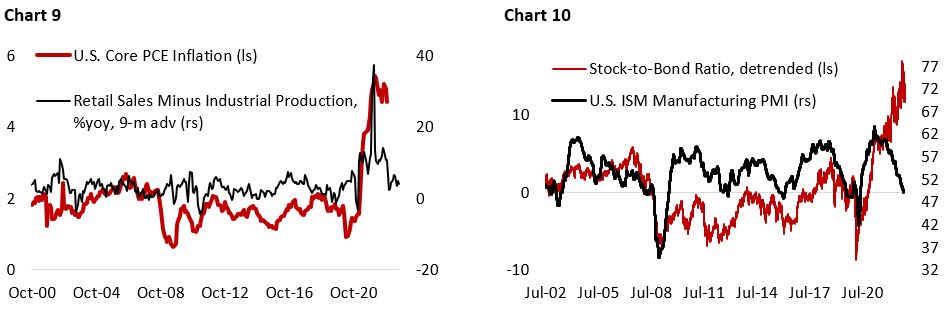
The outlook of a weaker consumer spending and business investment, softer real estate activity, and potential for policy mistake means the risk to growth and risk assets is tilted to the downside in the first half of the year. Historically, this bodes well for bonds, especially Treasuries, relative to equities (Chart 10).
Outlook on Equities: Difficult First Half, Better Second Half
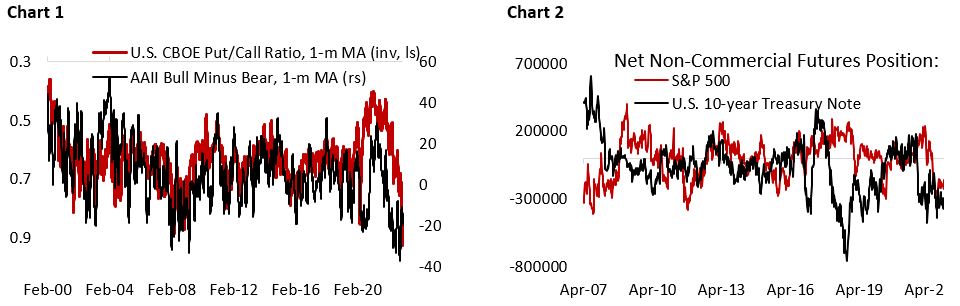
Following a difficult year for both equity and bond investors are now bearish and have bought protection in droves, expecting elevated equity volatility ahead. For instance, investors are buying put options at a record amount to protect their portfolio from falling equity prices, with the CBOE put/call ratio now at a two decades’ high (Chart 1). Meanwhile, the bull/bear sentiment is still at a level consistent with previous bear market, despite rebounding somewhat from its recent low. Among more sophisticated investors, the tone is also similar, with futures position revealing a net short position in both U.S. equities and Treasury bonds (Chart 2).
As outlined in our macro section, the bearish case for U.S. economy and risk assets is straightforward. First, consumer demand and business investment will continue to soften in the first half of 2023, which should weigh growth and corporate earnings lower. Second, the Fed is not yet over with its monetary policy tightening, despite growth starting to look wobbly and inflation finally coming down faster than expected. Lastly, various leading indicators are flashing red and indicate high probability of recession. On the latter:
- The yield curve, a decent predictor of recession, has inverted to levels not seen in the past two decades (Chart 3). With the Fed still expected to deliver 50 bps even as growth is faltering, the risk of a deeper downturn is rising.
- The gap between expectations and present situations component of the consumer confidence survey has started to rise, which historically marked the beginning of a recession, together with steepening of the yield curve.
- New York Fed Weekly Economic Index, a coincident indicator of U.S. economic growth has been falling quickly and is now below “trend growth” level (Chart 4). We expect the greatest impact of tighter monetary policy to fall between Q1 and Q2 this year, which should push growth even lower in the coming quarter.

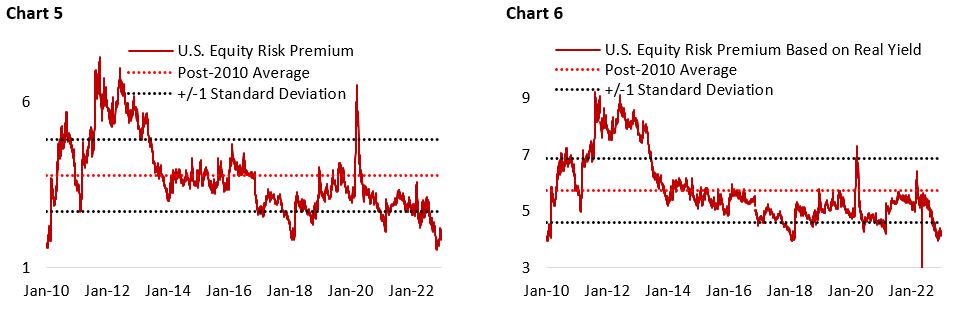
Despite investors’ downbeat assessment of the U.S. economic outlook and equity market, however, fundamentals have yet to fully reflect the growing risk and valuation and earnings estimate have further to go before equity becomes a “screaming buy”. The S&P 500 is currently trading at 18x forward P/E, above its 16x historical average and based on an elevated forward earnings estimate. Relative to where 10-year Treasury yield is trading today, the equity risk premium (ERP) for U.S. stocks is below one standard deviation from the post-2010 average, whether measured by nominal or real 10-year yield (Chart 5 and 6). Elevated multiples for U.S. stocks provide less buffer for investors, especially as earnings estimate continue to be revised lower and tightening liquidity makes it difficult for equity multiple to expand from current level. Although correction in stock prices may be painful in the short term, long-term investors should cheer the opportunity for buying quality companies at a cheaper valuation compared to in the past two years.
In the short term, the fluctuation in stock prices could be explained mainly by the changes in its multiples. But in the long run, equity price reflects its earnings potential, and the change in earnings tend to coincide with the ebb-and-flow of the business cycle. With ISM manufacturing PMI falling into contractionary level in November, S&P 500 trailing earnings growth should turn negative in the coming months, which currently is not priced in the market (Chart 7). Furthermore, our growth tax indicator – an average of oil price, the dollar, and 10-year yield, all standardized – continue to point lower economic and earnings growth until around mid-2023 (Chart 8).
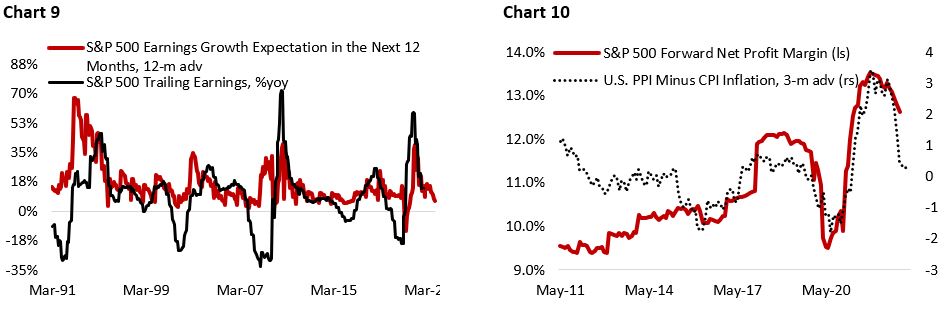
Despite all the headwinds for equity earnings, the market expects S&P 500 earnings to grow by 6% in the next 12 months, which stand in stark contrast to the fact that earnings historically contract during recession – which is increasingly becoming a consensus call among portfolio managers. It is important to note, however, that the historical record for the consensus on earnings is rather poor. Forward earnings growth expectation remained in positive territory in three out of four of the most recent recessions, where in all of the case earnings growth fell by double-digit (Chart 9). Apart from slowing consumer demand and falling inflation tempering companies’ revenue growth, we think margin has further to contract amid shrinking gap between what the company could charge to customers and its input cost (Chart 10).
The bottom line is that the outlook for U.S. stocks remain cloudy for the first quarter of 2023 amid downside earnings risk and lack of valuation support. This may present wonderful opportunities for long-term investors to accumulate quality stocks at a bargain price. Looking further to the second half of the year, there are signs that the headwinds for equity should start to abate as the business cycle resumes its upward trend and monetary policy potentially starting to become supportive for risk assets.
International and EM Equities: Improving Outlook vis-à-vis U.S. Stocks
For majority of the time in the past decade investors would have done well by paying more for U.S. stocks where earnings growth and return-on-equity are much higher than the rest of the world. In fact, investors would have more than doubled their equity return by holding U.S. stocks compared to its international and emerging market counterpart (Chart 11). It is not surprising to find out that very few investors are currently excited about the prospect of investing in European, Japanese, and Emerging Market stocks, a trend that has only accelerated following Russian invasion of Ukraine and the associated spike in energy prices. Not only higher energy prices hurt these energy-importer countries the most, but the much smaller share of technology sector weigh in their benchmark also means they had not benefitted from the rising tech stocks valuation during the pandemic.
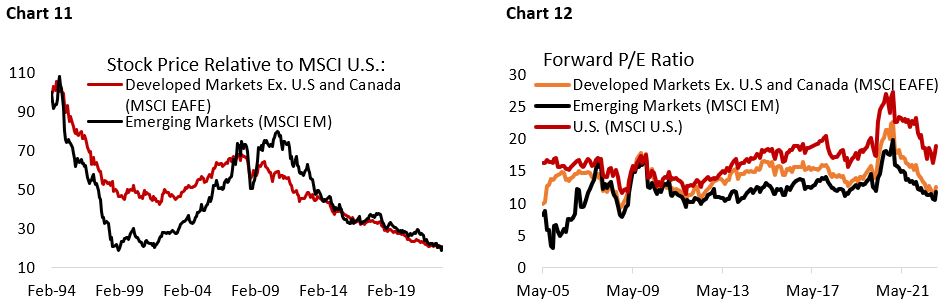
From a structural perspective, it is no secret that Japan and European countries are facing a structural decline in their domestic growth due to falling working-age population and poor productivity growth, which should limit their earnings growth potential from domestic demand. But arguably, large share of Japanese and European equity benchmark is now dominated by companies that cater to the global market (Toyota, Mitsubishi, Nestle, ASML, and LVMH). In the case of EM countries, higher inflation vis-à-vis the U.S. means their currencies tend to depreciate against the dollar and offset part, if not all, of the local-currency price gains. But valuation differential between these countries’ stocks and their U.S. counterpart has already reflected much of this risk (Chart 12), and there are other reasons why international and EM equities could outperform the U.S. benchmark this year:
- Chart 13 shows that the relative performance of international to U.S stocks is driven by the dollar cycle, which is entering its bearish trend as the market expects the Fed to cut interest rate by the end of the year while ECB is expected to continue with its rate hike. The impact of a weaker dollar is two-folds. First, a weaker dollar would make it easier for companies outside the U.S. to service their dollar-denominated debt. Second, a bear market in the dollar would inflate the value of overseas investments when translated back into the common currency. But more importantly, weaker dollar is a tailwind for global growth, which benefit international and EM stocks more than its U.S. counterpart and could happen as soon as the second half of the year.

- Tightening global liquidity is another reason investors should consider diversifying into international and EM equities. As we have seen for much of 2022, higher real yields in the U.S. have pushed down equity multiples for U.S. indices, with high-multiple stocks suffering the most. Greater equity valuation buffer in international and EM stocks should limit the downside risk of investment in both region, which have lower weights of technology sector in their respective benchmark. From this perspective, the case of investing in EM stocks is even stronger as many countries’ central bank have raised policy rate in advance of their developed countries counterpart and will likely ease monetary conditions earlier – a boon for their bonds and equities (Chart 14).
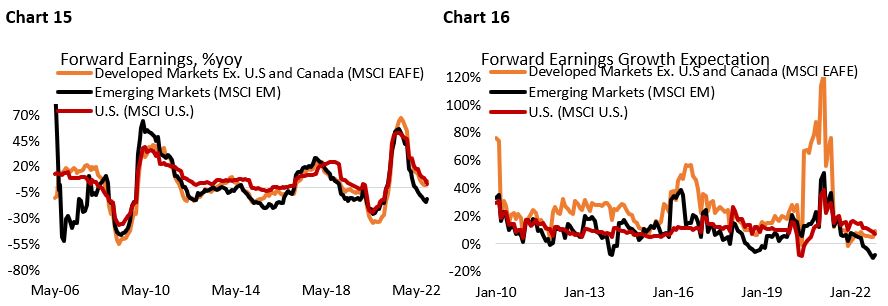
- From earnings perspective, EM stocks is looking particularly attractive as earnings growth is probably past its trough and forward earnings expectations remain very depressed, making it easier for actual earnings to surprise to the upside (Chart 15 and 16). Chinese economic reopening and the potential for acceleration in global growth in the second half of the year could translate to a double-digit EPS growth ahead, at a time when EM stocks is currently trading at only 11.7x forward earnings.
Taken together, the potential for a softer dollar cycle, thick valuation buffer, and depressed earnings expectations point to a stronger case for investing in EM and international stocks vis-à-vis U.S. stocks this year. Within EM universe, the relative outperformance of Indian stocks should reverse as its equity index is trading at an elevated level, while commodity heavy Latam countries and Chinese stocks are currently offering more compelling value (Table 1).
Table 1

Copyright © 2023, Putamen Capital. All rights reserved.
The information, recommendations, analysis and research materials presented in this document are provided for information purposes only and should not be considered or used as an offer or solicitation to sell or buy financial securities or other financial instruments or products, nor to constitute any advice or recommendation with respect to such securities, financial instruments or products. The text, images and other materials contained or displayed on any Putamen Capital products, services, reports, emails or website are proprietary to Putamen Capital and should not be circulated without the expressed authorization of Putamen Capital. Any use of graphs, text or other material from this report by the recipient must acknowledge Putamen Capital as the source and requires advance authorization. Putamen Capital relies on a variety of data providers for economic and financial market information. The data used in this publication may have been obtained from a variety of sources including Bloomberg, Macrobond, CEIC, Choice, MSCI, BofA Merrill Lynch and JP Morgan. The data used, or referred to, in this report are judged to be reliable, but Putamen Capital cannot be held responsible for the accuracy of data used herein.
