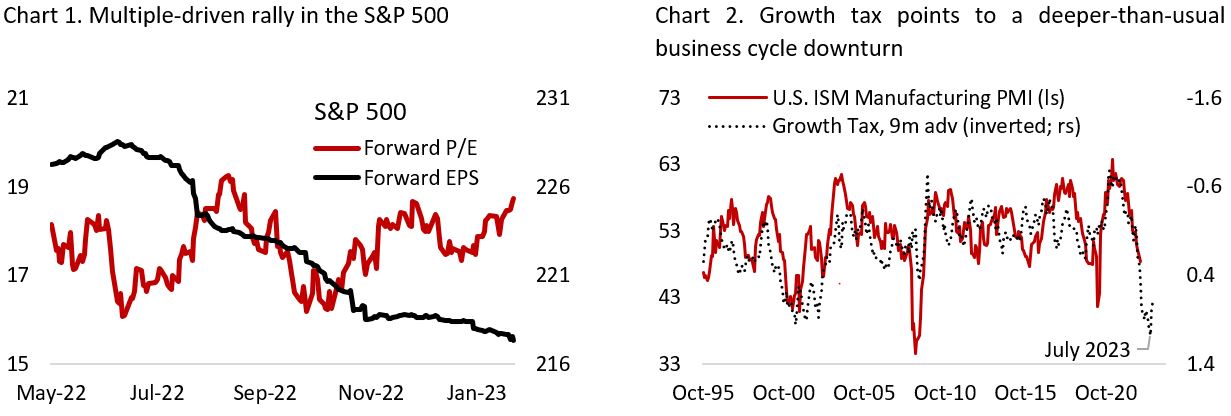
The resilience of the U.S. equity market despite falling fundamentals have continued to puzzle investors expecting lower stock prices. The S&P 500 has rallied 14% from its recent bottom in October, consumer discretionary has been outperforming staples for the past two months and sell-side analysts are sounding more bullish – with some pointing to the still-strong labor market and relatively low household debt as a prove that this year’s recession will be mild. But the indicators that we monitor have only strengthened our bearish thesis for the U.S. stock market. Chart 1 shows that the recent equity rally has been fueled solely by multiple expansion, and earnings estimates have yet to bottom. With forward earnings multiple now close to 19x, we are likely nearing the end of the bear market rally unless earnings start to rise, which we think is very unlikely for reasons discussed below.
This month’s piece summarizes all the leading indicators we monitor that have been proven to be reliable in the past and form the basis of our equity strategy. Rather than going into an elaborate explanation of what we think, we opt instead to lay the facts and let readers to make their own conclusion. Of course, one can’t be too sure of his/her view as uncertainty is the only certainty in the investment world, hence we are carefully monitoring the incoming data that may invalidate our investment thesis. But so far, the evidence is pointing to a deeper-than-average business cycle downturn in the U.S. this year and further earnings cut for the U.S. stock market. Below are few notable leading and coincident indicators that track where we are today cyclically:
- Our growth tax indicator – an average of oil price, the dollar, and 10-year yield, all standardized – points to significant headwinds for growth in the U.S. until around mid-2023 (Chart 2). Note that the size of the headwinds this year is expected to be among the strongest over the past two decades and the U.S. ISM manufacturing PMI survey could fall below 40 in the coming months if historical correlation holds.
- January’s regional Fed manufacturing surveys highlight the potential for national-level ISM manufacturing PMI to fall deeper into contractionary territory (Chart 3). The quickly deteriorating new orders subcomponent is particularly worrisome as the deteriorating outlook could prompt managers to start cutting its workforce, further worsening business sentiment. Currently, the employment subcomponent is still hovering around 50, the expansion/contraction threshold.
- The New York Federal Reserve’s weekly economic index (WEI) has continued to move lower and is now firmly below historical trend growth of 1.5-2% (Chart 4). Based on the growth tax indicator and regional Fed manufacturing surveys, the WEI will likely fall below zero in the next 3-6 months.

The Anatomy of a Recession
In our mind, recession in the U.S. is a matter of “when”, not “if”. In a classic version of a recession, usually three things are present: i) weak consumer spending ii) higher unemployment rate iii) rise in non-performing credit. These three indicators tend to worsen in the same order. Although all three are still at a relatively healthy levels today, consumer spending (Chart 5) and the labor market (Chart 6, 7, 8, and 9) have shown early signs of deterioration, and according to data from Fitch Ratings, the percentage of subprime auto borrowers who were at least 60 days late on their payment rose to 5.67% in Q4 2022 from 2.58% low in April 2022, compared to 6% just before the pandemic hit.

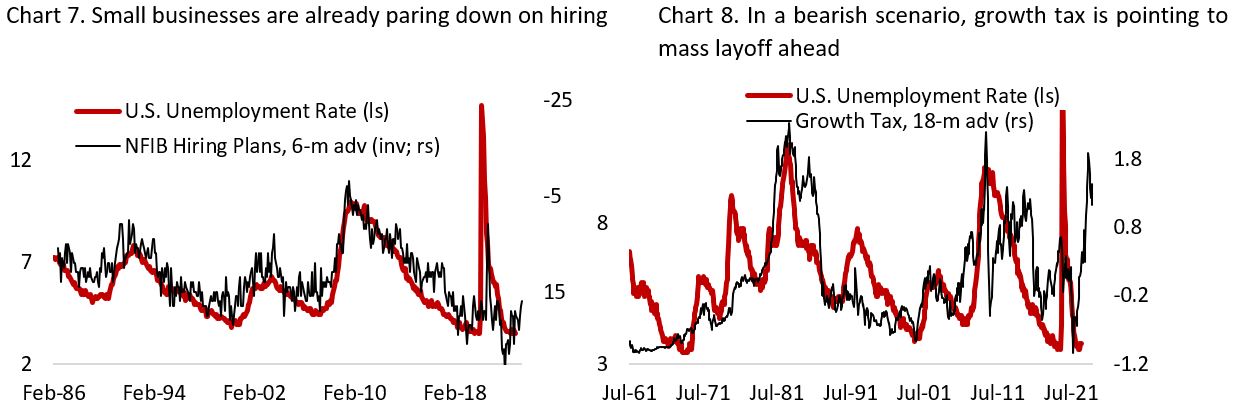
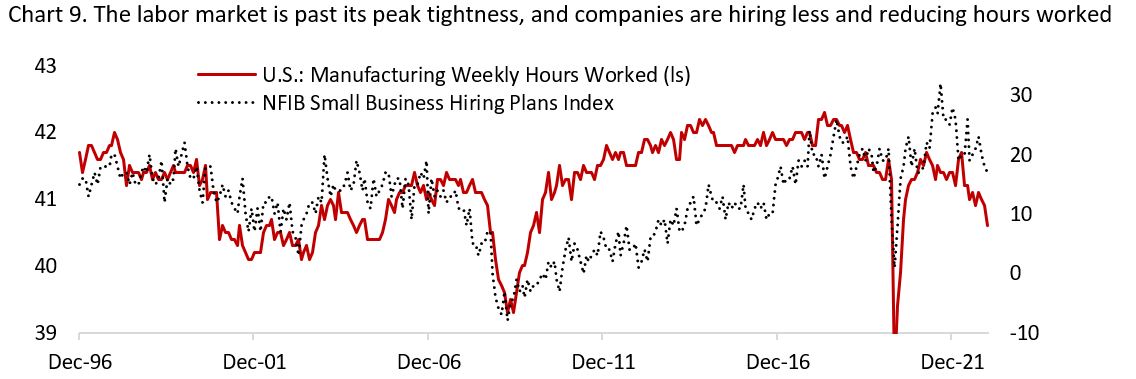
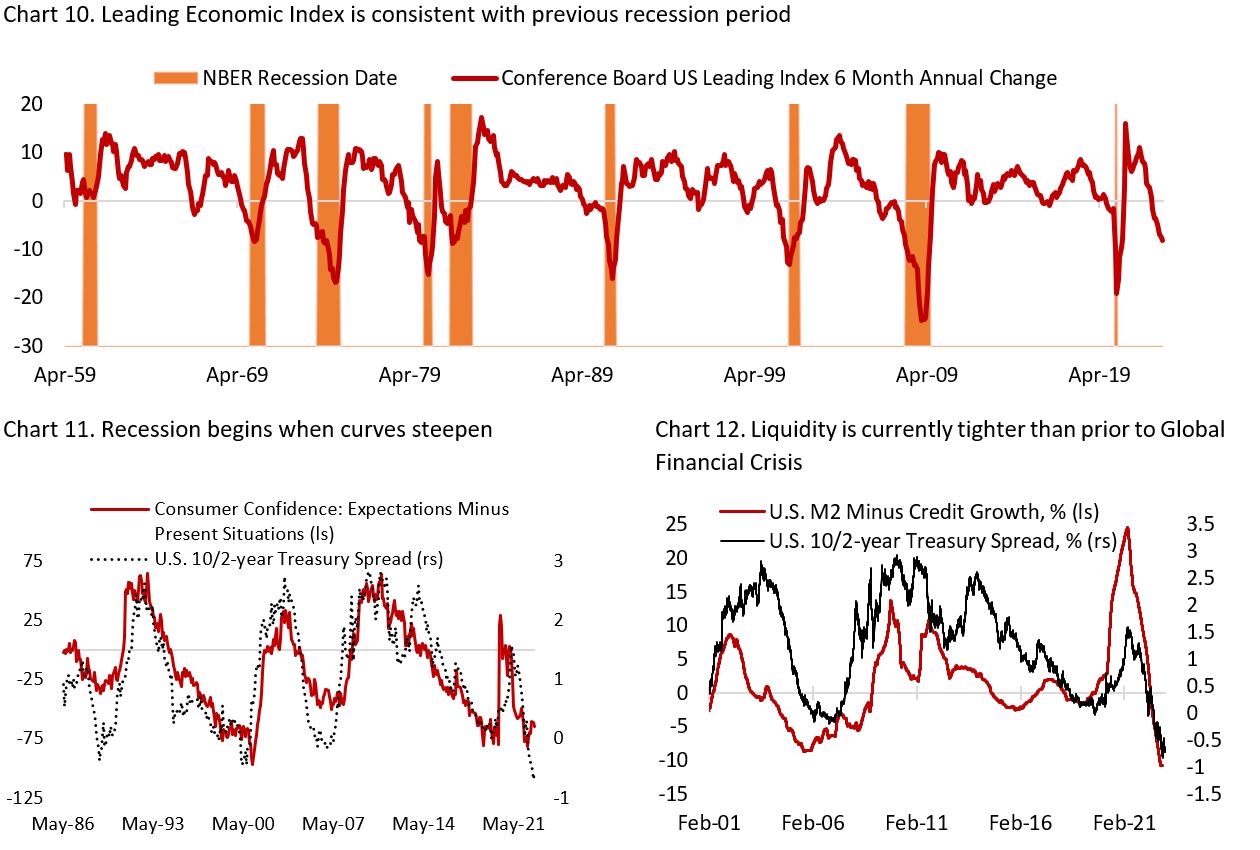
The evidence above led us to the suspicion that similar to the downward inflation surprise since last October, we could see an upward surprise in unemployment rate starting sometimes in H1/23. Since Q4/22, we have seen more and more businesses announcing layoff, although so far it is mainly concentrated in the tech and financial sector. This phenomenon will likely broaden into other sectors in a recession, starting with the manufacturing, then service sector. Chart 10, 11, and 12 highlight that recession will most likely happen this year, with the end of Q2/23 potentially being the trough.
What Will Earnings Do in a Recession?
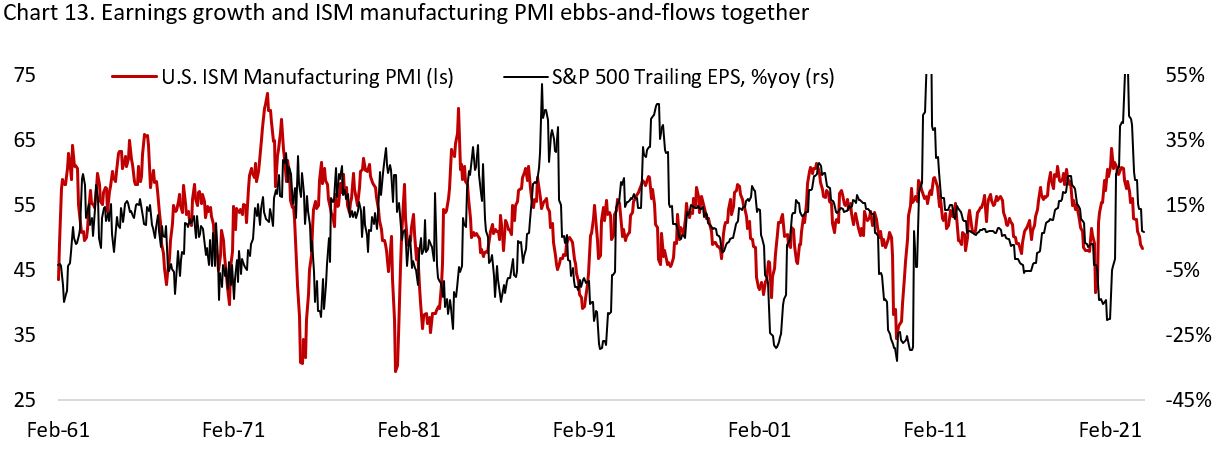
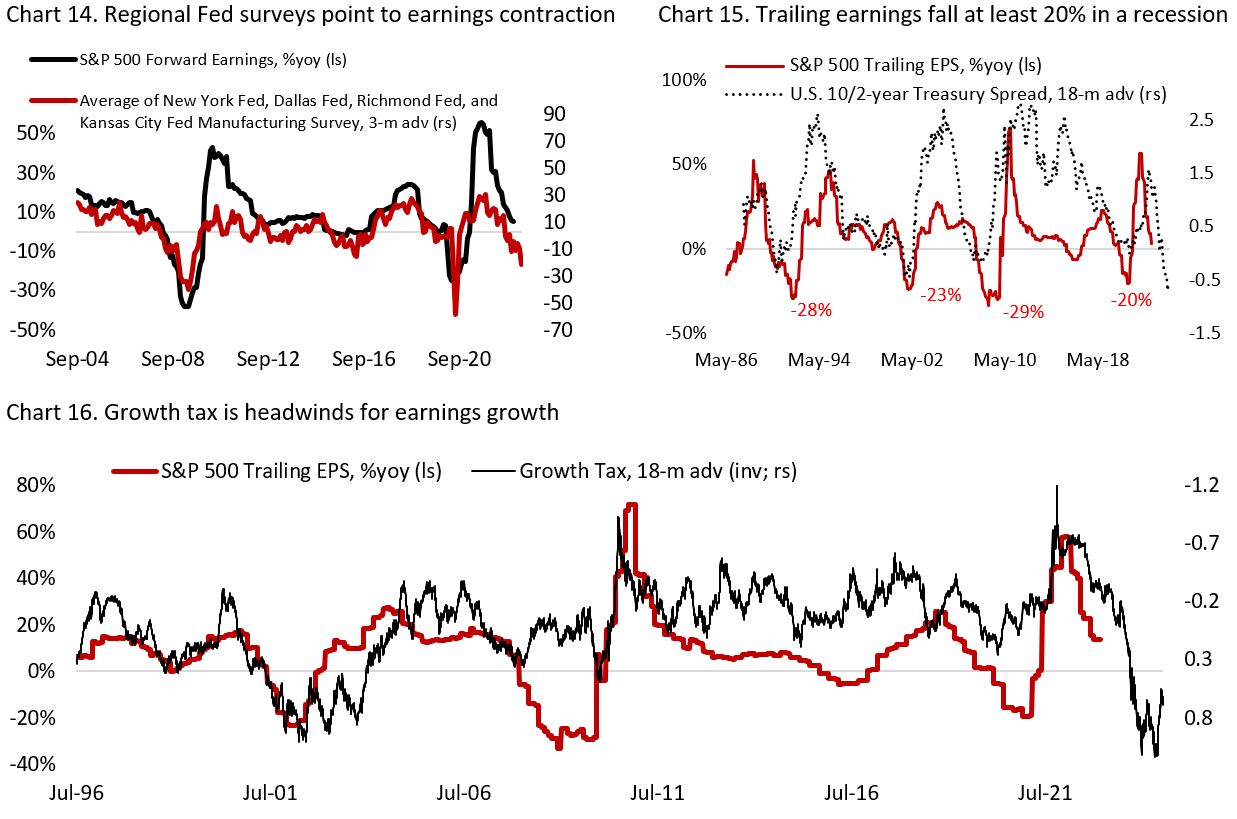
Earnings growth have always slowed during business cycle downturn (Chart 13), and it has been the case today. As we highlighted in the beginning of this piece, forward earnings estimate for the S&P 500 has fallen by 5% over the past nine months and likely has further to go (Chart 1). Investors should stay patient and not chase the current rally in equity amid poor outlook for earnings and elevated valuation multiples (Chart 14-16).
Investment Implication and Asset Allocation
Our expectation for a recession and higher unemployment rate ahead means the outlook for bonds is more attractive than for equities. We expect stock-to-bond ratio to continue its decline as ISM manufacturing print falls deeper below 50 (Chart 17).
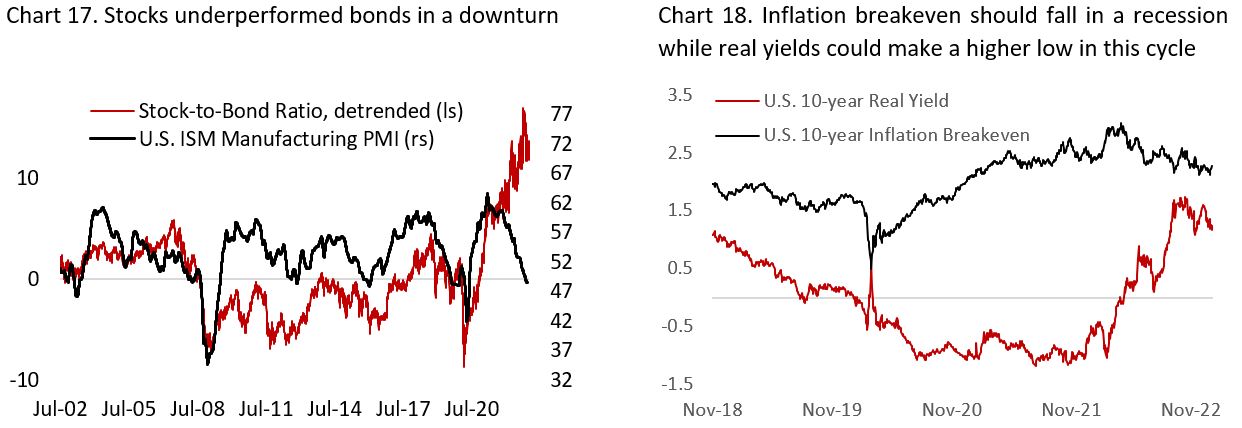
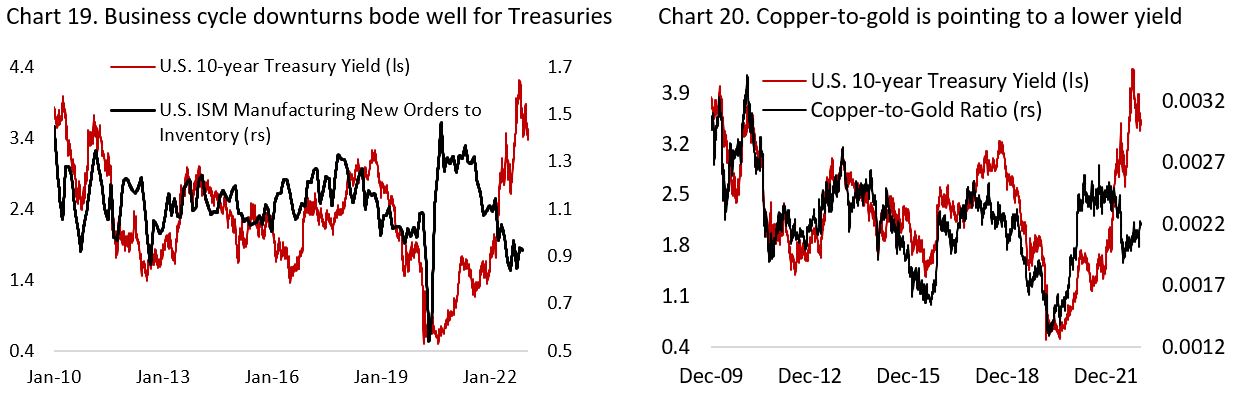
As the bond market has started to price in recently, it is not unlikely that the Fed will be forced to cut rates near the end of 2023 if U.S. and global economic growth turns out to be worse than expected. The risk/reward balance for risk assets is tilted to the downside and we are closely monitoring the potential trough of the business cycle – potentially around Summer. In the case of a proper recession, we think 10-year yield could fall to 2-2.75% range, with the 10-year breakeven inflation falling to 1.5-2% pre-pandemic range and real yield declining to 0.5-0.75% (Chart 18). The macro condition is currently supportive for yields to move lower (Chart 19 and 20).
On the equity side, the depressed equity risk premium (ERP) today is not pricing any potential for recession this year, which we think is an attractive short at the current level. Chart 21 shows that a business cycle downturn in the past two decades have always been accompanied by a spike in ERP for U.S. stocks. In addition, the trend for cyclical stocks relative to defensives remains lower (Chart 22).

Historical Study of “The Low” in S&P 500
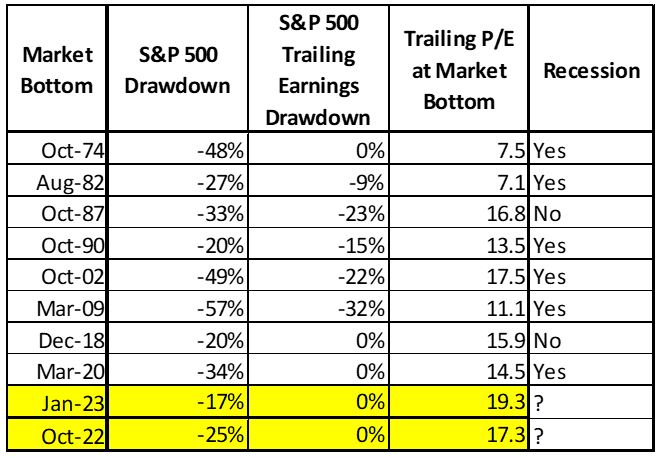
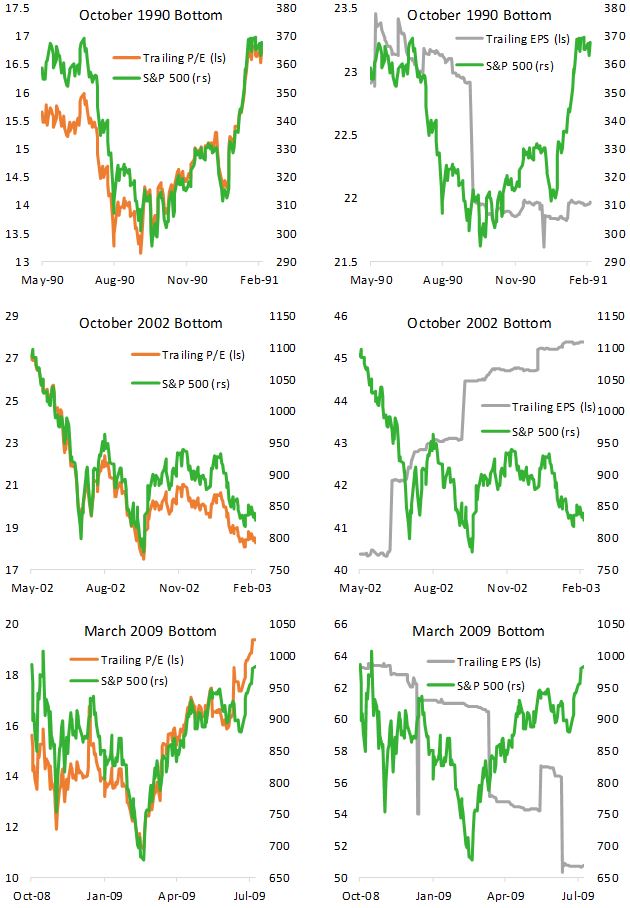
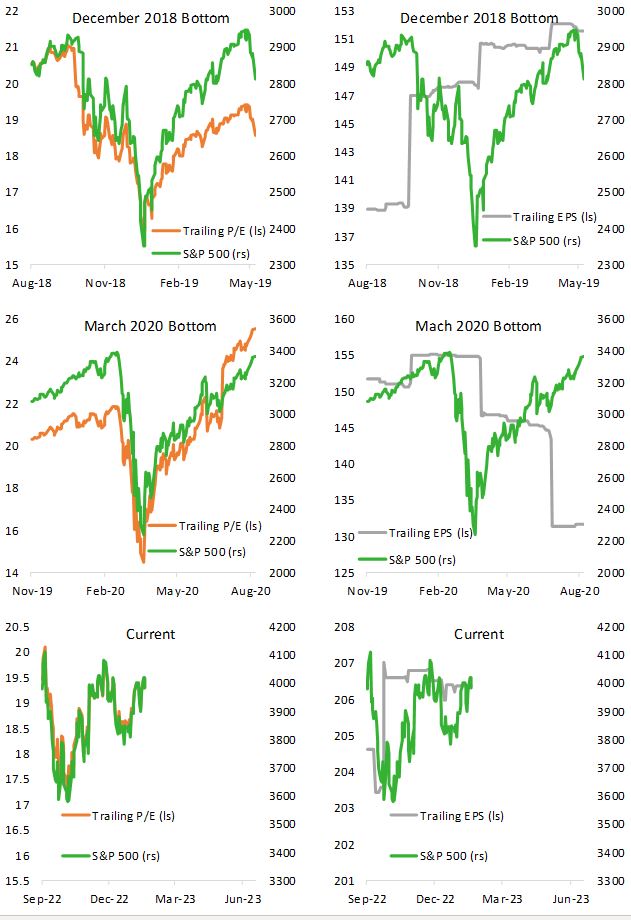
We are skeptical with the narrative that U.S. stocks have bottomed back in October and a new bull market has begun. At 17x trailing earnings and 0% earnings drawdown, the profile of the U.S. index back in October low is inconsistent with previous lows in the market. Table 1 summarizes S&P 500 trailing earnings multiple and growth when U.S. stock indices trough in the previous bear market. In sum, we need a much lower earnings drawdown and multiple before U.S. stocks become compelling again.

Copyright © 2023, Putamen Capital. All rights reserved.
The information, recommendations, analysis and research materials presented in this document are provided for information purposes only and should not be considered or used as an offer or solicitation to sell or buy financial securities or other financial instruments or products, nor to constitute any advice or recommendation with respect to such securities, financial instruments or products. The text, images and other materials contained or displayed on any Putamen Capital products, services, reports, emails or website are proprietary to Putamen Capital and should not be circulated without the expressed authorization of Putamen Capital. Any use of graphs, text or other material from this report by the recipient must acknowledge Putamen Capital as the source and requires advance authorization. Putamen Capital relies on a variety of data providers for economic and financial market information. The data used in this publication may have been obtained from a variety of sources including Bloomberg, Macrobond, CEIC, Choice, MSCI, BofA Merrill Lynch and JP Morgan. The data used, or referred to, in this report are judged to be reliable, but Putamen Capital cannot be held responsible for the accuracy of data used herein.
