December has always been a good month to reflect on what happened over the past year and set goals for the next. Although this year has been painful for most investors, in hindsight it was only logical that the above-potential growth seen following the pandemic could not last forever and the frothy valuations of both bonds and equities have to eventually normalize once liquidity start to tighten. Today, we are seeing signs of a healthier market conditions where the cost of credit better reflects the underlying risk and an increase in risk aversion among market participants that is important for the market to function properly. Unlike in our regular publication, this year-end piece will try to refrain from making market forecast but instead focus on understanding the economic and financial market developments that have transpired in 2022. This understanding, in turn, could shed some lights on what could be in store next year.
First, let us begin with the BUSINESS CYCLE. Chart 1 shows the fluctuation in ISM manufacturing PMI alongside the change in U.S. 2-year Treasury yield, a proxy of the U.S. business cycle and monetary policy. After the Federal Reserve under Chair Volcker successfully tamed inflation in the 1980s, for majority of the time monetary policy has been counter-cyclical, with the goal of dampening growth volatility and the swing in business cycle. This means that when growth start to weaken, the Fed would normally pause or even cut policy rate, and vice versa. This was followed by the global financial crisis and subsequent period of low growth and low inflation that marked the era of easy monetary policy and bull market in asset prices, until it was disturbed by the pandemic. Fearing that the pandemic-induced recession could turn the global economy into deflation, the Fed kept monetary very loose until the end of 2021, even as manufacturing PMI and the overall economy recover sharply – a combination that sent asset prices soaring and stoked various speculative behavior in the financial market, from crypto, meme stock phenomenon, to NFTs.

As inflation spiked, this year the Fed has embarked on the most aggressive rate hike cycle in the past four decades. This is also the first time since the 1980s the Fed is running a procyclical monetary policy, tightening policy even as the business cycle is turning south, which potentially add undue pressure to growth in the next 12-18 months (Chart 2). Already, ISM manufacturing fell into contraction in November.

Chart 3 divides the evolution of the business cycle and monetary policy into four quadrants with focus on the changes since the beginning of the pandemic. Our attention goes directly to the deviation on the lower right quadrant from historical norm. Similar to in Chart 1,this highlights the Fed’s hesitancy to tighten policy in 2021 amid rebound in growth and employment outlook post-pandemic. The second important point is to note how far to the top left we are today compared to history. The blue box is a projection of how the line could evolve going forward if a recession next year brought the U.S. ISM manufacturing PMI to around 40 and 2-year yield simply stay at current level. The risk of Fed making a policy mistake is high, as it continues to raise policy rate and single-mindedly focusing on inflation – which has shown signs of slowing – while discounting the lagged impact of its policy. As long as the Fed continue to its hawkish bias, the market psychology will remain anchored on “good news is bad news”, as stronger growth and/or employment data increase the risk that the Fed will overtighten and push the economy into a deep recession.

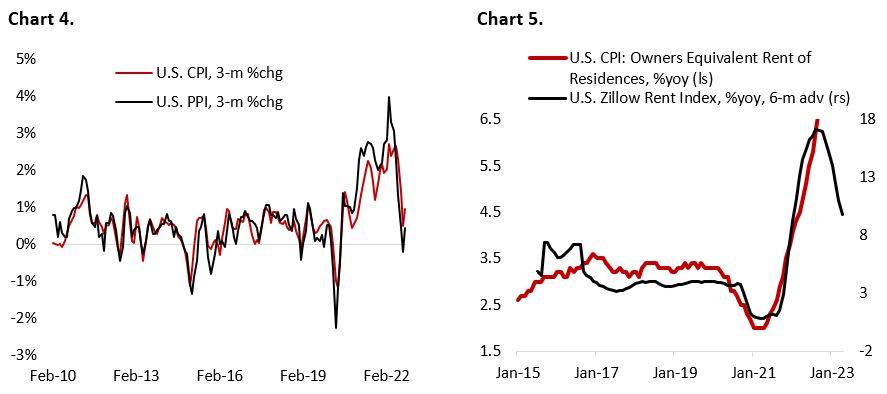
The second most important development relates to INFLATION, which is the heart of financial market dynamic this year. Although CPI and PPI inflation remain too high, there are reason to be optimistic for the next 3-6 months. On a 3-month rate-of-change basis, both CPI and PPI inflation is declining from its peak early this year (Chart 4), with increasing number of components recording a negative m/m growth. Used car price inflation will likely turned negative this month, based on Mannheim used car index, and rent inflation (30% of CPI basket) is potentially peaking too (Chart 5). The peak in inflationary pressure is most likely behind us, with New York Fed underlying inflation gauge already peaked in June and moving progressively lower.
Although the Fed was too complacent in dealing with rising inflation in this cycle, it is not fully wrong in assigning supply-chain disruption as the one of the major drivers, together with higher demand from large government stimulus. Students of economics would be familiar with Chart 6, which eloquently explains the dynamic that pushes inflation much higher in the past 18 months as growth and demand rebound strongly above pre-pandemic level while productive capacity and workers have yet to fully return.

From the demand side (left-hand chart), the shift in the aggregate demand curve to the right amid stimulus-fueled demand growth pushes both GDP and price level higher assuming aggregate supply stays constant. Meanwhile, the supply-chain disruption and reduction in production capacity (right-hand chart) translate to the aggregate supply curve shifting to the left, causing GDP to fall while price level increase, assuming aggregate demand stays constant. Taken together, these shift in AD and AS curve cause price level to be much higher during the normalization period post-pandemic. For inflation to fall going forward, aggregate demand in the economy has to fall and/or aggregate supply has to rise. To gain deeper understanding of the demand dynamic, we partition demand for the U.S. economy into its building blocks, i.e., consumption, investment, government spending, and trade.
Y= C + I + G + (X-M)
Y: GDP G: Government Spending minus Taxes
C: Consumption X-M: Net Trade (Exports minus Imports)
I: Investment
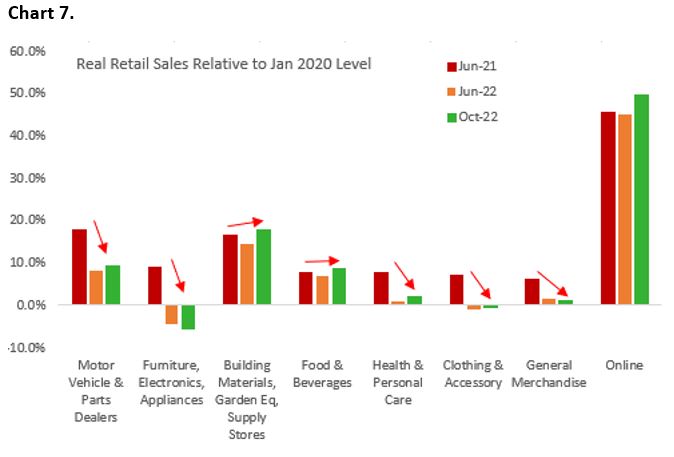
The DEMAND OUTLOOK for the U.S. economy strengthened in the first half of 2022 as consumers continued to spend their excess savings, fueling a strong recovery in the service sector. Goods spending was also strong, although it slowed on an annual rate-of-change basis. We have likely seen the peak in consumer spending in the current cycle, with most of the acceleration in retail spending happened last year when the impulse from the vaccination campaign and reopening of the economy was at its highest. This year real spending on goods has been moderating, especially on durables such as furniture, electronics, and appliances – category that surged during the pandemic (Chart 7). There are pockets of resilience in the housing-related category and online sales, although these categories are also slowing on the margin. At current trajectory, economists are estimating that the accumulated excess savings will be depleted around Q3/23, which should buffer the decline in real income. Meanwhile, the still strong labor market potentially makes consumption the last demand driver to see weakness in this cycle, heralded first by decline in business capex and export demand.
The story is a bit different for business investments, which have seen obvious signs of slowing, with rising number of companies laying off their workers or instituting a hiring freeze. This is contrary to in 2021 when companies cope with the supply-chain disruption by overstocking inventories and some bringing production closer to home. With CEO confidence tumbling, capex spending should further decline in the coming quarters (Chart 8). This is most obvious in the semiconductor space. Earlier this year Intel – one of the most prominent spenders – planned to invest over $20 bn for the construction of chip factories in Ohio while TSMC is building a $12 bn factory in Arizona, but rapidly cooling demand for their final products have forced both companies to lower their capex plan.

The growth headwind outside the U.S. have also translated to a lower U.S. exports demand since the Summer as Europe and emerging market countries were pinched by rising energy prices and monetary tightening (Chart 9). The shift in the U.S. from being a net energy importer to exporter has shielded its domestic economy from the brunt impact of Russian invasion of Ukraine, but China, India, Turkey, and rest of Europe – all a large energy importer – were not so lucky. With the rest of the world mired in their own domestic issues, U.S. growth could continue to outperform at least for the next 3-6 months, presenting a downside risk for U.S. trade balance. Taken together, all four demand drivers of the U.S. economy are slowing, with fiscal thrust unlikely to turn into tailwind considering the gridlock in the Congress (Chart 10).

During the economic recovery phase, stronger demand in the economy translate to higher employment and business capital spending, which in turn push aggregate demand even higher, creating a positive feedback loop until monetary and fiscal policy tightening becomes a significant enough headwind. These forces then work in reverse during the business cycle downturn. Since Summer 2022 the business cycle has been decelerating, as highlighted by the ISM manufacturing PMI (Chart 1). Considering that consumption accounts for 70% of the economy, watching the development of the labor market and its direct link to spending will provide an important clue to the severity of the current downturn.
Although labor demand remains strong today and unemployment rate is near record low, surveys from NFIB small business show demand for workers has peaked and is slowing on the margin, which may become a drag for employment growth in the coming months (Chart 11). Meanwhile, JOLTS job openings declined to 10.3m in October, back to August level, following the uptick in September to 10.7m. Household surveys from Bureau of Labor Statistics also indicate significant easing in employment number despite the still strong non-farm payroll figures. Regardless, it is becoming clear that the momentum in both the economy and labor market is weakening, with the job vacancy/unemployment ratio normalizing from as high as 2x in the Summer to 1.7x currently. Historically, this points to lower wage growth ahead (Chart 12). Combined with decline in inflation breakeven, loosening in the labor market should alleviate the fear that currently high inflation will translate into a wage-inflation spiral.

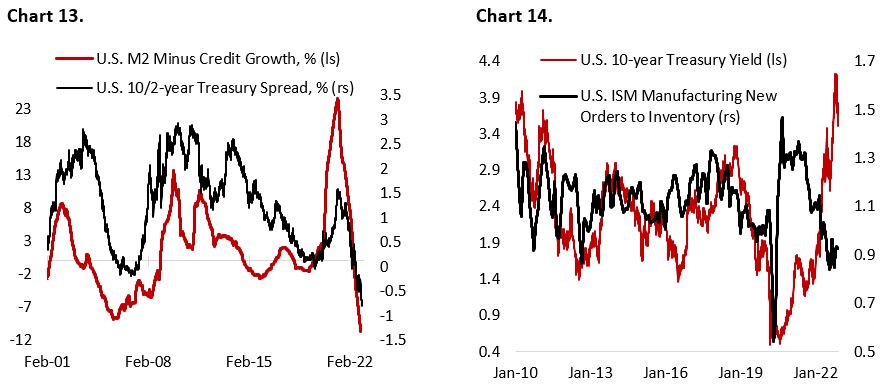
The most prominent development this year, however, is on the MONETARY POLICY front. We begin the year from a very loose monetary condition to a relatively tight one. M2 money supply growth is falling fast and negative when subtracted by credit growth – a proxy for excess liquidity (Chart 13) – while over 80% of the yield curve is now inverted. The shock to liquidity and market is not surprising, given the Fed is expected to raise rate by over 4.75% within the span of a year, which it has never done since the 1980s.
Given that monetary policy works with a lag of 9-24 months, much of the real impact of this year’s rate hike and QT will materialize only in 2023. This is worrisome as the business cycle is expected to be at its weakest around Q2/23 when the bulk of the monetary tightening impact should hit. Unlike in previous cycle, the Fed might hesitate to ease policy, especially considering that inflation will still be above its 2% target (Chart 14). The longer the Fed waits to ease monetary policy and cut rates, the longer (and weaker) the economic recovery will be. The drumbeat of stagflation is getting louder by the day.
Lastly, three points on the EQUITY MARKET:
- Equity multiple has fallen to 18.5x currently, still above historical average of 16x. Recession is not priced in, and equity risk premium is near record low level amid the rise in yields year-to-date (Chart 15).
- Earnings downward revision is not over yet, and margin will face further headwinds as companies have limited room to raise prices in an economic downturn, unlike in 2021/22. At least another 10% decline in earnings estimate is likely (Chart 16).
- Taken together, we continue to see significant downward risk for S&P 500 and other U.S. indices, with the potential for 15-20% correction from current level (SPX: 4050).

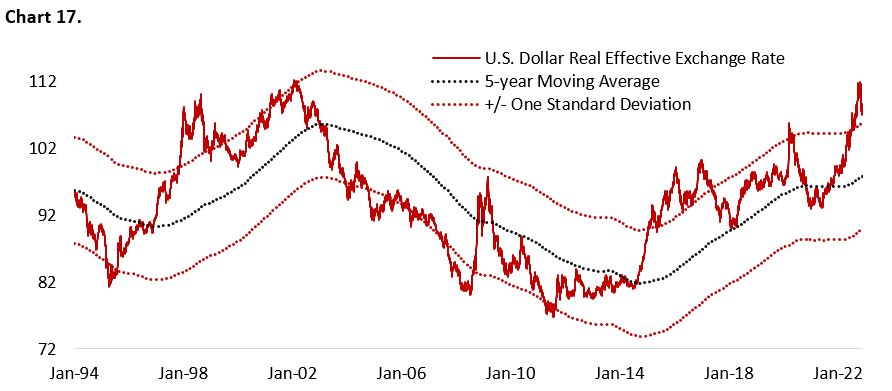
On CURRENCY, we are now turning bearish on the dollar. The U.S. dollar has likely peaked but will remain strong amid elevated recession risk and U.S. rates being among the highest in the developed world (Chart 17). Further slide in the dollar requires stronger Chinese and European growth, whose outlook is still murky currently. History shows that investor would do well to sell the dollar when the Fed stops raising its policy rate.
We promised to not make a market forecast in this piece, but the increasing chance of recession in H1/23 and further decline in inflation should mean equity/bond price correlation could again become negative, with bonds outperforming equities. We are expecting positive absolute return for treasury bonds in the first half of next year.
Copyright © 2022, Putamen Capital. All rights reserved.
The information, recommendations, analysis and research materials presented in this document are provided for information purposes only and should not be considered or used as an offer or solicitation to sell or buy financial securities or other financial instruments or products, nor to constitute any advice or recommendation with respect to such securities, financial instruments or products. The text, images and other materials contained or displayed on any Putamen Capital products, services, reports, emails or website are proprietary to Putamen Capital and should not be circulated without the expressed authorization of Putamen Capital. Any use of graphs, text or other material from this report by the recipient must acknowledge Putamen Capital as the source and requires advance authorization. Putamen Capital relies on a variety of data providers for economic and financial market information. The data used in this publication may have been obtained from a variety of sources including Bloomberg, Macrobond, CEIC, Choice, MSCI, BofA Merrill Lynch and JP Morgan. The data used, or referred to, in this report are judged to be reliable, but Putamen Capital cannot be held responsible for the accuracy of data used herein.
