Download PDF:
Last November we discussed the cyclically bullish but bleaker longer-term outlook for South African assets, in which the former has played out nicely until the end of second quarter this year. Our long position on South African bond was closed on August 10 with 10.2% gain while our overweight recommendation on South African equities returned 17% up to the end of Q2. However, in July we downgraded the bourse to neutral amid rising odds of volatility in risk assets from deteriorating global growth outlook and decline in liquidity. With tailwinds starting to reverse, the country’s structural deficiency will be laid bare and push risk premium higher. It is too early to be positive on the country’s asset market.
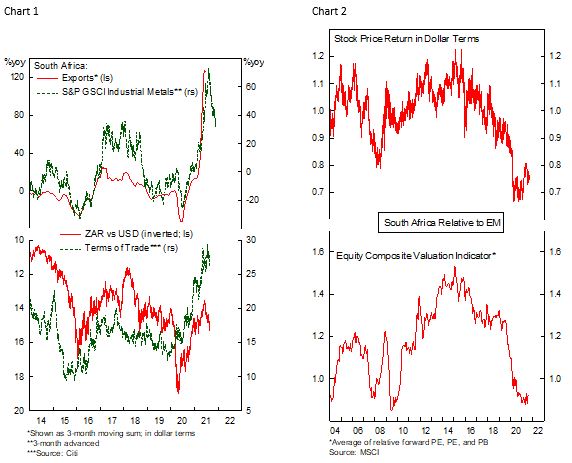
The not so bad thing about South African growth outlook is that commodity prices remain high despite the recent correction. Improving terms of trade over the past year is a strong tailwind to equity earnings and the rand, allowing South African equities and currency to maintain their cheap status despite the rally (Chart 1 and 2). In addition, it is among the few fragile countries in EM that is not experiencing a spike in inflation, allowing the central bank to avoid an abrupt reversal in monetary policy and to support growth (Chart 3). However, greater volatility of the rand and higher weight of material sector in South African benchmark mean historically it suffers during growth downturn – which we expect in the coming 3-6 months.
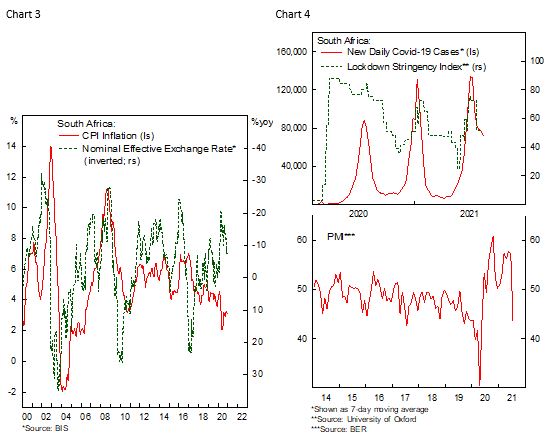
The bad includes poor pandemic management that exacerbate anger towards the government, and poor political landscape and infighting within the ANC, both of which contributed to the unrest last July. The still concerning spread of covid-19 in the country, low vaccination rate and damages from the looting all point to a weak economic recovery this year (Chart 4).
- Unlike last year, when the government is able to support low-income households, currently the government has almost negligible capacity to enact another stimulus – the government is still expected to run 5.7% of GDP deficit this year and public debt level will continue to rise above 80% of GDP, already one of the highest in EM.
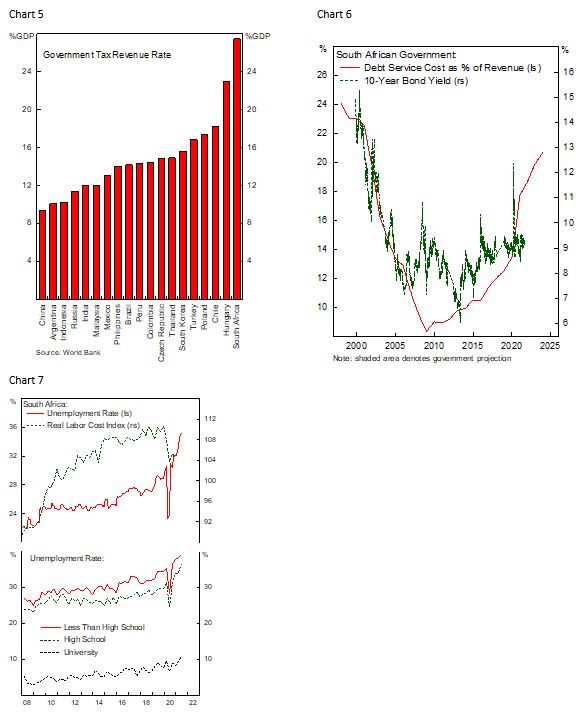
- However, being different to Brazil where tax revenue is only 14% of GDP, South African government revenue is double that and is among the highest in EM (Chart 5). The fact that South African government is still running a huge fiscal deficit highlights the enormous burden on the state to maintain social spending for the unemployed mass, leaving few resources to spend on investment.
- Lack of political consensus over tax and labor reforms has made it difficult for the government to address the structural issues the country is facing. Left unaddressed, this could potentially result the country becoming a failed state, with significant market impact (Chart 6).
The bad factors mentioned above has shaped South Africa’s many ugly faces. Unemployment rate is rising to above 35% while ironically labor cost in real terms is increasing as well, meaning that productivity has suffered. Poring over the breakdown of unemployment shows poor education as the root problem of South African labor and growth issues, in which the prolonged pandemic and limited government resources do not help (Chart 7). This, combined with low domestic savings rate and unattractive environment for foreign investment will continue to leave South African economy at the mercy of fluctuation in commodity prices.
Copyright © 2021, Putamen Capital. All rights reserved.
The information, recommendations, analysis and research materials presented in this document are provided for information purposes only and should not be considered or used as an offer or solicitation to sell or buy financial securities or other financial instruments or products, nor to constitute any advice or recommendation with respect to such securities, financial instruments or products. The text, images and other materials contained or displayed on any Putamen Capital products, services, reports, emails or website are proprietary to Putamen Capital and should not be circulated without the expressed authorization of Putamen Capital. Any use of graphs, text or other material from this report by the recipient must acknowledge Putamen Capital as the source and requires advance authorization. Putamen Capital relies on a variety of data providers for economic and financial market information. The data used in this publication may have been obtained from a variety of sources including Bloomberg, Macrobond, CEIC, Choice, MSCI, BofA Merrill Lynch and JP Morgan. The data used, or referred to, in this report are judged to be reliable, but Putamen Capital cannot be held responsible for the accuracy of data used herein.
