Download PDF:
- Structural Tailwinds for EM Sovereign Bonds
EM sovereigns are currently the only high-yielding asset class in the fixed income space, at a rate slightly above 4% – much above U.S. corporate and Treasury yield. This year crisis and massive QE program conducted by the Fed have brought U.S. Treasury yields close to zero and drag down U.S. corporate bond yields to below 2% amid still rising default rate and numbers of zombie firm – company whose operating profit is inadequate to service debt payments. Fed’s commitment to bring inflation above 2% through its average inflation targeting will likely keep long-term Treasury yield below 1% and act as an anchor for global bond markets, toward which EM bonds’ spread will likely narrow further (Chart 1).
After a decade of lackluster growth, savings and investment imbalances are gradually being corrected in majority of EM countries, following the path of its more developed East Asian counterpart (Chart 2 and 3). Japan, South Korea, China and Taiwan have all had success in building domestic manufacturing powerhouse that exports its product globally; the resulting trade surplus and inflow of foreign capital have been used in building capital stocks that propel these economies living standard in the 20th Century. As EM countries grow richer, savings rate rises and return on investment naturally declines, both of which act as a disinflationary force and drag equilibrium yields in respective countries lower (Chart 4).

- Benign bilateral relationships between countries and the massive process of globalization have helped East Asian countries to catch up rapidly to the West, contrary to current hostile environment where big powers are increasingly suspicious of other’s motives and politicians are stoking nationalism sentiment to garner support. These will be the challenges faced by countries like India, Indonesia, Philippines, and Mexico to escape the middle-income trap.
- Both Indonesia and Russia have a high savings rate relative to other EM countries (Chart 5), which should allow for higher domestic investment and boost growth. However, both economies are tightly linked to commodity prices. Despite the boom in oil and commodity prices in the late 90’s and 2000’s that result in current account surplus for both countries, their governments have not adequately spent on productivity-enhancing infrastructures, resulting in lower than potential growth rate in both economies. The situation is much worst in Russia, where average growth rate post-GFC stands at only 1.6% as the country battled through sanctions and focused on shoring up its finances.
- Cyclically, Indonesian and Russian government fiscal stimulus this year have also been much lower than other EM countries while real policy rates are on the higher range, highlighting the more conservative stance of fiscal and monetary policy (Chart 6 and 7). Lately, Russian CPI inflation has rebounded somewhat due to the much-weakened rouble that led to higher import cost. Indonesian inflation, however, has plunged and stayed at a historical low level (Chart 8); real policy rate and real 10-year yield are now among the highest in EM (Chart 9), both of which likely to go down going forward from a decline in nominal yield.

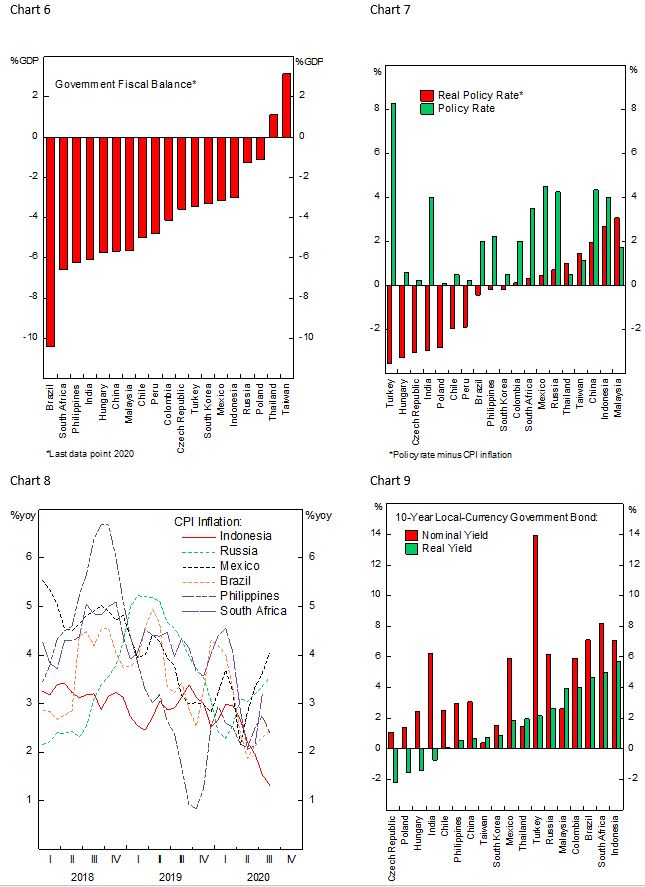
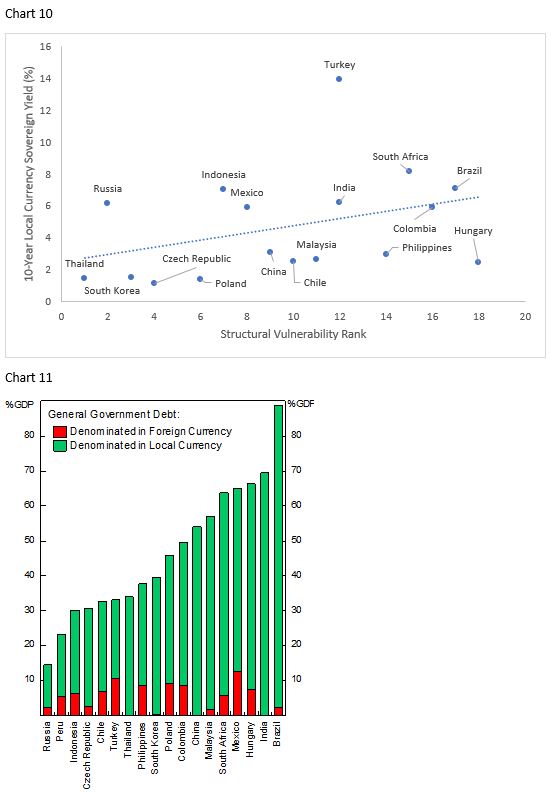
Despite the tailwind for EM sovereign bonds as an asset class, investors should remain selective in terms of country selection and the choice between buying local-currency vs U.S. dollar bonds. To help with the country selection, Chart 10 plots each country’s 10-year bond yield against its Structural Risk Ranking – based on current account, public debt level, reserves adequacy, and fiscal balance. Again, among the more favorable EM countries, Indonesia and Russia stand out as two countries with relatively better risk profile yet having a higher nominal bond yield. The case for Russia is straightforward. The country has been running current account surplus for years, forex reserves are thick, the country has very little public debt, and the government fiscal is also running surplus before the pandemic hit (Chart 11). All these combination makes it very unlikely for the Russian government to default on either of its dollar-denominated or local-currency debt. However, political risk and the country’s undiversified economy warrant extra risk premium demanded by investors. Meanwhile, Indonesian central bank is likely to cut policy rate further, weighing down bond yields and putting it more in line with other EM countries. Inflation should also remain low as private consumption and investment remain weak due to the government’s decision to re-implement another strict lockdown since early September amid rising COVID-19 cases.
- EM Stocks Uneven Recovery
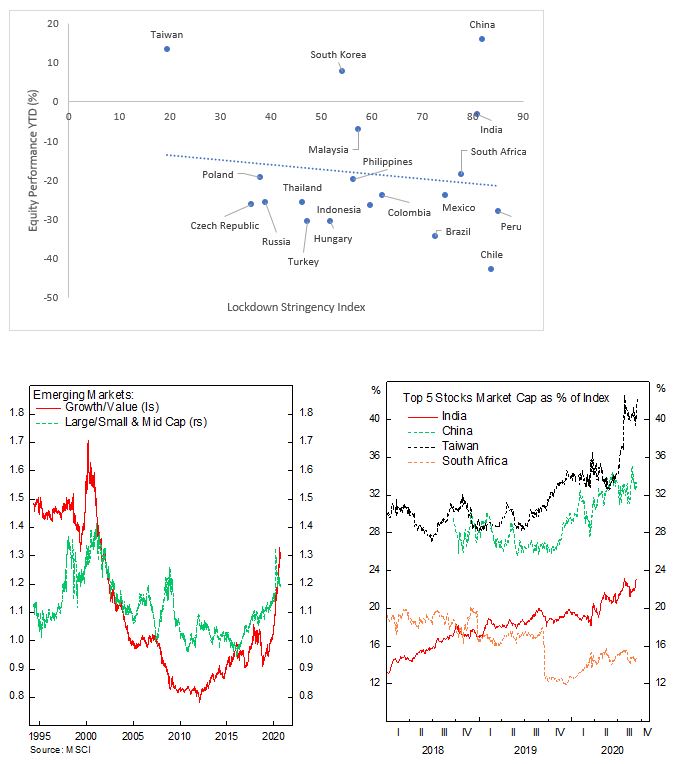
It is curious that EM stocks have performed relatively well compared to its DM counterpart during this year rout, contrary to 2008 financial crisis. This is probably due to the depressed EM stocks valuation; on the surface, a weaker dollar and rebound in commodity prices should have led to outperformance in EM stocks. However, EM stocks are also still weighed by the poor health care situation, ex-China and other East Asian countries, and lockdown restrictions that result in elevated risk premium. A simple chart shows that more stringent lockdown restrictions are well correlated with stock performances. Going forward, positive news on the containment of the disease and further easing on lockdown restrictions likely boost EM assets.

Within EM, the pandemic has accelerated outperformance of growth stocks relative to value, similar to the development in U.S. High-flying tech stocks, which already count for sizable share of many countries’ index, benefit from the pandemic and have seen their stock prices surging. Meanwhile, sectors such as materials, industrials, and banks – that count for larger share of EM index relative to DM – have noted much weaker recovery. These sectors have remained cheap from valuation point of view, while growth stocks are currently recording lofty valuation – a condition that is not sustainable and will likely revert as lockdown restrictions are lifted. We have been recommending clients to overweigh Latam over Asia as a broader rotation theme in Emerging Markets.
The economies of scale that characterize giant firms has boosted their balance sheet strength in facing the shortfall of income during the pandemic. Large cap stocks have outperformed its small and medium counterpart significantly, in-line with the trend of growth vs value trend. These firms, many of which are operating in oligopoly/monopoly environment and have significant cost advantage, count for increasing market share at the cost of squeezing smaller retailer and pop & mom shop. This is good for both large firms’ profit and consumer welfare. The situation is concerning in many countries – the top 5 stocks in Taiwan made up over 40% of the index – and likely result in increasing volatility of its asset market.
Bottom line: the outperformance of growth relative to value in EM stocks are well advanced and unsustainable. We maintain our recommendation to overweigh Latam and clients should start accumulating beaten down sectors, which will likely outperform as lockdown restrictions are lifted.
Copyright © 2020, Putamen Capital. All rights reserved.
The information, recommendations, analysis and research materials presented in this document are provided for information purposes only and should not be considered or used as an offer or solicitation to sell or buy financial securities or other financial instruments or products, nor to constitute any advice or recommendation with respect to such securities, financial instruments or products. The text, images and other materials contained or displayed on any Putamen Capital products, services, reports, emails or website are proprietary to Putamen Capital and should not be circulated without the expressed authorization of Putamen Capital. Any use of graphs, text or other material from this report by the recipient must acknowledge Putamen Capital as the source and requires advance authorization. Putamen Capital relies on a variety of data providers for economic and financial market information. The data used in this publication may have been obtained from a variety of sources including Bloomberg, Macrobond, CEIC, Choice, MSCI, BofA Merrill Lynch and JP Morgan. The data used, or referred to, in this report are judged to be reliable, but Putamen Capital cannot be held responsible for the accuracy of data used herein.
