This piece is a summary of recent NBER paper by Kenneth Rogoff and Yuanchen Yang arguing that Chinese housing market fits the characteristics of a bubble and forms a significant portion of Chinese GDP.
The original paper could be found:
And the PDF version of this summary could be downloaded:
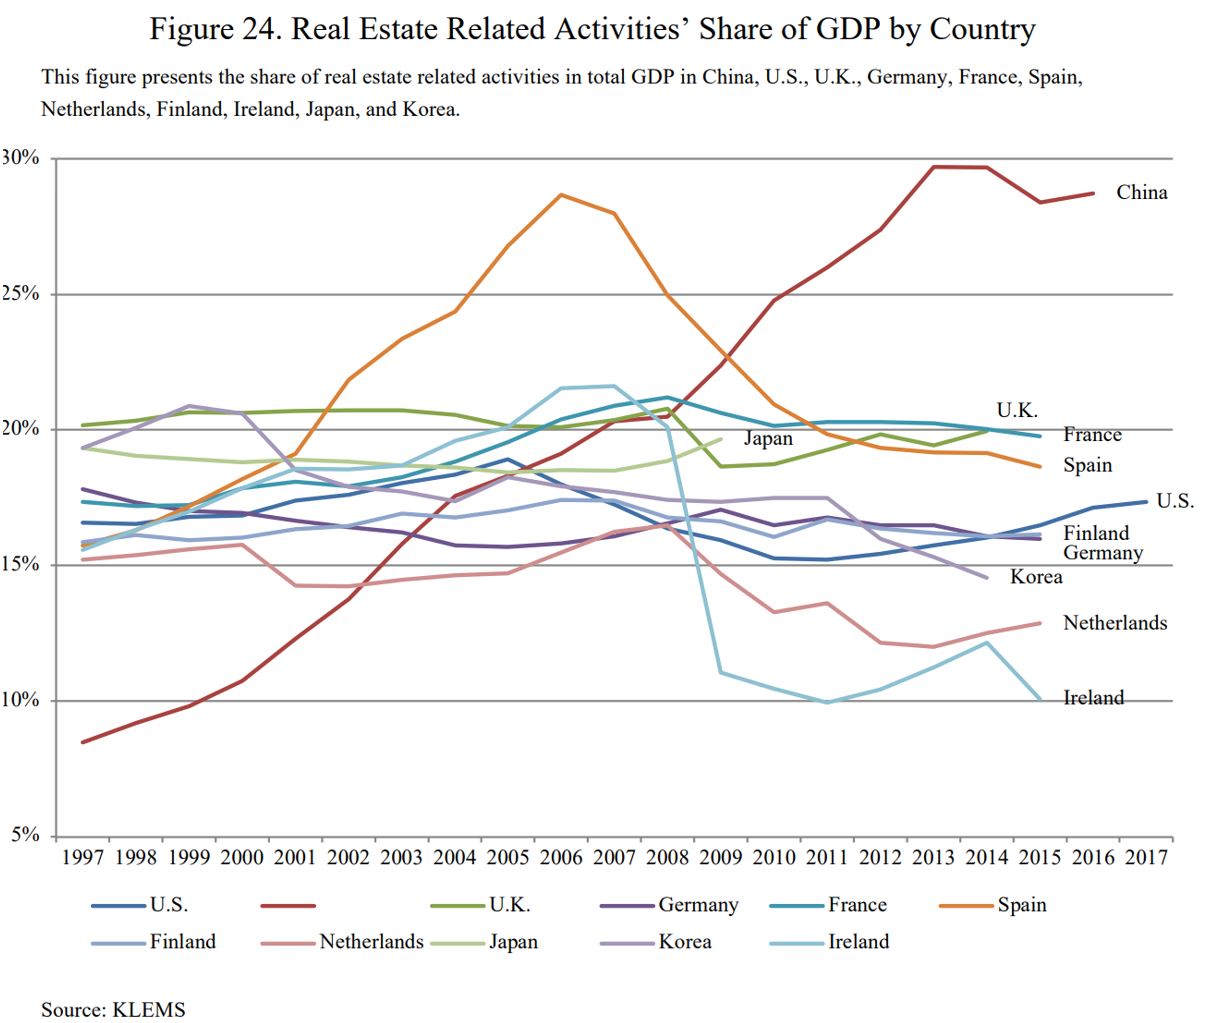
- Real estate and its associated sectors’ contribution to China’s GDP is at 29%, higher than previously estimated
- The paper estimated that 20% fall in RE activity could lead to 5-10% fall in GDP, without accounting for banking crisis
- Housing price in Tier 1 cities have multiplied by six times since 2002, exceeding the 80% increase in US housing boom (2000-2005), 100% increase in Ireland and 230% in Spain.

- Housing price in Tier 2 and 3 are now catching up

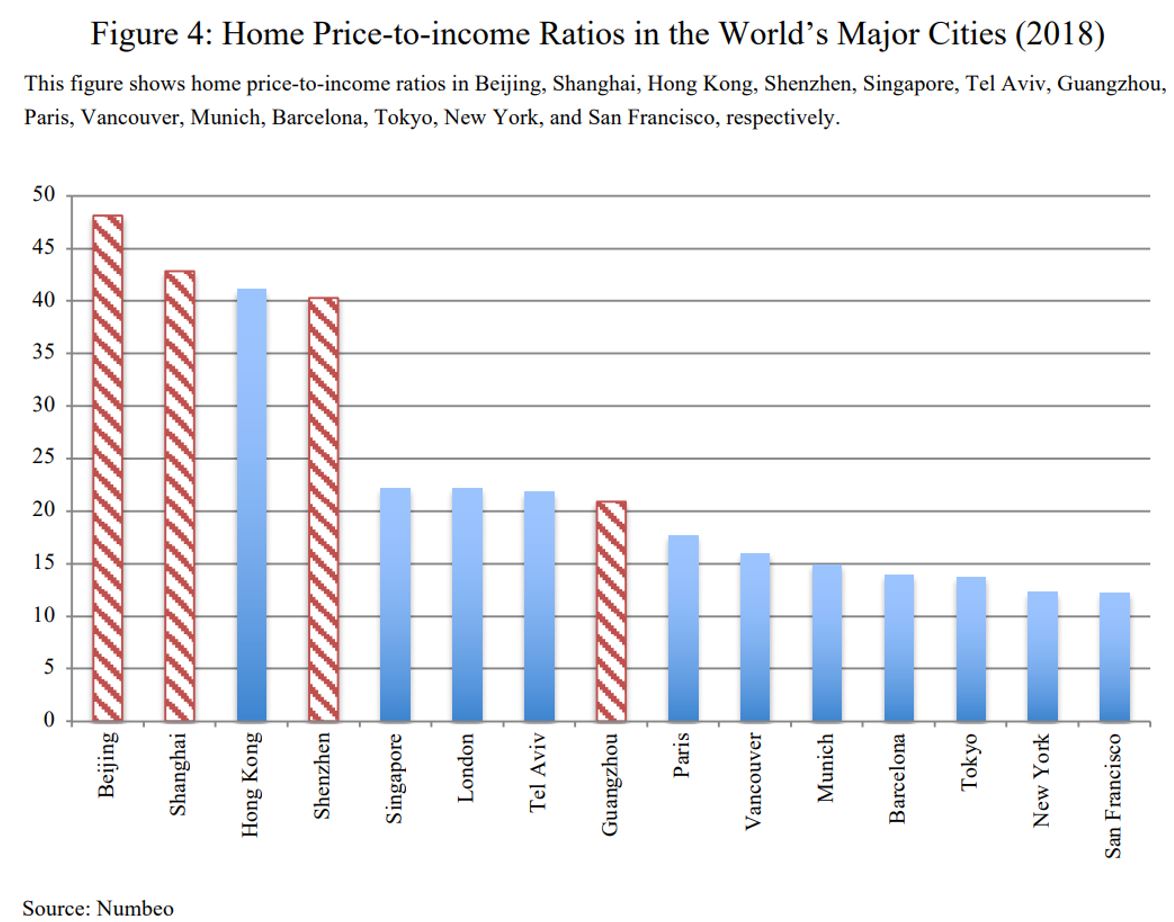
- House price to income ratio in Chinese cities are lofty. It might be justified if income growth will continue to be in line with historical rate, an unlikely case considering aging population, shrinking technological gap and decreasing ROI.
- Chinese real estate investment takes a much higher proportion in GDP than U.S.

- Real estate and construction make up around 20% of urban non-private employment

- In 2018Q4, RE loans account for 28% of total loans and 40% of new loans. Average RE credit was 20% between 2014-18 compared to 6% for manufacturing. Local governments depend on land sales as fiscal revenue (35%) and depend on thriving housing market.

- Housing forms 78% of all assets in China vs 35% for U.S. A decline in housing prices will arguably have a huge impact to Chinese private consumption. The fact that GDP of China is comparable to U.S. but having a housing market value more than twice of U.S. is a reminiscence of Japanese housing bubble in 1990s (also twice the market value of U.S. compared to 1/3 today).

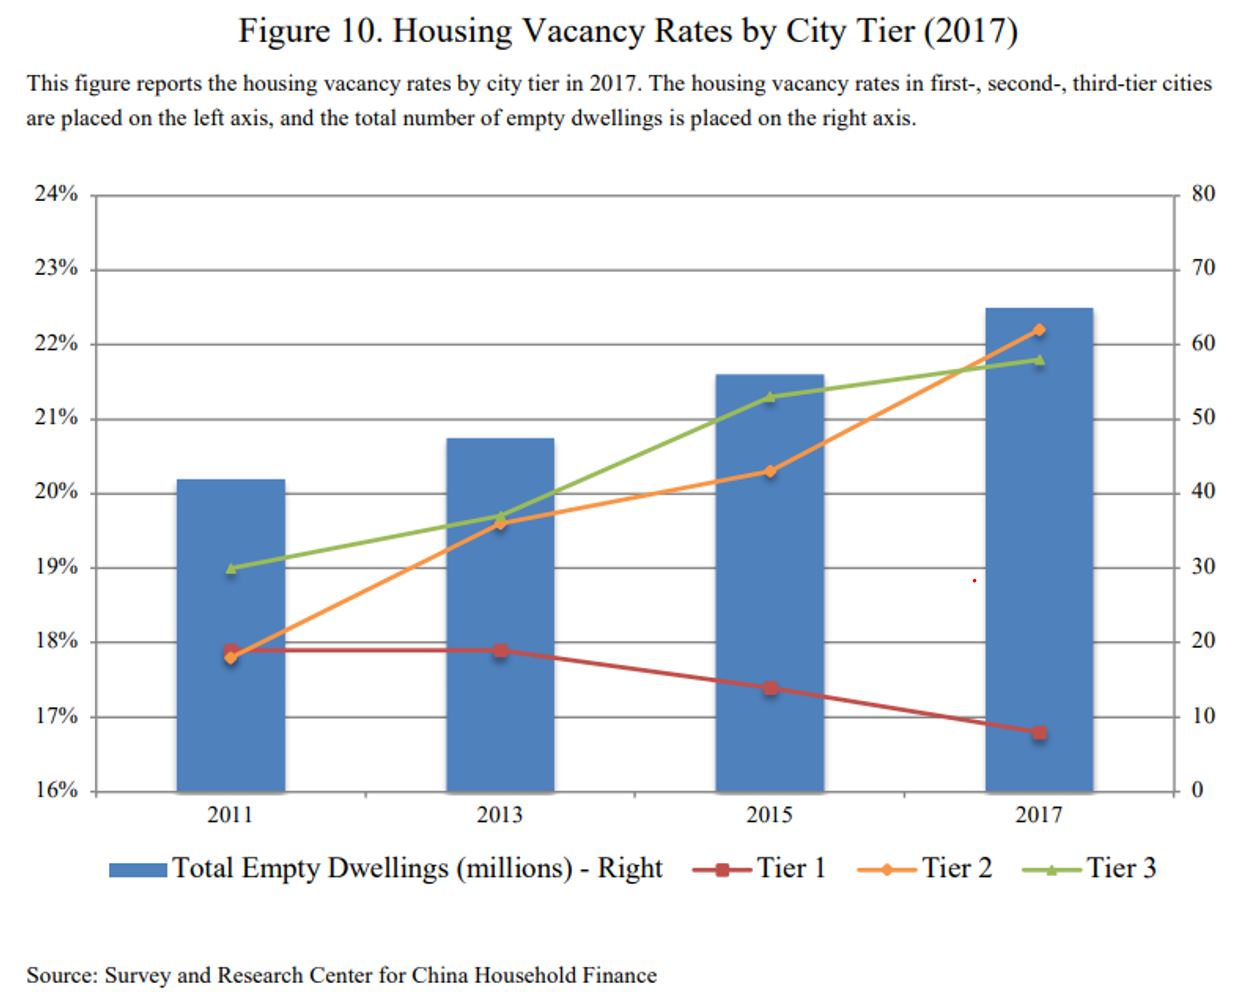
- In 2017, Chinese cities have vacancy rates above most countries in the world

- Chinese housing in Tier 1 cities are beyond the affordability and much above the 2-4x median annual income ratio in U.S. Moreover, the 20-50 age group are shrinking, reducing the demand for new housing formation.

- Chinese household leverage has increased to developed market level of 60% from 18% in 2008. 70% of these are mortgage debt.

- Home ownership for urban household is over 90% for 276 million people, one of the highest in the world, suggesting limited room for massive housing demand going forward. Urbanization rate has reached 60%. 87% of new homebuyers already have more than one dwelling and Price/rent ratio is among the highest globally.


- Excess supply = housing completed + housing under construction – total housing sold. The figure is at 2200 million m2 in 2018, with their 2 cities facing the highest oversupply.

- By another metrics, residential floor space started – total residential floor space sold, the figure is at 2850 million m2 in 2018. Despite high number of unsold housing stock, residential floor space starts are still growing double digit in 2018.


COVID-19 Impact
- Rental price has started to decline in large cities and housing prices in Tier 2 cities have declined up to 14%.

