Download PDF:
The current economic situation in majority of EM countries is still very bleak amid various lockdown measures, but the worst has likely passed as economic activity continue to recover in most countries (Chart 1).
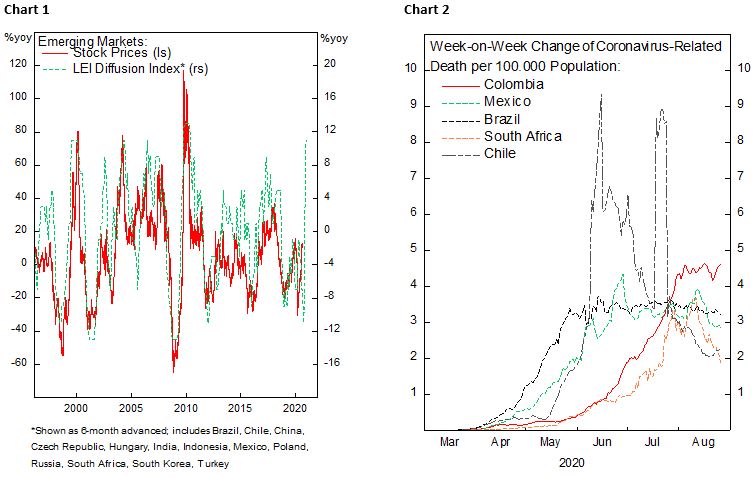
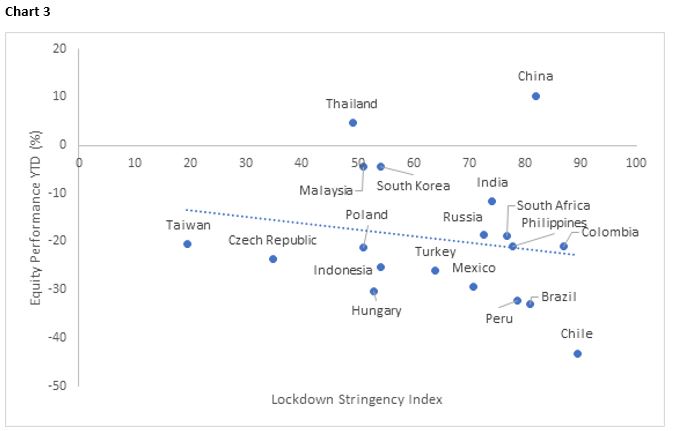
- There are signs that even in the worst-hit EM countries, measured by number of deaths per hundred thousand population, the health care situation is getting under control. The weekly change in deaths rate per population peaked out in July (Chart 2), likely benefitting from the strict lockdown measures and a better understanding of effective treatment against the virus. So far there has not been a report of significant flare in the infection rate, which point to a further downtrend in death rate in the coming weeks.
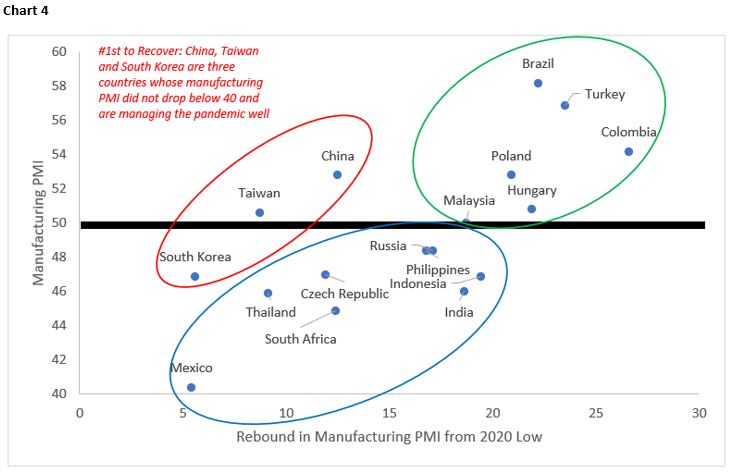
- A better control of the infection rate allows government to ease the stringency of lockdown measures and bring economic activity back to life. Latin American countries, South Africa, Philippines, and India are among the strictest countries in containing the virus and have suffer the most during the crisis (Chart 3). A significant easing of the mobility restriction will likely happen this later year, bar any large uptick in respective country’s infection rate, and drive asset prices higher.
Few Points on EM Countries…
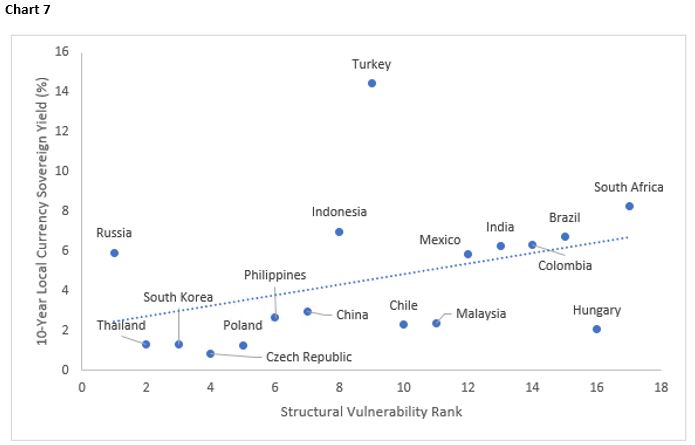
- China, Taiwan, and South Korea have all fare well in curbing the virus and experienced less damage to its economy. The three countries’ manufacturing PMI never dropped below 40 during the crisis and has partially normalized in the past months (Chart 4). These countries have been leading the growth recovery in EM universe and their equity markets have performed equally well year to date (Chart 5).

- Turkey, Brazil, and India have gone all out in easing both fiscal and monetary policies to support the domestic economy (Chart 6). Aggressive rate cuts have pushed real policy rate into negative in these countries while these countries’ government has been running large fiscal deficit even prior to the pandemic (2019: BR -6%; IN -7.4%; TR -5.3%). As a result of these aggressive policy support, Brazilian and Turkish economic activity (manufacturing PMI) have rebounded strongly despite the still high infection rate in the former. Indian economy, meanwhile, has a weaker recovery due to the stringency of implemented lockdown measures.
- Turkish manufacturing likely benefits from pan-European recovery and much cheapened Lira. However, the country is facing a potential foreign-currency crisis due to its central bank actions propping up the Lira and buying a sizable amount of government papers.
- As a result of the aggressive government stimulus and weak fiscal prior to the crisis, investors could potentially shy away from Brazilian assets if the government failed to institute fiscal reform and growth of public debt goes out of control again. Brazil’s GDP growth has been disappointing in the past decade and the economy went to a few crises, making it harder for public debt level to stop rising relative to GDP.

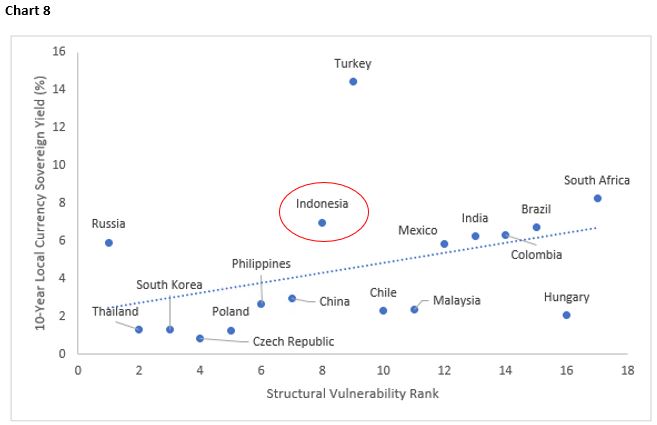
- Few countries still have room to stimulate the domestic economy and play catch-up to the global recovery. The list includes Russia, South Korea, Thailand, Indonesia, and Mexico. Central bank in Mexico, Indonesia and Russia will likely cut its policy rates further this year and yield on the local-currency sovereign bonds are attractive (Chart 7).
- The only game in town for fixed income managers to seek for positive real yield, especially for pension managers. All developed markets’ bonds are now yielding close to zero or negative in nominal terms and deeply negative in real terms, making it a drag for global portfolio performance. The much-depressed and negative real yield of DM bonds has led to the surge of other safe-haven assets such as gold and will eventually force managers to reallocate capital to EM bonds, which still offer decent, 3-5% positive real yield.
- Effective Yield Curve Control (YCC) policy implemented first by BOJ, and now the Fed, caps long-end DM sovereign bond yields to a lower than equilibrium level, which depress government borrowing cost at the expense of savers. Global central banks commitment to keep borrowing cost low makes it unlikely for yields of DM bonds to back up significantly, creating a stable anchor for EM sovereign spread to narrow as global economic recovery progress.
- Many EM currencies, particularly among Latam countries, are massively undervalued. The tailwind from dollar weakness and easy liquidity condition will eventually bolster these laggards’ asset prices.
Bottom line: rotate into laggards within EM equity universe (Latam + Indonesia) and stay positive on select EM sovereign bonds (Table 1 and Chart 8). Long Indonesian 10-year local-currency government bond is attractive from risk/reward and currency perspective.

What About EM Hard-Currency Debt?
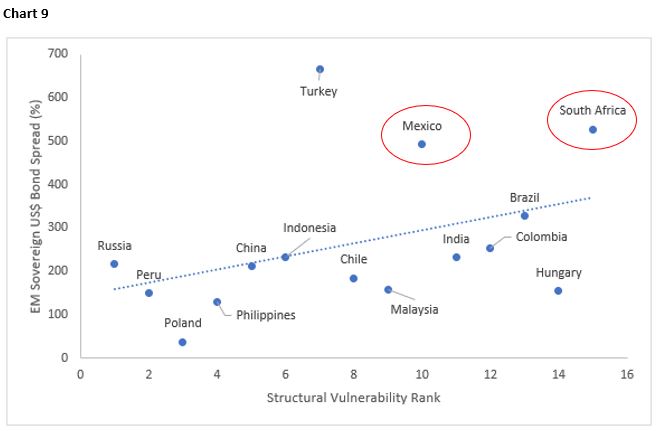
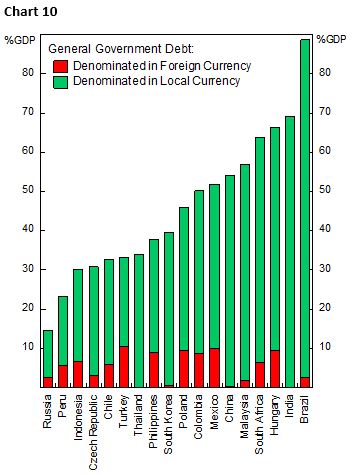
Long Mexican and short South African dollar bond is also attractive from a fundamental and technical point of view, as Mexico has relatively low government debt level compared to South Africa despite both having similar dollar debt borrowing as % of respective country GDP (Chart 9 and Chart 10). South Africa rank worst in our structural vulnerability assessment and the prospect of economic recovery is much bleaker relative to the former.
Copyright © 2020, Putamen Capital. All rights reserved.
The information, recommendations, analysis and research materials presented in this document are provided for information purposes only and should not be considered or used as an offer or solicitation to sell or buy financial securities or other financial instruments or products, nor to constitute any advice or recommendation with respect to such securities, financial instruments or products. The text, images and other materials contained or displayed on any Putamen Capital products, services, reports, emails or website are proprietary to Putamen Capital and should not be circulated without the expressed authorization of Putamen Capital. Any use of graphs, text or other material from this report by the recipient must acknowledge Putamen Capital as the source and requires advance authorization. Putamen Capital relies on a variety of data providers for economic and financial market information. The data used, or referred to, in this report are judged to be reliable, but Putamen Capital cannot be held responsible for the accuracy of data used herein.
