Download PDF: Monthly_202005_Betting On the Underdog
Reflection on the Past Decade
The financial market is characterized by the ebb and flow “leader” and “laggard” over time. The last decade was marked by the strong dollar cycle and boom in fast-growing technology stocks. In hindsight, the weak post-crisis growth outside U.S. and Fed’s tighter monetary policy have been a clear tailwind for the outperformance of both trends. However, with the COVID-19 creating a havoc worldwide and the Fed decreasing rates to zero and initiating QE, the U.S. monetary policy is no longer tighter than other DM economies. The potential reversal of the dollar and debasement of fiat currency across DM countries may trigger a rally in metal prices and commodities in general, a tailwind for many EM economies. Moreover, the decade-long trends in the dollar, growth vs value and EM vs DM seem to have overstretched and due for a rotation (Chart 1).
Chart 1. The Stars Have Aligned for Trend Rotation

The magnitude of correction in EM equities have also provided an encouraging signal. Although EM stocks have suffered massively this year, declining 37% from its peak to through, this has actually been an anomaly as the fall in EM stocks, even excluding China, have been on par with those of S&P 500 and other DM bourses (Chart 2). Historically, EM equity fell by significantly more compared to DM bourses during global market correction. This could be attributed to few reasons. First, EM as an asset class is already cheap before the recent correction, with stock prices in common-currency terms barely moving in the past decade, unlike the case prior to 2008 when EM equity had been undergoing a massive bull market on the back of rising commodity prices (Chart 3). Second, after a decade-long underperformance, EM stocks have been disfavored by global investors, resulting in lower allocation in managed portfolio and hence less prone to mass-selling to fund liquidity needs (Chart 4). Third, EM governments and corporations in general have been improving its governance, in terms of managing its operation and foreign-currency exposure, which leave them more resilient to shock.
Why EM Equity is a Poor Investment in the Last Decade:
- Strong dollar and weak commodity prices. Many EM economies, such as Russia, Indonesia, and Latin American countries, are poorly diversified and relied heavily on primary goods exports. This results in EM government facing a shortfall of fiscal revenue while trying to maintain its spending. Meanwhile, EM firms saw a fall in revenue and contraction in corporate margin due to rising import cost (Chart 5).
- Corporate debt burden. Prior to the Great Financial Crisis (GFC), EM corporates have been borrowing in hard-currency debt, relying on dollar revenue of its goods exports. However, the turnaround in commodity cycle in 2008-2011 have left many EM corporates battling for survival as operating profit declined and interest rate burden rose due to an ever-falling currencies (Chart 5). Post-GFC, however, EM firms foreign currency debt is far off from its late 1990’s level.
- High inflationary pressure has kept monetary policy on the tighter side, leading to higher borrowing cost for both government and corporates. This have resulted in many projects becoming unfeasible and lower than optimal credit necessary for the domestic economy to grow. The good news is that majority of EM countries that historically has higher inflationary pressure, such as India, Indonesia, Mexico and Brazil, is undergoing a structural disinflation. Accordingly, bond yields across EM have been on a structural decline of late (Chart 6).
The potential reversal of headwinds into tailwinds lay the ground for a bull market in EM stocks. A reversal in the dollar and bull market in commodity prices will lead to higher earnings of EM stocks and likely attract investors back into the asset class, allowing multiples to expand. Moreover, the depressed valuation of many EM currencies will help to boost equity returns in common currency terms.
Chart 2. Correction in EM Equity Has Been Milder Than Historical Average

Chart 3. Unlike in 2008, EM Equity Was Falling from An Already Cheap Valuation Level

Chart 4. Funds Outflow from EM Equities Reach Historical High; Investors Have Tapered Holdings in EM Equity

Chart 5. EM Corporates Were Facing Falling Revenue and Impact of Falling Currencies
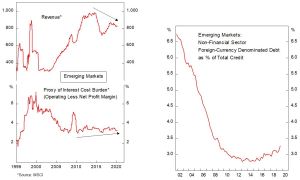
Chart 6. Disinflationary Pressure and Falling Yields Across EM

The Fundamental Case
The slowdown of growth globally in the past decade only strengthen our conviction on EM countries, especially those of Emerging Asian economies, as the potential bright spot for growth in the coming decades. Few observations are in place:
- Demographic benefit. Emerging countries’ underlying population is growing at double the pace of its DM counterpart (Chart 7), a source of long-term demand growth. The massive population growth, urbanization and rising middle class will increasingly put pressure for EM government to improve the quality of public infrastructure, education, and health care services. The accumulation in real capital stock and human capital will in turn translate to increase in productivity.
- Indonesia has been building highway and ports aggressively since 2014 and is moving its capital to outer of Java island, Russia is embarking on a $390 Bn (25% GDP) projects over the next 4 years, and various frontier market (Vietnam and other SE Asian countries) has been cooperating with China under the OBOR. Declining bond yield will allow more investment to have positive NPV and is a tailwind for real investment.
- Productivity catch up. A catch up in technology allows faster labor productivity growth across EM (Chart 8), as it is easier to benefit from technology transfer rather than develop indigenous innovation. A structural case of could be made in Emerging Asian countries (India, Indonesia, Philippines, China) where the government has been allocating more on healthcare and education spending relative to its economy, albeit still at a much lower level compared to its OECD counterparts (Chart 9).
- Improvement of governance by both public and private sector. Although many EM governments are facing lower revenue from the bear cycle in commodity, fiscal management has been fairly prudent. The majority of EM countries have been following the -3% deficit rules and is reigning the growth in public debt (Chart 10). Corporate governance is also improving, particularly in terms of increased borrowing in local-currency terms and hedging against hard-currency debt. EM corporate leverage, ex-China is lower compared to DM corporates, highlighting the conservativeness of EM firms after few rounds of crisis in the past few decades. Even in an EM basket case, such as Brazil, the country recorded negligible jump in bankruptcy during the 2008 crisis (Chart 11). Moreover, the banking system provisioning has been aggressive and capital ratio is well above BASEL III requirement, which underscore the resilience of financial system across EM generally (Chart 12).
- Macro stability. Majority of EM central banks have been erring on the conservative stance in the past decade, putting a cap on inflation at the sacrifice of growth. With inflation well under control due to structural disinflation globally, easing monetary policy is back on the table to boost growth, even prior to the crisis. Current account balance of most EM countries has also adjusted to a more sustainable level after the shock left by commodity bust. If anything, lower oil prices have helped net energy importer countries such as Turkey, India, and China. Currently, two third of EM economies are now running a current account balance under 2% deficit, highlighting the lower dependency on foreign capital (Chart 13). Moreover, EM countries have a healthy banking system compared to DM, in terms of Net Profit Margin, credit growth, capital adequacy, and conservative provisioning of bad loans. This is important to finance investment and support SME, which is the backbone for employment.
In a world scarce of growth, EM countries especially Emerging Asia, are the growth story for the future. Developed countries are becoming similar to Japan by the day, highlighted by low growth and low inflation environment. These developments have resulted in a frail banking sector. Banking profitability in the Japan and across Europe has been on a decline and high NPL burden eats regulatory capital, hence squeezing bank’s ability to lend to businesses and results in a less dynamic economy. This contrasts with EM, where credit demand is high and the banking system capacity to meet real sector need is adequate.
Chart 7. Favorable Long-term Demand Growth…
Chart 8. …And Higher Labor Productivity Growth

Chart 9. Structural Reform in EM is Far from Over
Chart 10. Despite Falling Commodity Prices, EM Fiscal Governance Is Improving
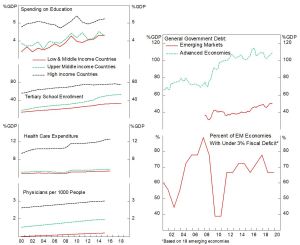
Chart 11. Ex-China, EM Corporate Leverage is Low
Chart 12. EM Banks’ Provisions and Banking Capital are Adequate

Chart 13. EM Countries Are Becoming Less Dependent on Foreign Capital

Conclusion and The Headwind
Granted, many EM countries are now facing a huge headwind from the decline in export demand and surge in unemployment. Countries like Argentina, Egypt, Turkey and South Africa are particularly vulnerable as fiscal and monetary capacity to ease are fairly constraint, which deserves much higher risk premium from global investors’ perspective.
- Many countries have a low savings rate, which trapped them in low investment and low growth environment. This is especially the case in LatAm countries. The drive for infrastructure spending, however, might be the catalyst to change this trend (Chart 14).
- Increasing public debt as % of GDP to finance spending and dubious allocation of government spending toward unproductive expenses. Corruption, weak institutional strength and enforcement of law. Political instability and increasingly autocratic government (Philippines, Hungary, Poland, Russia, Turkey, Thailand, Malaysia).
- Low social safety net among over 50% of the population often leads to social instability and populist demand, which is not conducive for attracting investment. Lack of high-skilled workforce. Education spending varies across EM, but the trend for major countries is rising, especially those in Asia. However, increasing spending doesn’t always translate to better quality of graduates.
All these structural issues take time and great willingness from politician to reform, and there is no sure guarantee that it will lead to economic gain in the medium term. I have to admit that all these theses are nice and may turn out to be correct, but the effect of each thesis being correct is anything but marginal. In the end, if there is one thing that could supercharge EM equities, that is a much weaker dollar.
We also encourage our readers to visit our “Quantitative Model” page to see how our models performed during the crisis. Our Global Asset Allocation Strategy has largely outperformed the MSCI benchmark by shifting allocation from equities into bonds during the market rout and entering the market again once the peak subsides. Meanwhile, our Global Equity Strategy also outperformed the MSCI benchmark by allocating to less risky country during the crash and bottom-fishing the riskier country during the rebound. The laggard is our Global Equity Relative Model, which performed roughly in-line with MSCI benchmark. Overall, we are very happy with this performance and will continue to develop our model into a full-scale quant-driven investing for our systematic portfolio.
Chart 14. Savings Rate Is the Key for Sustainable and Faster Growth

Copyright © 2020, Putamen Capital. All rights reserved.
The information, recommendations, analysis and research materials presented in this document are provided for information purposes only and should not be considered or used as an offer or solicitation to sell or buy financial securities or other financial instruments or products, nor to constitute any advice or recommendation with respect to such securities, financial instruments or products. The text, images and other materials contained or displayed on any Putamen Capital products, services, reports, emails or website are proprietary to Putamen Capital and should not be circulated without the expressed authorization of Putamen Capital. Any use of graphs, text or other material from this report by the recipient must acknowledge Putamen Capital as the source and requires advance authorization. Putamen Capital relies on a variety of data providers for economic and financial market information. The data used in this publication may have been obtained from a variety of sources including Bloomberg, Macrobond, CEIC, Choice, MSCI, BofA Merrill Lynch and JP Morgan. The data used, or referred to, in this report are judged to be reliable, but Putamen Capital cannot be held responsible for the accuracy of data used herein.
