Four months after Putamen Capital started trading, we continue to build and improve our database, model and quantitative trading strategy to guide our investment decision, with the goal of building an all-weather portfolio that outperform our benchmark (MSCI All Country World Index). This month we introduce an enhanced version of our tactical asset allocation and country allocation model, using our previous asset allocation mode as the backbone, by including more robust indicators as the input and a stronger and more stable back-testing result going back to 2006.
With the emergence of volatility as an asset class in the recent decade, we also introduce volatility strategy to profit from a carry strategy in both period of low and high volatility, which has very strong result but also high drawdown. This strategy functions as a return enhancer rather than a single portfolio strategy. Due to that reason, we limit the weight of volatility as an asset class up to 20% of the total unleveraged portfolio value. We will discuss more of the risk-reward feature of this strategy in the following section.
The rest of this monthly piece will talk about our top-down asset allocation process and view on equity, bonds and currency. We believe that investors should also position themselves to protect their portfolio from a sudden increase in volatility, which could be done by either shifting their cash balance to risk-haven currencies, buying treasury duration or VIX in the period of low but rising volatility.
Investment Universe
- Equity: country ETF (DM+ EM) and single name.
- Bond: ETF on UST, US HY, US LL, EM USD Bond, EM LXR Bond
- Currency: cash balance and futures, ETF
- Commodities: futures and ETF on commodity producers
- Real Asset: REITS and REOC, Private Equity ETF
- Volatility: ETF on VIX and inverse VIX
Asset Allocation Strategy:
- Allocated to equity, fixed income, commodity or volatility. Also speculate on currency direction for the cash holding. Asset Allocation model, Speculative position on currencies, Currency REER Fair Value model
- For equity portion, countries with attractive valuation (EV/EBITDA, P/E, P/B) and profitability (ROE, ROIC) relative to EM benchmark. Diversify to 5-8 country holdings and compare to World and EM benchmark. Country allocation model, Country & Sector allocation
- For fixed income portion, decide whether to hold risk-free U.S. Treasury, U.S. HY, U.S. LL, EM LXR Bond or EM USD Bond. Also consider the duration of the holdings. Shorting the U.S. Treasury is also possible through inverse ETF holding. HY and EM USD Bond Spread, Real Yield, Inflation Outlook
- Based on economic cycle and supply-demand view, consider taking long/short position on select commodities (oil, copper, gold, aluminum and soft products) or basket of commodities. DM+EM Countries PMI and IP, Confidence Indicator, Export/Import Growth
- Real assets exposure could be accessed through ETF of real estate operating companies or REITs, but a position on this asset class is not mandatory.
- Based on perceived future volatility, short/long position could be taken to extract the risk premium of market volatility. Hedging model
- Thematic stock position based on financial modelling and valuation. Financial Model
Volatility Strategy
Our volatility strategy is based on a rather simple model of long or short VIX portfolio depending on few market-based indicators, with volatility itself being the most important one. In Putamen Capital, we believe volatility is like a trampoline. There could only be a limited period for sustained low volatility before it must go up again, but the reverse is also true. The strategy seeks to capture the risk premium earned by selling volatility risk, where it is proven empirically that implied volatility on options are always higher than the realized volatility. By tailoring the strategy without over-fitting the data, the model does get false signal occasionally, but it succeeds in significantly reducing the number of trading necessary in implementing the model. During the 12 years period (3100 trading days) there is only 220 (7.1%) transactions of buying and selling the volatility index.
Without accounting for transaction cost, the strategy returned 15837% in the last 12.3 years or 51% annually. However, such performance also comes with a huge volatility of drawdown averaging 40% almost every year. Due to our investment restriction, an allocation up to 20% to this strategy is appropriate although in the implementation we would aim for 10% weight of total portfolio value. On a tail-risk scenario this means losing 6% of the portfolio value on a particular year only from the volatility strategy, either from shorting the VIX when volatility spikes or from holding VIX for too long when volatility is going back down.
Equity Strategy

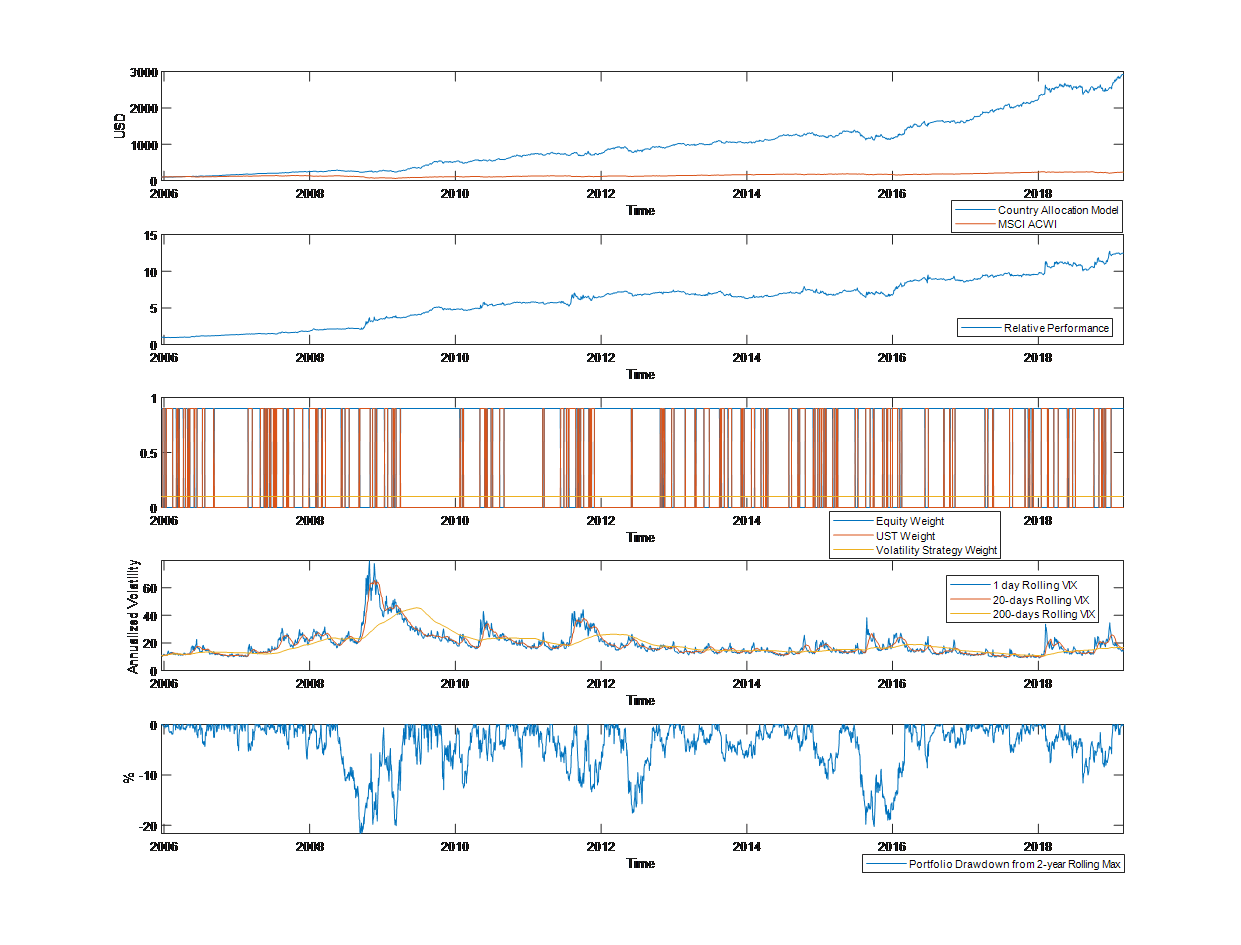
Putamen Capital’s country allocation model has also been improved to reflect not only country fundamentals and valuation, but also market input and a modification of momentum strategy. As a result, the model outperformance has been much more consistent through time with lower drawdown relative to the benchmark. Our “alpha” is derived mainly from country selection and less from the variation in weight of the country included. Since early this year the model has been favoring equity markets in Austria, Australia, Colombia, Germany, Japan, Russia, Turkey and Taiwan. These markets have been beaten hardly last year during the sell-off and became very cheap as a result. We believe that a cyclical recovery, discussed in the later section, will also coincide with a rally for the stocks.
On average, the model spreads the recommendation between 0 and 37 countries, with an average of 12 countries. What’s clever about the model is that it also considers its own historical valuation, hence a long period of bull market will result in fewer and fewer countries being chosen by the model, which could be a proxy for “animal spirit” in the market. In fact, in October 2008 the model highlights all 37 countries as attractive and allocate none of the countries to be selected in July 2016 (hence the flatline in the chart above). Since October 2018, the model has selected a healthy 8 or more countries. The bottom line for an equity manager is to stay fully invested in the market to avoid missing a sudden rally after a correction and emphasis their research more on the country selection. In the section after, we will discuss how we allocate our portfolio into the volatility strategy and equity strategy outlined, and how an unconstrained fund manager could time the market to shift equity-bond weight during period of market volatility.
Asset Allocation Strategy
Merging our equity and volatility strategy into a total portfolio view, we arrived at Putamen Capital’s Tactical Asset Allocation (PCTAA). PCTAA is the bird-eye view for Putamen Capital in allocating funds, both in asset allocation and country selection strategy. As a broad overview, first the model will allocate the portfolio to equity and bond. For simplicity purpose and to reduce the number of transactions required for rebalancing, rather than using gradual weights, we use a full equity or bond allocation with a fixed 10% allocation to volatility strategy, which has an allocation model of its own. Within the equity strategy itself, the model allocates to several countries selected based on the equity model discussed in the previous section.
In the last 12.3 years of back-testing, PCTAA returned 2922% (31.6% annually) compared to benchmark’s 234% (7.2% annually). On a risk management basis, the model also has lower drawdown of 20% compared to 60% for World equity benchmark.
Country Outlook: AT AU CO DE JP RU TR TW

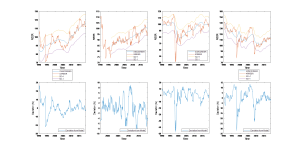
The chart above plots the manufacturing PMI for developed and emerging countries and its 3-month change. In our equity allocation strategy, most of the selected countries are located on the bottom left of the quadrant, which means that the overall manufacturing sector is contracting and probably on the way for a rebound alongside the country’s stock prices. We think that the contraction in European countries are troughing and equity market is cheap by historical standard. Although DAX30, German equity index, has surged 11% YTD we think that the rally has more to go. The same case applies for Japanese and Turkish stocks.
Currency View

On the currency front, we are dollar-bearish and have positive view on EM currencies. The biggest bet is on Argentine Peso, which has stabilized in the past several months and is now trading between the BCRA non-intervention band. Carry trade on this currency should be profitable, even after accounting for the managed depreciation of the ARS by BCRA. Purchasing the ARS could be done through long ARS/BRL and BRL/USD futures.
In our January’s publication we stated:
“We also believe that MXN, COP and INR will appreciate relative to U.S. dollar in 2019.”
Since then, MXN, COP and INR has appreciated (depreciated) by 0.75%, 3.3% and -1.8%. We maintain our positive view on these EM currencies and bonds (more details on the following section).
For a tactical trade on DM currencies, we favor long CAD vs USD as speculative positioning are saturated for both currencies. However, the surged in USD in early February and this month have triggered our position, creating a loss on the portfolio. We are currently looking for a re-entry point on the trade.


Currency Futures and Options Positioning


Bonds View

We maintain our January’s view for EM bonds, where we said:
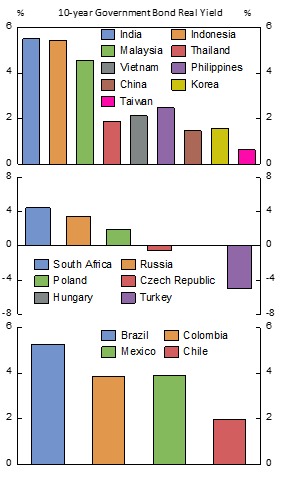
“… upside potential on EM bonds, especially from Brazil, India, Indonesia, Mexico and Colombia. Real bond yield for these countries are above 4%, and with local investors shifting their allocation toward more defensive assets, we think nominal bond yield for these countries will shrink further on the backdrop of controlled inflation.”
Since then, 10-year government bond yield for Brazil, India, Indonesia, Mexico and Colombia have all dropped by 13, 1, 18, 35 and 6 bps. And on the DM bond space, we like to long Italy and U.S. government bond as inflation outlook continue to soften.
Daily Monitor
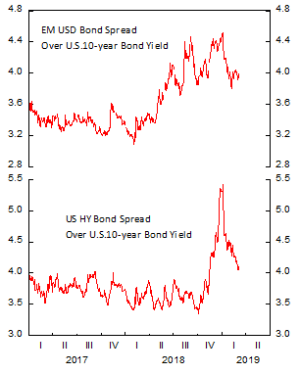
On a short-term basis, we still favor risky assets in the portfolio due to elevated risk premium on both equity and corporate bonds. We think it is too early to call the party is over and we believe if the dollar weakens, as we expected, another rally on world equity and bond are very likely. Therefore, we rounded up the usual suspect of asset classes that will benefit from a reflation effort: copper (and commodity currencies) and oil (CAD).
The bottom line is that we think a new party has just began after last year period of sobriety.

Putamen Capital Growth Fund

The performance of Putamen Growth Fund has been decent since its inception in October 23rd, 2018. The time-weighted return is up 5.75% while our benchmark (MSCI ACWI) is up by 4.4%. What is funny is that PCTAA, our asset allocation model, is up by 14.9% in the same period. Perhaps, we should have let the algo does its job and we all could go sunbathing in Varadero, Cuba.
Admittedly, we did few grave mistakes last year, such as betting on a short-term option on SUPN, a biotech firm that we hold bullish conviction, costing us around 2% of return. Initially the trade was hugely profitable before a drug-testing announcement, which we expected to be positive, came out and the stock prices tumbled 36% within a month, rendering our call option worthless. We were also too overweight on Mexican stocks, which took a beating in the 4th quarter, and sold it during the market bottom before it rebounded 21.7% to the peak in early February. Our rational was that increasing uncertainty in AMLO presidency, highlighted by the cancelation of the airport project, is going to lead a further sell-off in Mexican equity market and currency. That trade alone costs us 3% of portfolio return, significantly reducing our ability to take more risk considering our portfolio’s floor value.
Going forward, we are increasing our trade discipline to avoid taking unrewarded risk and implementing a systematic list of trade ideas to follow up on a weekly basis. The aim is to avoid missing out a good trade opportunity or simply getting out from the markets at an unfavorable time. The difficult part is knowing how deep the water really is, when you are already underwater for quite some time.
Kevin Yulianto, PFM
