A Review of Emerging Markets Equity Performance

Emerging markets equity is an inherently volatile asset class, with annual volatility of 17.7% compared to 14.2% for its developed markets counterpart. Investors who were willing to endure the higher risk has been rewarded tremendously in the long run. Between 1988 and today (Sept 11th, 2018), in U.S. dollar term, EM equity has returned 911% versus 425% for developed markets. The significant return enhancement for overweighting EM should attract investors, especially pension funds, to allocate a significant portion of their assets to EM equity. In a mean-variance framework, EM equity lies closer to the Markowitz efficient frontier than DM equity, which suggest that all investors allocate a portion of their wealth to EM equity regardless of their risk aversion due to its attractive risk/return trade-off.
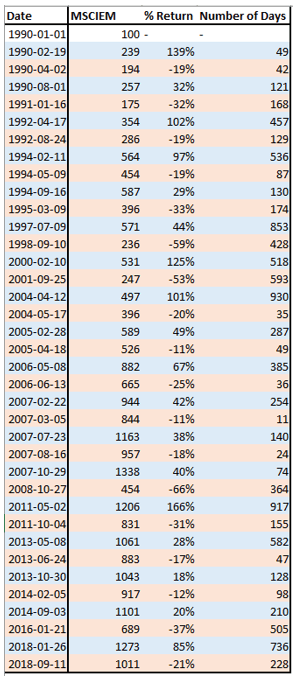
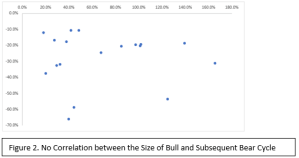
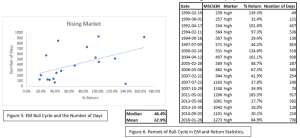
The bull in EM equity, however, also comes with frequent correction where the MSCI EM equity index in U.S. dollar term decline above 10% almost every year. Analyzing through the data from 1988, it was found that the average bull cycle in EM equity took 406 days to end, with the median of 336 days. In fact, the longest bull in EM equity last for only 2.5 years, during the period after dot-com bust and after the 2008 crisis. Meanwhile, the last bull cycle we had after the 2016 correction lasted for a full 2 years, which was overdue for a major correction happening today. But it is not necessarily the case that a long bull market is followed by a long bear market, or that the size of the return matters. Plotting the return during bull markets and the subsequent correction, it was found that there is no correlation among them, as could be seen in figure 2.
Analyzing through the bear cycle of EM equity since 1988, it was found that the median bear market last for 114 days, with the mean of 176 days. Interestingly, there is also a positive correlation between the time it took for the market to reach bottom and the size of the drawdown (figure 3). We are currently on the 228th days of bear cycle and 20.6% off from the peak that occurred at the end of January, which corresponds to the median of EM drawdown and group of majority EM equity corrections happened in the past.
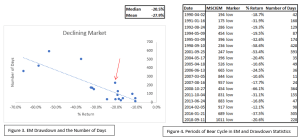
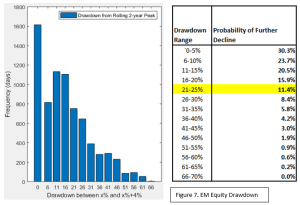
This all means that the strategy of buying EM equity after 20% drawdown would boost return significantly more than half of the time, but on few occasions, investor would suffer loss up to 58% from the entry point, such in the case of 2008 crisis. Also keep in mind that the current bear cycle has been much longer than both the median and average bear cycle history, yet the drawdown size is still mediocre historically, highlighting the potential for further decline from a historical perspective. However, considering that the mean and median bull cycle return is more than twice of the bear, buying EM equity after 20% drawdown gives a very attractive risk/return trade-off. Investing in EM equity after the market bottom yield a median return of 46% that took 336 days to complete.
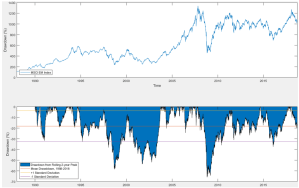
Drawing from the historical period of bull and bear cycle, it is known that bull rally took a little more than twice as long as the bear cycle (mean bull and bear cycle). Combining that with the drawdown distribution in figure 7, we could infer the “probability” of current bear cycle to drift lower, which is 11.4%. Quantifying the probability and magnitude of the further downfall is harder, although we know that the lower EM equity goes, the more attractive the asset class is in the long-term due to lower downside risk. This is the reason that pension funds should see the correction as an opportunity to accumulate EM equity.
- The Big Cycles in Emerging Markets and Developed Markets
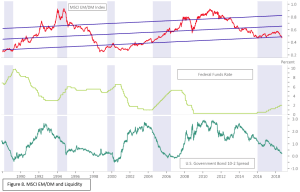
From a historical point of view, U.S. central bank tightening almost always trigger a relative downturn in EM equity relative to DM equity, except in 2004-2006, as indicated by the shaded areas in figure 8. This is most likely attributed to the contraction in global liquidity, which results in multiple contraction for both EM and DM equity. On the upside, contraction in equity multiplier results in higher long-term (10-year) return, as indicated in figure 9 and 10. Currently the forward PE for MSCI EM index is standing at 11.3 and the P/B ratio is at 1.67.

- Emerging Markets Equity Allocation from a Strategic Perspective
EM equity tend to outperform its DM counterpart in the period following a recession, as in the case during post-1998 EM crisis and post-2008 GFC. An interesting observation is that EM equity lag its DM counterpart years before a major DM market crash, as the economic fundamental of many EM countries tend to be more fragile and shows higher vulnerability during tight liquidity condition (figure 7). If this hypothesis turns out to be true, that we will have a DM recession in the coming years, strategy that holds EM equity after the recession and switch to DM equity when the EM/DM cycle turn lower will massively outperform a conventional buy and hold strategy.
We construct a portfolio rotating between EM and DM equity with the rules below:
- Buy EM equity (and 0 weight to DM) when the index is under -1 standard deviation
- Sell EM equity and buy DM equity when the index is above +1 standard deviation
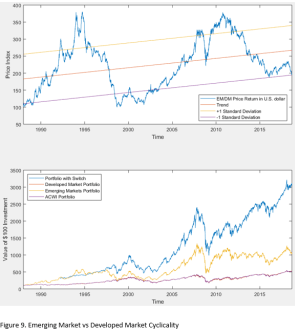
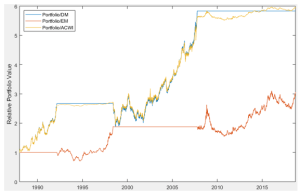
This simple strategy means that the portfolio is holding EM equity in 1988 and switch to full DM equity in March 1992, only to buy EM equity again in 1998. This was followed by a long period of EM bull cycle until the model recommended to switch back to DM equity in October 2007, and it is only now that the signal to buy EM equity is triggered.
Portfolio with 100/0 EM Allocation Switch

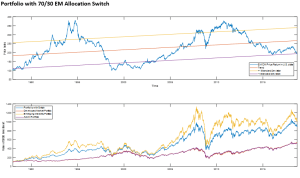
Portfolio with 70/30 EM Allocation Switch
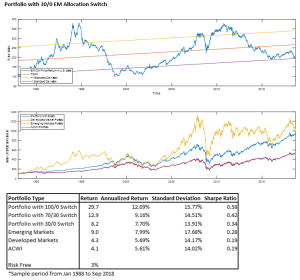
Portfolio with 30/0 EM Allocation Switch
Kevin Yulianto, PFM
