Our decision last month to portfolio equity allocation proved to be a correct one, despite our model suggesting a very defensive position. Emerging Markets and U.S. equity rallied on the backdrop of Fed dovishness and signs of reflation coming from China, the largest importer for many EM countries. We still believe that the growth slowdown in U.S. and reflation in China will be a perfect combination for EM equities, resulting from a weak U.S. dollar and strengthening export demand for commodities. Copper price, in fact, has stopped falling since last July and made a double bottom pattern last December.
 Figure 1. Boom-Bust Indicator and 10/2 Yield Curve Spread
We wrote last month that flattening of the yield curve usually coincide with equity bull market and heightened volatility. With this concept in the back of our mind, we are aware that it looks like we are picking pennies in front of a steamroller. However, we believe that the risk/reward for overweighting EM equities in our portfolio is attractive, if two of our assumptions are correct. First, that our boom-bust indicator is bottoming out, which should coincide with rising commodity (especially oil) price. And second, a status-quo or even easing policy from the Fed and ECB. The weakness in manufacturing sector and political upheaval across Europe, combined with below target inflation, should hold ECB from tightening prematurely.
Model Recommendation
Our model gained 1% in January while our benchmark (MSCI ACWI) gained 7.8%, resulting in underperformance of 6.3% on a month-on-month basis. This is due to the model’s allocation last month to stock up on treasury bond and zero allocation to equity. Meanwhile, our portfolio last month was on a 40/60 equity/bond and we are increasingly convinced that we are in the early phase for turnaround in global risk appetite, the reason that our model is not quick enough to recognize the signs.
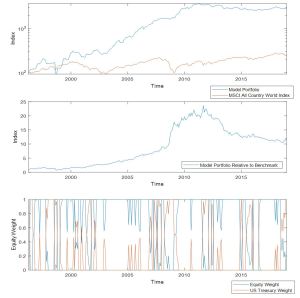 Figure 2. Putamen Capital Asset Allocation Model
We also constructed a risk parity model, to support our risk management process and monitor signals for a turnaround in the cycle, and we are seeing signs that we are in the bottom of current correction cycle. The risk parity model recommends allocation to Treasury Bonds at an extreme level that historically was followed by a rally in equities.

Figure 3. Putamen Capital Risk Parity Model
Portfolio Review
Putamen Growth Fund, since its inception in October 23rd, has returned 6.36% as of last Friday’s market close. Our benchmark (MSCI ACWI), meanwhile, returned 1.26% during the same period. On a YTD basis, compared to Barclay Hedge Fund Index, our fund returned 4.72% while the index returned 3.17%.

Last month, we were building a bullish case for Turkish equity and recommending other long position on Colombian, Mexican, Japanese and EM equity in general. This week, we are building a long-term bull case for Argentine equity. We believe that the currency depreciation should be followed by a rally in equity, as the price adjust with inflation and there is limited downside on the currency. In fact, the BRCA has been intervening by buying US dollar to weaken the currency from the lower band.

For a more detailed analysis of the country selection, read the previous post
