At the beginning of this year, we thought that AI is still going to be the major investment theme this year – with five out of ten themes related to AI – but also highlighted that investors will become more discerning in who are able to produce adequate return on investments. Whereas both hyperscalers – cloud service providers that build and operate data centers – and semiconductors were both perceived as the winners in the buildout of AI infrastructure in 2024 and 2025, this year the performance of these two groups have diverged (Figure 1).
Figure 1. Performance of semiconductors and hyperscalers has diverged as the perceived winners shifted in the buildout of AI infrastructure
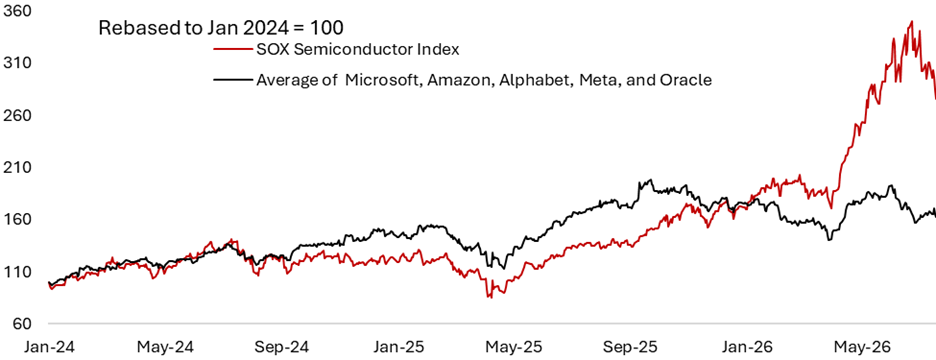
Hyperscalers including Microsoft, Amazon, Alphabet, Meta, and Oracle combined are now spending around US$1 trillion a year to build AI data centers. The capex spending is here and now, bringing free cash flow of these companies close to nil, whereas the return of these investments is more uncertain and in the future.
On the other hand, semiconductor firms are the beneficiaries of this capex spending by hyperscalers. The revenue from selling AI hardware – including AI chips and memory – is here and now, translating to a massive free cash flow for semiconductor companies. For semiconductor companies, the risk today is that hyperscalers will start to curb their capex spending as return on capital become paramount. This will erode the pricing power and margin of semiconductor companies, both of which are at all-time high today.
The contrast in the performance between hyperscalers and semiconductors is only one example of the divergence happening in the market today. There are many more, discussed below. As AI adoption enters its J-curve, physical and financing constraints are the factors that differentiate winning companies from the rest. Some of the bullish narratives on AI envisioned in 2024 and 2025 do become reality in 2026, but there are also surprises along the way, including the spike in commodity prices and rising backlash on the buildout of data center near major metro area in the U.S. This could slow the investment spending on AI and become the bottleneck in scaling the application of AI across global enterprises.
AI Moved to Infrastructure
One of the major themes we got correctly was the importance of access to physical infrastructure, including chips, memory, and electricity. As the pace of data centers buildout increase, there has been a scramble by hyperscalers to secure electricity supply to power their data centers.
Already, surge in demand in electricity to power data centers is translating to higher prices for households (Figure 2), which contributes to the Not in My Backyard (NiMBy) movement against data centers. In July, New York became the first state to pass a one-year moratorium on building data centers. On a more positive note, higher electricity prices increase the incentives for companies to build new power infrastructure, whether it is based on fossil fuels or renewables.
In the near term, majority of the power for data centers is expected to be met by natural gas, however, Alphabet, Amazon, Meta, and Microsoft have all signed power purchase agreements (PPAs) with utility firms that own and operate nuclear power plants as longer-term solutions. In addition, Meta and Microsoft are funding the expansion and restart of existing nuclear plants. In January, Meta also announced a twenty-year PPA with Vistra for 2.6 GW of energy, alongside deals with TerraPower and Oklo that could add 4 GW capacity.
In addition to signing PPAs, hyperscalers are also securing energy supply directly through the acquisition of utility infrastructure. Earlier in the year, Google acquired the energy and data center developer Intersect Power for $4.75 billion in cash while Amazon took over one of the world’s biggest solar-storage projects in Oregon.
All these investments in power require financing, which directly relates to the respective company’s ability to issue debt. Oracle – deemed to have weaker balance sheet compared within the hyperscalers’ group – has seen their credit spread rose to all-time highs as investors demand higher risk premium in lending to the company. This translates to a higher cost of financing for the company and could potentially reduce its competitiveness relative to Amazon, Alphabet, Meta, and Microsoft – who have more durable moat in their other business and lower borrowing rate.
Figure 2. Rising electricity demand to power data centers is translating to higher utility bills for Americans
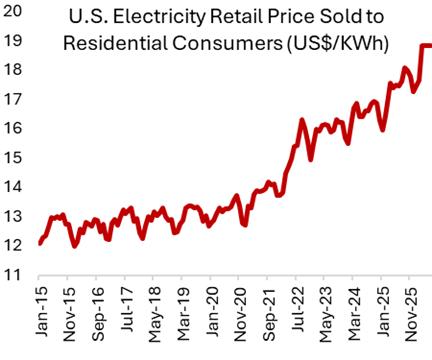
Figure 3. DRAM prices further rose this year following the surge in 2025, contributing to the margin of memory manufacturers
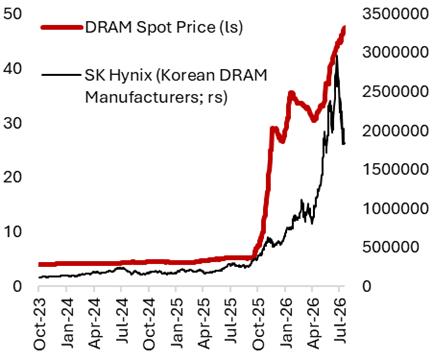
The thesis that higher memory costs will pressure margin for electronics manufacturers is also playing out (Figure 3; Theme 6). However, there are also companies that are able to pass this higher cost to consumers. Apple, for example, raised the price of its devices by around 20% in June, which pushed the price of MacBook higher by US$200-300 for consumers. It remained to be seen whether the higher product price will deter consumers from upgrading their gadgets. This is in line with our view at the beginning of the year that the fate of electronic goods manufacturers will diverge depending on their pricing power.
Power equipment makers have also been major beneficiaries of the data center buildout, with demand for capital goods continuing to be revised higher. In Q2/26 earnings call, GE Vernova raised its annual revenue forecast for the second time in a row in July as strong power demand accelerated order growth across its power and electrification units.
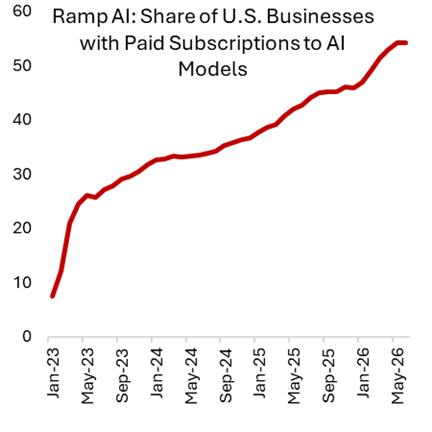
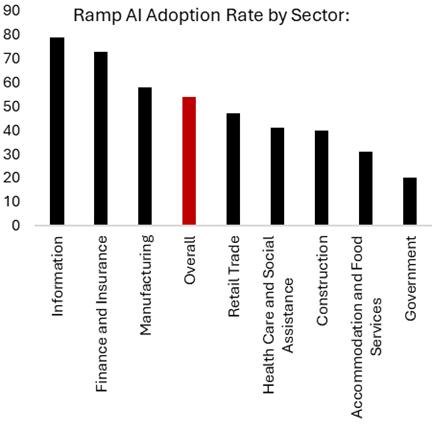
As AI adoption enters its J-curve, we are seeing more concrete evidence of productivity gains from the adoption of AI into workflow across sectors. Data from Ramp AI shows business adoption of AI models and tools reached 54% in May 2026 from less than 10% at the beginning of 2023 (Figure 4a). Interestingly, most businesses that have integrated AI into their workflow paid for models from both Anthropic (41%) and Open AI (39%), which reflects the race between the two leading AI companies in launching more advanced models to increase their market share. As we expected, the adoption of AI has also broadened out to fields outside tech and finance (Figure 4b). Even governments today are adopting AI to parse through intelligence, reduce back office work and simplify permitting process.
For both the info tech and financial sector, which adopted AI earlier than other sectors – we are seeing process improvement amid AI integration translating to lower demand for workers. In the Q2/26, headcounts for U.S. banks fell more than 10.000 despite record revenue and earnings. Meanwhile, the tech industry saw 165.000 layoffs this year following 245.000 layoffs last year. The bottom line is that we are seeing productivity gains from companies and sectors that adopted AI, which potentially translate to the broadening of equity market rally outside the semiconductor sector going forward – our next theme.
Figure 4. Enterprise adoption of AI tools has passed the 50% threshold across many industries
Equity Rally Broadened
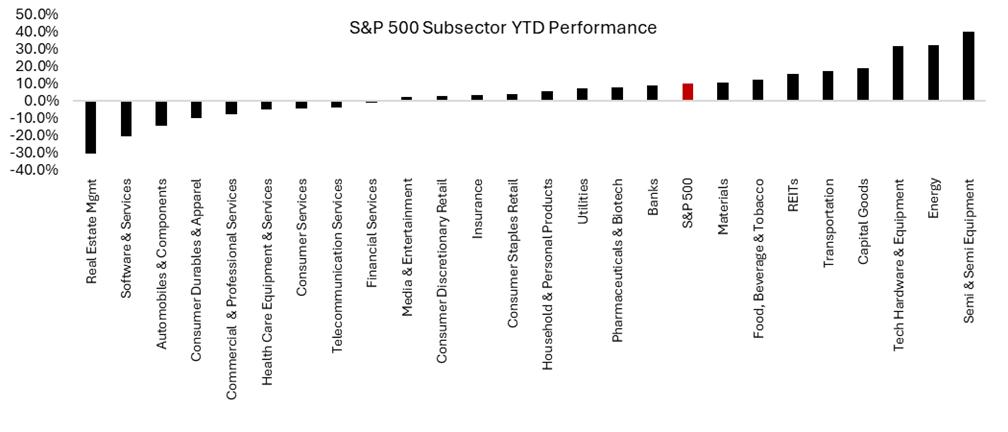
Following three years of double-digit returns for stocks, we remained constructive on stocks at the beginning of 2026 as earnings growth accelerates and the U.S. business cycle upswing continues. As we stated in our opening remarks, within technology sector itself there has been widening divergences between its subsectors. Whichever way investors want to slice it, hardware vs software, hyperscalers vs semis, chips vs memory, these subgroups have a distinct performance driver that makes a general catchphrase of “tech stocks” obsolete. The same goes with the famous Magnificent-7, a group of mega-cap stocks that no longer move in the same direction. For instance, Apple and Nvidia are up double-digit this year, whereas Microsoft, Meta, and Tesla are significantly lower. The return contributors to U.S. stocks this year is no longer dominated by the Mag-7, but rather by stocks such as Texas Instruments, Micron, Intel, Exxon Mobil, and Caterpillar.
Outside the technology complex, many sectors have seen healthy gains too. The energy sector has benefitted from the conflict in the Middle East, while cyclical industries such as capital goods, transports, and materials have also outperformed as they benefitted from the upswing in U.S. manufacturing cycle. This translates to a more durable bull market and alpha opportunity for active managers, as money flows from the concentrated AI play into other subsectors. We expect this trend to continue for the rest of the year.
Figure 5. Semiconductors led equity performance this year, but increasing number of sectors have contributed to equity performance.
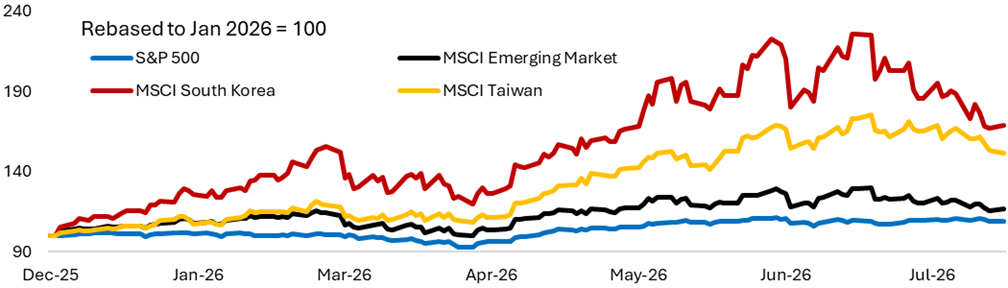
The broadening in equity rally could also be seen from regional perspective, especially in the emerging market. EM stocks continued to outperform the S&P 500 so far this year after doing so in 2026, driven primarily by the strong rally in semiconductor stocks in Korea and Taiwan (Figure 3 and 6). There are signs of manias in the South Korean market, with the AUM of levered ETF reaching as high as US$45 billion at the peak – translating to a heightened volatility for the KOSPI index. In mid-July, 1.2 million retail brokerage accounts were hit with a margin call as the KOSPI fell 9% in a single day. Much of this froth is being unwind at the time of writing. Fundamentally, however, demand for memory chips produced by SK Hynix and Samsung is expected to remain strong, and valuation for both companies is reasonable, which points to investors’ skepticism on the durability of its revenue and earnings.
Figure 6. Emerging Markets have outperformed U.S. equities amid strong gains from Korea and Taiwan
Real Assets and Commodities Still Relevant as We Enter the Capex Cycle
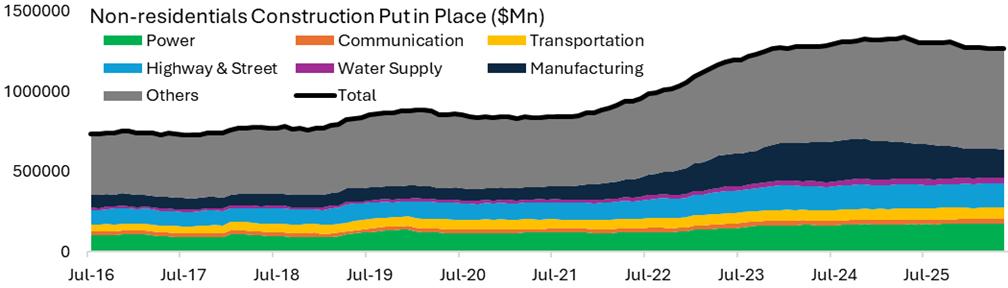
The U.S. economy remained firmly in an infrastructure building phase across power generation, defense, and manufacturing reshoring (Figure 7). Despite only being ~14% of the economy, non-residential fixed investments have driven ~30% of U.S. economic growth in recent years. Unlike consumer-led economic growth that is less commodity intensive, this investment-led growth has translated to higher demand for commodities and benefits wide range of companies, from electrical equipment manufacturers, industrial machinery suppliers, construction and heavy transportation firms, aerospace and defense companies, utilities, to energy infrastructure providers.
In this environment, commodities and real assets became less about simple inflation protection and more about enabling the next economic cycle. Years of underinvestment in energy, mining and infrastructure have left supply constrained just as demand is accelerating – the reason commodity as an asset class is up more than 20% YTD, outperforming even U.S. equities. Many of the most important secular growth themes are becoming more commodity-intensive and infrastructure-intensive, not less.
Figure 7. Infrastructure construction backlog will drive demand for commodities
Geopolitical Risk Remained Elevated
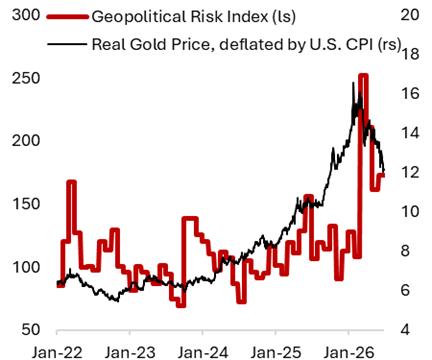
At the beginning of the year, we thought President Trump will focus on winning the mid-term election in November and focus on domestic issues, rather than starting another foreign war. We couldn’t have been more wrong on this. Not only President Trump ordered the extraction of President Maduro from his palace in Caracas, Venezula in January, but he initiated a war with Iran in March – a war that is still very much active at the time of writing. The resulting closure of the Strait of Hormuz where 30% of global seaborne crude oil pass through brought oil prices to above US$100/barrel and worsened the inflation trajectory across countries. In the U.S., affodability issue has become front and center for households, especially those in the lower-income group. Fortunately, the momentum on cyclical industries and AI infrastructure has not been impacted much by the geopolitical volatility. The same cannot be said for European and Japanese stocks, which are more sensitive to change in oil prices due to these countries’ dependency on oil imports.
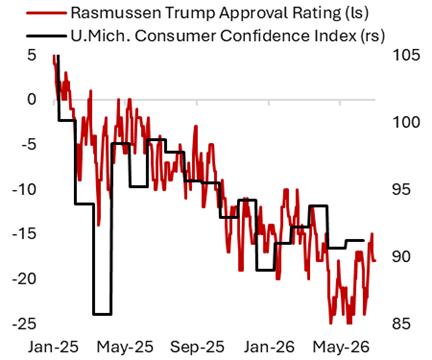
For the U.S. administration, the Middle East conflict and the associated inflationary impact are not without cost. Figure 11 shows that the approval rating of President Trump has deteriorated further between January to June, before recovering. This bodes poorly for the Republican going into the mid-term election in November and increase the pressure for the government to ramp up its spending to win voters. Increasing public spending, however, necessitates an increase in taxes – an unpopular policy for any politicians – or issuing more debt. This goes back to the worrisome trajectory of U.S. fiscal deficit, which could push higher risk premium for the government’s long-term borrowing.
Figure 8. Geopolitical risk jumped in March amid escalation of the U.S.-Iran conflict, which is unwanted by the majority of Americans
Liquidity Proved Easier Than Expected, Despite Change in Fed’s Leadership
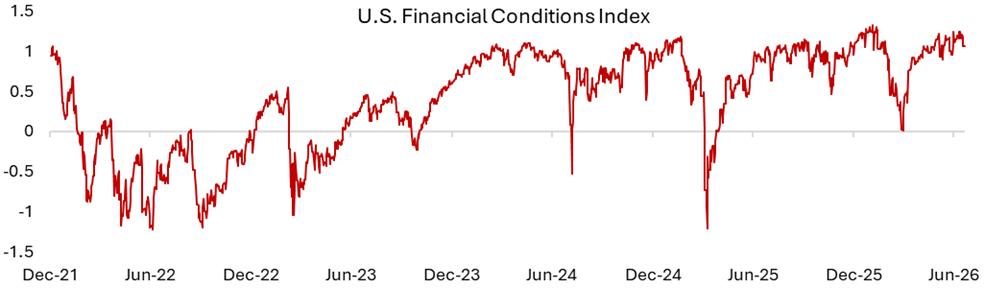
So far this year financial conditions have remained loose for the most part with credit spreads stayed contained and equity valuations proved more resilient than we expected. This is despite intermittent shocks from geopolitics, oil prices and the monetary policy outlook. The change in Federal Reserve’s leadership has also brought a central bank that is potentially less accommodating to financial market stress with Chair Kevin Warsh reviewing many aspects of policymaking within the Fed.
In hindsight, liquidity was supported by several offsetting forces. The U.S.-Iran shock created a brief tightening in financial conditions, but the market treated it as a tradable event rather than the start of a durable stress cycle (Figure 8). As oil prices retraced and recession fears eased, investors quickly returned to risk assets. At the same time, the AI investment cycle continued to provide a powerful growth impulse for the economy and translating to higher equity wealth, stronger capex expectations and resilient earnings sentiment. This combination helped markets look through fiscal unease and tolerate valuation levels that would normally appear vulnerable in a higher-rate environment. It argues for more discipline within risk assets, because easy liquidity can delay adjustment, but it rarely eliminates the need for one.
Figure 8. Financial conditions remained very loose this year, despite a short-lived shock in March amid U.S.-Iran conflict
The Bond Market Reckoning Arrived More Slowly
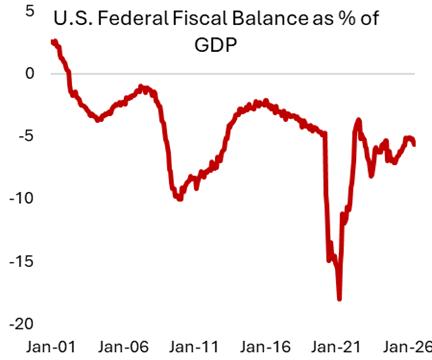
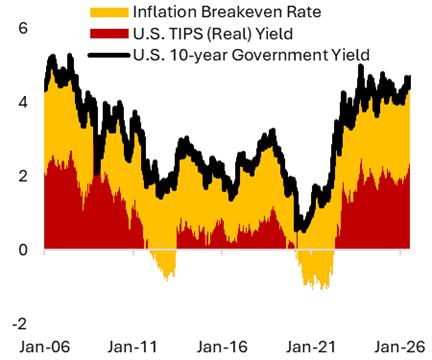
The second surprise of the year was not that fiscal concerns disappeared. They did not. Deficits remained large (Figure 9a), debt issuance continued to rise, and investors had every reason to demand a higher risk premium for lending to governments. What surprised us was how easily markets absorbed those concerns, despite the huge issuance of bonds by hyperscalers that also compete with U.S. government debt issues. We started the year with U.S. 10-year nominal yield at 4.18% and real yield of 1.99%. Today the former is trading around 4.67% and the latter is at 2.33%. Yes, long-term yield has risen as investors demand more compensation for lending to the U.S. government, but the ~50bps increase in nominal yield is far cry from what we saw in 2022 and 2023 when the Fed was on a rate hike cycle (Figure 9b).
Fiscal sustainability, Treasury supply and the level of real rates still matter, but they have not yet become binding constraints on risk appetite. Investors have been willing to distinguish between long-term fiscal fragility and near-term economic resilience. That distinction allowed equities and credit to remain supported for longer than we expected, even as the bond market continued to signal discomfort with the medium-term fiscal trajectory.
We attributed the relative calm in U.S. bond market to the abundant liquidity in the financial system. Our framework was right to emphasize debt, deficits and financing costs, but we underestimated the market’s willingness to fund risk while economic growth remained resilient. For portfolio construction, this argues against abandoning risk assets solely because fiscal risks are visible.
Figure 9. U.S. fiscal sustainability remains a concern and fiscal deficits are still large despite tariffs revenue, translating to higher risk premium in the market
We Overestimated U.S. Reshoring Efforts
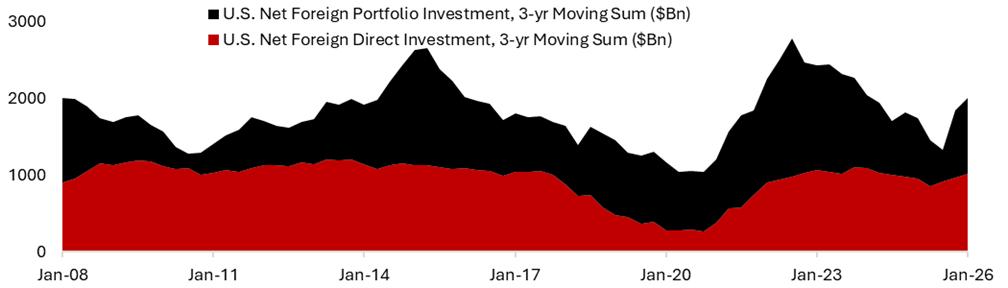
Following the escalation of tariffs in April 2025, companies have been rethinking their supply-chain vulnerability and the tradeoffs of having their manufacturing facilities outside of the U.S. Despite pledges by goods manufacturers and drug makers to bring manufacturing facilities to the U.S. to serve American customers, however, we have yet to see surge in the flow of foreign direct investments into the U.S. (Figure 10). This could perhaps be attributed to the constantly-changing U.S. tariffs policies and geopolitical volatility seen throughout the year – creating complexities for businesses in planning their capex spending plan. On the more positive note, we did see portfolio investment flows rose as U.S. assets benefit from the safe-haven flow into the greenback
There has been frustration by the U.S. administration on the pace of reshoring, with President Trump in July announced a 100% tariff on imported generic drugs, set to take effect in August 2028, with the goal of accelerating the pace of reshoring efforts. We remain cautiously optimistic on this theme but acknowledged that incoherent U.S. administration policies is counterproductive to the goal of making the U.S. a more attractive investment destination for manufacturers.
Figure 10. Portfolio flows or fast money have dominated the capital flow into the U.S.
Copyright © 2026, Putamen Capital. All rights reserved.
The information, recommendations, analysis and research materials presented in this document are provided for information purposes only and should not be considered or used as an offer or solicitation to sell or buy financial securities or other financial instruments or products, nor to constitute any advice or recommendation with respect to such securities, financial instruments or products. The text, images and other materials contained or displayed on any Putamen Capital products, services, reports, emails or website are proprietary to Putamen Capital and should not be circulated without the expressed authorization of Putamen Capital. Any use of graphs, text or other material from this report by the recipient must acknowledge Putamen Capital as the source and requires advance authorization. Putamen Capital relies on a variety of data providers for economic and financial market information. The data used in this publication may have been obtained from a variety of sources including Bloomberg, Macrobond, CEIC, Choice, MSCI, BofA Merrill Lynch and JP Morgan. The data used, or referred to, in this report are judged to be reliable, but Putamen Capital cannot be held responsible for the accuracy of data used herein.

