“It ain’t what you don’t know that gets you into trouble. It’s what you know for sure that just ain’t so” – Mark Twain
I think the quote above sums up beautifully the blind spot we and other strategists may have amid the current late phase of the business cycle. After all, few, if any, analysts were expecting the U.S. regional banking mini crisis in March. Banking analysts have argued for years that stringent regulation and capital buffer following the global financial crisis have made banks’ balance sheet and liquidity condition much more robust. And yet, interest rate risk – the basic function of a banking system – turned out to be primary factor that drove the collapse of Silicon Valley Bank.
History shows that financial accident(s) tend to occur during this phase of the cycle, and could be driven by various factors: 1) liquidity-driven, such as the stress in repo market at the end of 2018 that forced the Fed to pause and subsequently cut its policy rates, 2) economic weakness, as seen following period of monetary policy tightening and oil price shock in 1991, 3) banking crisis, for instance the global financial crisis in 2008 and savings and loan crisis in the 1980s, 4) weakness in other parts of the world that affects U.S. financial market, e.g. Russian debt default and LTCM fiasco in the late 1990s, 5) burst of a bubble, commonly associated with the collapse of asset prices in 2000 and 1929.
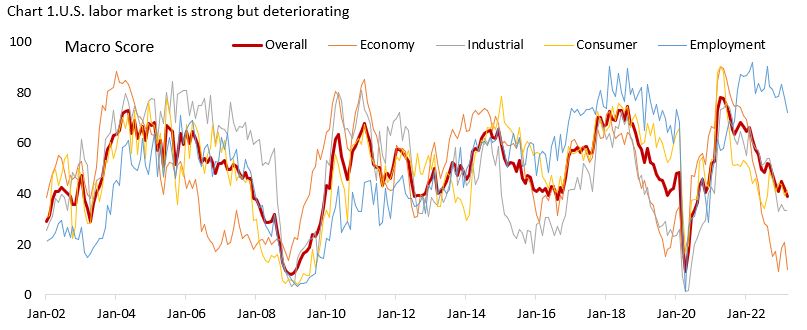
For months we have constantly highlighted the ongoing deterioration in U.S. macro-outlook, with our leading indicators continue to point to a more severe recession this year, which we revisit in the section below. We have to admit, however, that the U.S. economy and labor market today are stronger and much more resilient than what we expected six and twelve months ago – likely due to the excess savings consumers accumulated during the pandemic and strong labor demand.
Chart 1 shows the percentile rank of twenty-two leading and coincident indicators we monitor, blending them into four broad categories. The indicator for the economy, which is more forward looking, has now deteriorated to the low seen during the global financial crisis. Note how weak this indicator had been in early 2007, before the other three indicators caught up to the downside in the following quarters. The difference to today is that in 2008 the industrial sector was much stronger amid multi-year commodity boom and tailwind from China’s double-digit growth, whereas the current strength in the economy is primarily driven by consumers, whose outlook is very strongly correlated to the employment picture.
Even though the U.S. economy is currently already in a manufacturing recession, and potentially entering earnings recession (two consecutive quarter of negative %y/y earnings growth), the U.S. equity market is still trading at a relatively rich valuation (18.9x forward earnings) and analysts have so far maintained optimistic earnings expectations following the expected trough in Q2/23. Meanwhile, put/call ratio is now back to its historical average (Chart 2). The risk of being in a Minsky moment cannot be understated.

The section below discusses our fundamental views on the macro-outlook for the U.S. and to certain extend global economy based on our conviction levels, focusing our analysis on the potential for credit crunch among small and medium enterprises (SMEs) and its broader implication to the labor market. We think this will be the key factor in determining the severity of the current cycle downturn.
What we know with confidence (or we think we do)
The underlying thesis of our bearish view on equities hinged on the assumption that the U.S. economy is on the late phase of the business cycle, with the impact of monetary policy tightening continues to act as a headwind to growth in the coming quarters (Chart: ISM manufacturing PMI vs 5-year yield). This is clearly highlighted in Chart 1 and other leading indicators that do not support the view that we are at the beginning of a new business cycle:
- Leading indicators, liquidity, and M2 money supply growth is falling (Chart 3 and 4). This has historically happened at the very end of the business cycle when monetary policy tightening is near its end and just prior to a material deceleration in growth. Again, these are not something that would be commonly seen at the beginning of a new business cycle.
- Manufacturers, one of the most cyclical sectors in the economy, are cutting down working hours to a level unseen since the global financial crisis (Chart 5). The dearth of new orders is apparent in the ISM surveys since last November as many companies are now overstocked with goods ordered in the previous quarters when supply chain disruption was all the rage. Meanwhile, small businesses are cutting back on hiring. We think it’s only about time before job vacancy decline to pre-pandemic level amid worsening growth outlook and small and medium enterprises (SMEs) – a segment that accounts for over 70% of job openings – appetite to expand curtailed by a more difficult and expensive access to financing (Chart 6). Not only hiring, but capex spending should also turn negative on a year-on-year basis as corporate executives maintain a gloomy view on the economy.
- Lastly, even consumers are pulling back on spending despite the strong labor market amid decline in purchasing power and drain in excess savings accumulated during the pandemic (Chart 7). One of many ways to gauge the strength of consumers is to look at the default rate on consumer credit. On aggregate level, default rates for consumer loans are still lower than pre-pandemic level (Chart 8). The details, however, unveil a more concerning picture. During difficult periods, consumers tend to first default on credit cards, and subsequently car loans, before finally defaulting on their mortgage. The default rate for bank card has risen to 3.37% in March 2023 compared to 3.28% just before the pandemic, despite the currently strong labor market. The deteriorating growth outlook and looser labor market should mean default rate will further rise in the coming quarters.
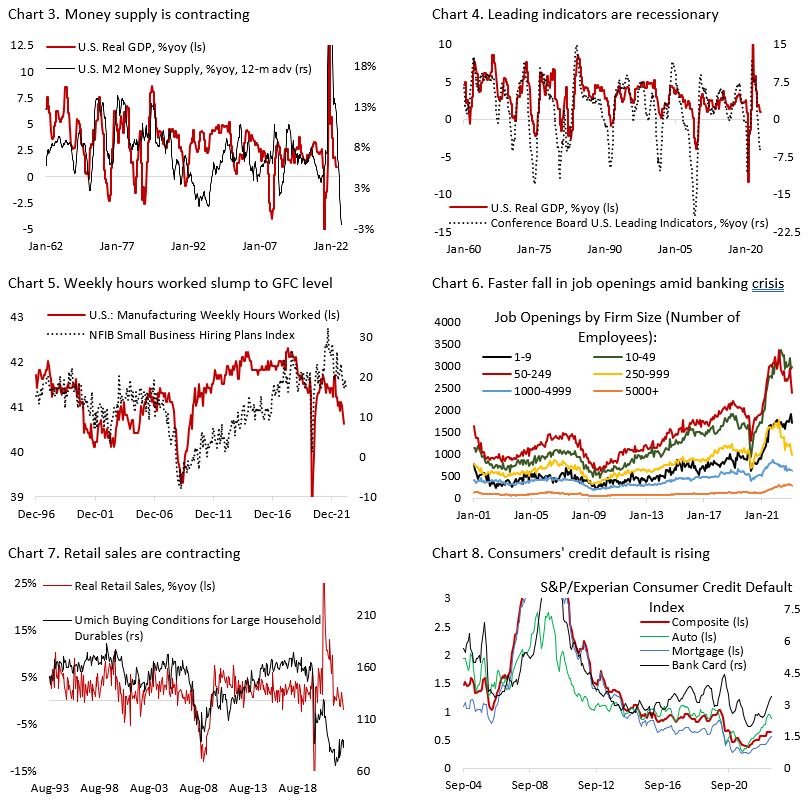
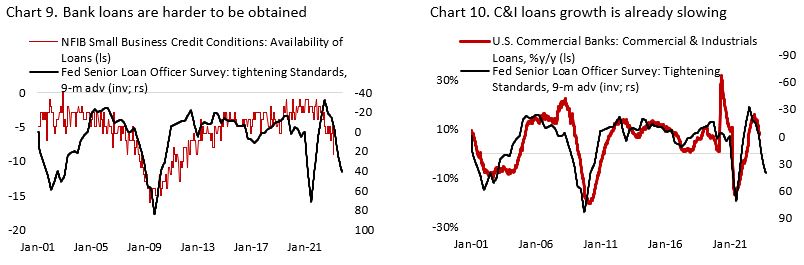
These all highlight the downside risk to U.S. domestic growth outlook, with the recent regional banking crisis and deposit outflow likely accelerating the decline in credit growth as banks shore up its liquidity and capital ratio. This will decrease lending volume (Chart 9) and increase borrowing rate, a direct hit to corporate America’s bottom line. Chart 10 shows that commercial & industrials loans growth could fall over -5% by the end of the year, a level that has historically coincided with recession.
Outside the U.S., there are signs that the mini rebound in European economy, supported by the slump in energy prices, is likely at its tail as well, as headwinds from tightening in monetary conditions are increasing. Euro Area ZEW economic sentiment index has continued to fall in April following a tick higher in January and February. The real good news for global economy is coming from China, where PBoC is still on an easing mode and government policy is still somewhat stimulative. However, the likelihood of weaker consumer spending in the U.S. and Europe should translate to headwinds for the country’s export and manufacturing activity – as apparent in the weak Q1/23 industrial production number. Moreover, infrastructure construction and the real estate sector is unlikely to drive growth as it has in the past two decades, putting the onus of Chinese economic recovery on the service sector/consumer spending. The bottom line is that we doubt stronger growth from outside the U.S. could help its domestic economy from falling into recession.
What we are not sure of, but have a bias on
One macro variable that we are more constructive on relative to the consensus is inflation. Raw material prices and PPI inflation have continued to fall in recent months, which should continue to weigh headline CPI inflation lower. In addition, the price component in ISM service survey has fallen in a straight-line fashion and currently points to a decline in headline CPI inflation closer to 3% in the coming months (Chart 11). A weaker labor market condition and moderation in wage growth should also prevent core service inflation from rising significantly from current level, although timing the exact month it would peak is a difficult game to play (Chart 12).
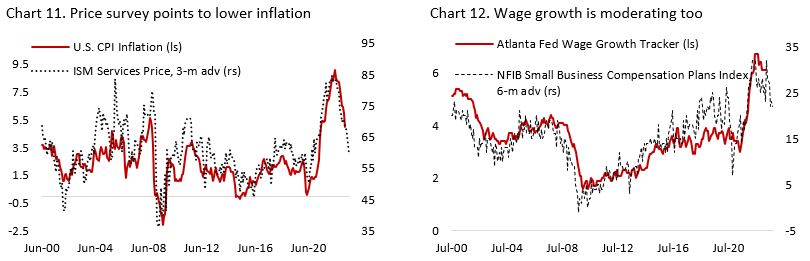
Continued progress on inflation hinged on the strength of the labor market condition going forward, which makes leading indicators on employment important to monitor. It is encouraging to see wage growth is cooling despite unemployment rate being near record low level and vacancy-to-unemployed ratio remaining elevated. There are several leading employment indicators to support the argument for much weaker labor market in the coming quarters:
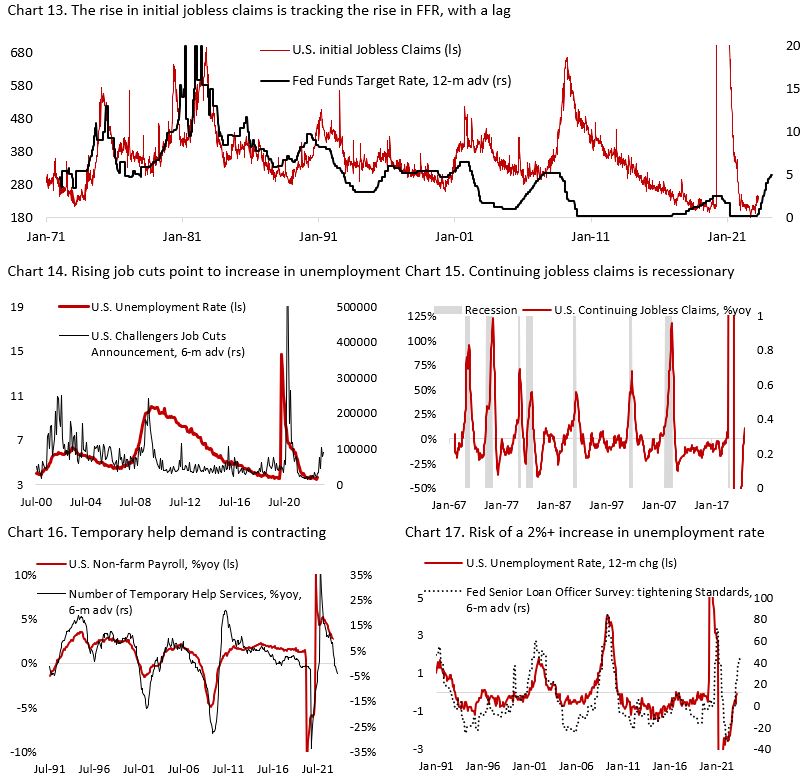
- First, initial jobless claims have been trending higher and consistently follows the historical 12-month lag of the change in policy rate (Chart 13). Given the rapid increase in interest rate over the past one year, the rise in jobless claims in the coming year may also be faster than historically had been the case.
- Second, corporate layoff has accelerated as corporate executive streamline their operation in face of weaker macro-outlook (Chart 14). This has translated to a higher continuing jobless claim, whose rise (%y/y) above the zero line is recessionary. There have been only three instances over the past fifty years, in 1985, 1993, and 1996, when a new business cycle begins without being preceded by a spike in unemployment (Chart 15).
- Third, the demand for temporary help, which historically led the headline non-farm payroll employment, has contracted relative to last year’s level and is pointing to contraction in headline non-farm payroll by the end of Q3/23 (Chart 16). Meanwhile, the tightening in loan standards highlighted the upside risk to unemployment rate rising to above 2% to 5.6% by September 2023 from the current level of 3.6% (Chart 17). This would mark the beginning of recession sometime in Q2/Q3.
The outlook for a tougher labor market condition, however, is surrounded by plenty of uncertainty. For instance, the strength in the housing sector has supporting employment in the construction category as uncompleted building projects are still abundant despite lower new housing demand. However, leading indicator for housing such as mortgage applications and building permits have continued to deteriorate. We will closely monitor these indicators and look for deviation from historical trend and the leading indicators.
The combination of tightening liquidity, contracting real consumer spending, and deteriorating employment outlook should amount to a significant headwind for equity earnings. Earnings estimates for 2023 have fallen significantly over the past two quarters and should continue to fall as the lagged impact of policy tightening hit, which limit the potential upside for equities (Chart 18). First, lower inflation is a sign of slower demand – translating to lower nominal top-line growth for equities – while margin continues to be at risk from deteriorating operating leverage. For the equity market to make a convincing case of a renewed bull market, breadth has to improve, and earnings estimate has to rise. Neither is happening currently, with the U.S. market being supported primarily by the mega-cap tech stocks that dominate the index and trade at excessive valuation.

What we do not know
This section highlights the important risks out there that are difficult to measure or track by most investors. Given the large potential of unknown unknown risks associated to these developments, it is difficult to estimate the full extent of their impact.
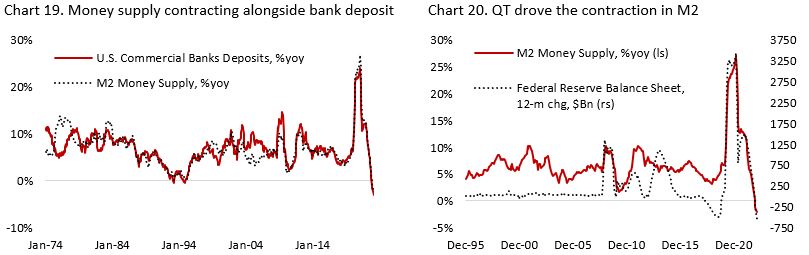
The first and probably greatest risk still relates to the drain of liquidity in the banking and financial system, which partially caused U.S. regional banking crisis back in March. Money supply has been contracting alongside bank deposits (Chart 19), driven by Fed’s quantitative tightening (Chart 20). With money market rate being significantly above bank’s deposit rate, a slow burn on bank deposit could not be ruled out, especially as businesses may also draw their cash balance to fund their operation. Tighter liquidity and more expensive borrowing should also prevent activity in the private space from rebounding strongly, especially related to commercial real estate. Capital fundraising has fallen double-digit amid start-ups and managers not wanting to raise capital at a lower valuation, hence realizing the losses in their portfolio. On the public market side, tighter liquidity conditions should deflate the rich valuation of mega-cap tech stocks. For reference, NASDAQ composite index is currently trading at 3.2x sales (historical range: 1.5-3x) and EV/EBITDA of 14.4x (historical range: 6-13x).
The second biggest risk that has dominated the headlines is on commercial real estate, alongside other secondary effects from the crisis in U.S. regional banks. Offices remain the elephant in the room on commercial credit space, facing the brutal combination of high vacancy rate, declining rental price/sqft, and higher borrowing cost. The average bank’s exposure to office is estimated to be only around 10-15% of their loan books, which does not scream systemic given decent buffer from lower loan-to-value ratio compared to in GFC, although the distribution is uneven. The fear is that with access to credit becoming more difficult, weaker borrowers will be forced to default and banks selling the seized collaterals at a discount, driving valuation even lower.
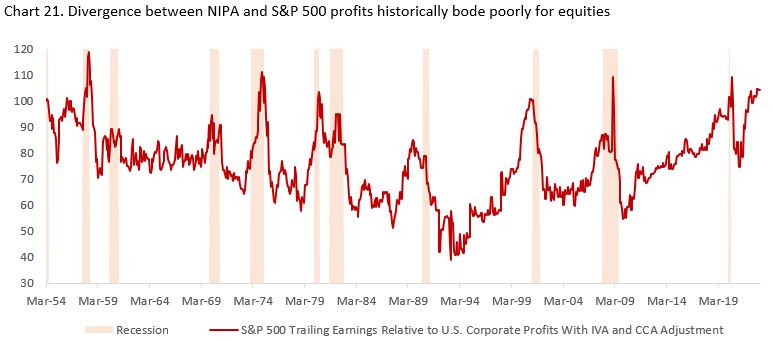
Our third worry is related to the accounting shenanigans commonly found during recession. The divergence between national income and product accounts (NIPA) profits and S&P 500 earnings has been widely discussed, with the latter potentially inflating the “true” earnings picture through various accounting methods. Chart 21 shows the ratio between S&P 500 trailing earnings relative to NIPA corporate profits in the U.S., rebased to 100 at March 1954. A rise of this ratio above the 100 level has historically coincided or followed by a recession, and by the end of Q4/22 the level is at 104.
There is no shortage of worries in our list, including the impact from 0DTE options and larger-than-normal retail participation in the equity market, potentially exacerbating market volatility during the downturn amid overcrowding in several retail favorite names. Geopolitics also list high on our list, with tension between China vs U.S. related to Taiwan and technology exports being the focus.
In short, our cautious view on the U.S. economy means we are much more constructive on bonds relative to U.S. equities.
