Green shoots in the economic data and the associated change in market narrative from hard landing six months ago to no landing currently have bolstered the performance of equities and pushed bond yields to near previous highs. January’s retail sales number shows consumers in the U.S. spent 3% more relative to in December, outpacing analysts’ forecast of 1.8% m/m growth. Moreover, initial jobless claims remain depressed and demand for lower-skilled service worker is still elevated, which point to the outlook for strong consumer spending ahead. The bulls argue that without a weaker labor market, consumer spending should remain firm – allowing the economy to chug along and recession to be avoided.
While the bulls’ argument sounds valid in a more normal business cycle, the current one is anything but. The Fed has raised 450 bps in less than a year and is set to hike couple more according to officials’ speech and the bond market, without even pausing to see whether enough tightening has been administered. It is analogous to a doctor wanting to bring down the blood pressure of a hypertensive patient quickly by overdosing him/her. First, similar to changes in policies, it took some time for a drug to work its way in the body. Second, the potential side effects of overdosing a patient could potentially lead to another problems. No doctor would administer greater dosage of drug by watching the patient’s blood pressure minute-by-minute, which is what the market and policymakers are doing today.
First, let’s talk about the elephant in the room: inflation. Headline CPI inflation has fallen to 6.3% from last August’s peak of 8.2%, helped by lower oil and natural gas prices, normalization of supply-chain, improving supply capacity, and slowing global demand of goods. Granted, the core PCE inflation number that the Fed pay more attention to has seen less improvement and is still at 4.71% in January, but this is also lower than 5.42% in February 2022. In our view, it is only natural that goods inflation normalized faster compared to services inflation – where labor accounts for greater share of the cost structure – but the later should eventually normalize as well as growth outlook worsen. In fact, Atlanta Fed wage growth tracker has seen wages moderating from 6.7% in mid-2022 to 6.1% in January despite the decline in unemployment rate and elevated job opening to vacancy ratio, and alternative data is showing further decline in wage demand (Chart 1).
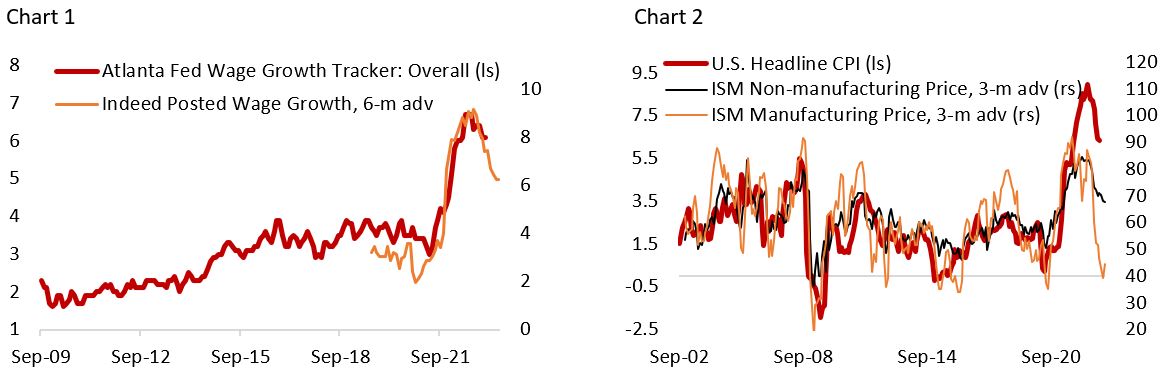
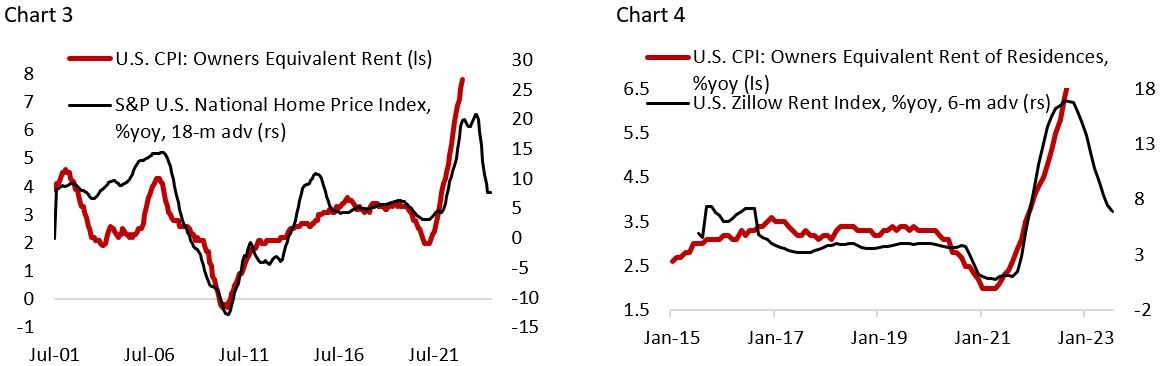
Encouragingly, ISM surveys continue to point to lower price pressure in the coming quarter for both U.S. manufacturing and service sector (Chart 2). In addition, we should also see shelter cost inflation rolling over in the coming months, following the decline in house prices and actual rental prices tracked by Zillow that have peaked in the Summer of 2022 (Chart 3 and Chart 4). We do not dispute that the path of the disinflationary process will be quite choppy and take many more quarters before reverting to Fed’s 2% target, especially if commodity prices start to rise on the back of Chinese economic reopening, but we expect weaker-than-expected growth outlook this year and potential blow up in the financial market to eventually force policymakers’ hand to take a more balanced view.
Historically, a tightening in monetary policy has been followed first by weakening in the more cyclical and rate-sensitive sectors of the economy, such as manufacturing and housing, before it eventually impacted consumer spending. In the paragraphs below, we outlined where we are today with respect to these three economic variables.
Chart 5 shows that the rise in 5-year yield has historically led the change in U.S. ISM manufacturing PMI and is currently pointing to a significant worsening in manufacturing activity for the rest of the year. This is in-line with our growth tax indicator – an average of the dollar, 10-year yield, and oil price, all standardized – that highlights headwinds for growth at least until the middle of this year (Chart 6).
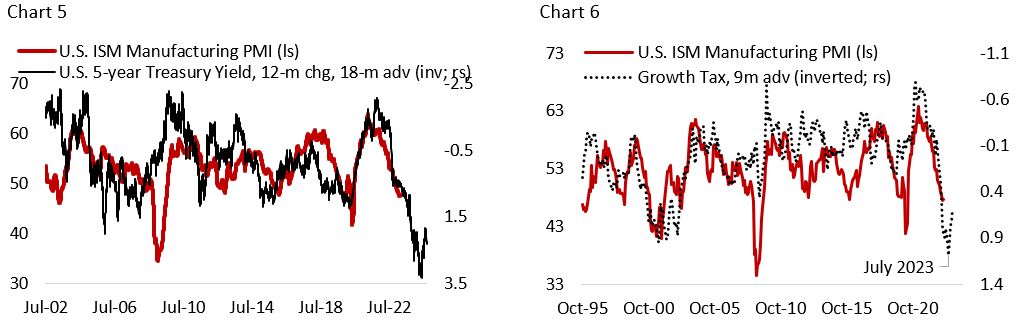
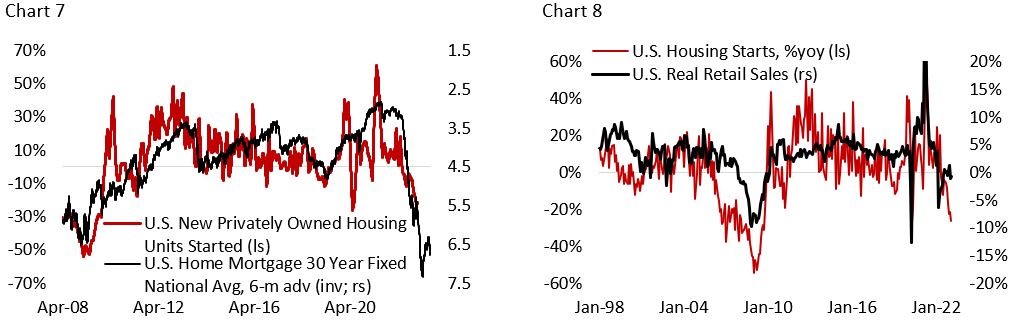
Meanwhile, housing sector activity has been slowing rapidly amid the spike in mortgage rates and continue to face significant headwinds (Chart 7), and the sector is unlikely to pick up anytime soon especially if we are right that unemployment rate will tick higher for the remainder of the year. Although construction activity will remain resilient in the coming year due to backlog of orders and large amount of housing under construction, housing starts should remain weak until yields are clearly trending lower and growth outlook accelerate.
With the cyclical and rate-sensitive sectors of the economy already showing significant weaknesses, this increases our conviction that consumer spending will take a hit sooner than later. Chart 8 shows that prior to the global financial crisis, housing starts were already weakening in H2/06 before retail sales turning negative in early 2008, a roughly 18-month lag between the rate-sensitive sector and the broader economy. Given that the monetary policy tightening is much faster and aggressive in the current cycle, we should see a shorter lag compared to during the GFC.
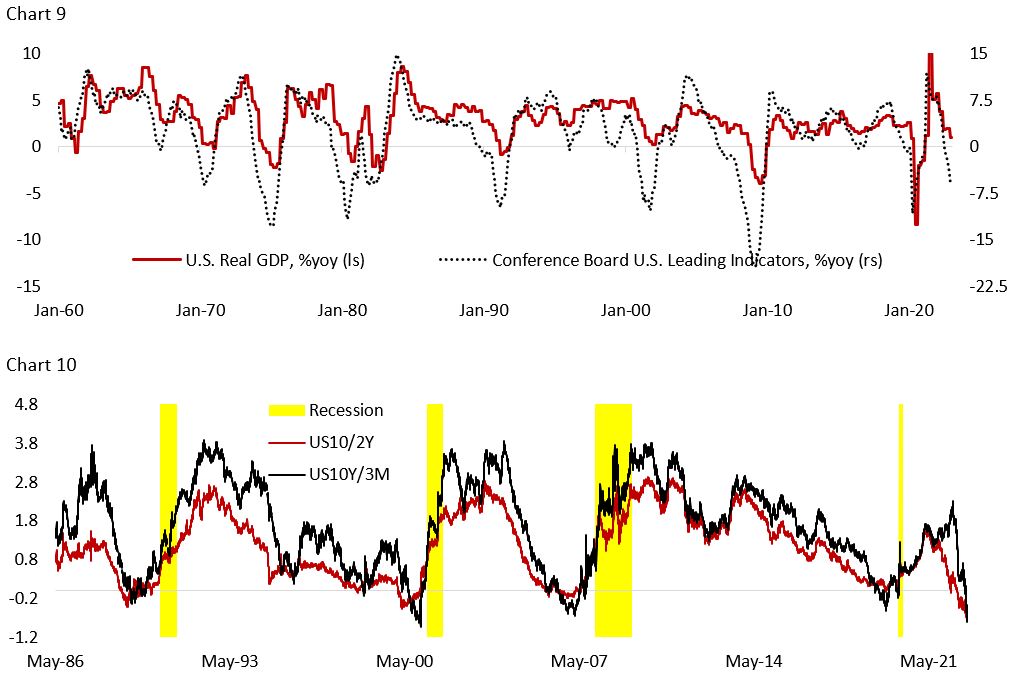
This means market focus will increasingly shift towards consumer in the coming months to see whether household spending is finally coming down. Anecdotally, managements from Walmart, Target, Home Depot, and Lowes have all been sounding more cautious on the outlook for consumer spending this year, citing slower discretionary goods sales. Meanwhile, leading indicators are contracting to levels that historically has been followed by recession (Chart 9) and yield curve inversion is reaching four decades low (Chart 10).
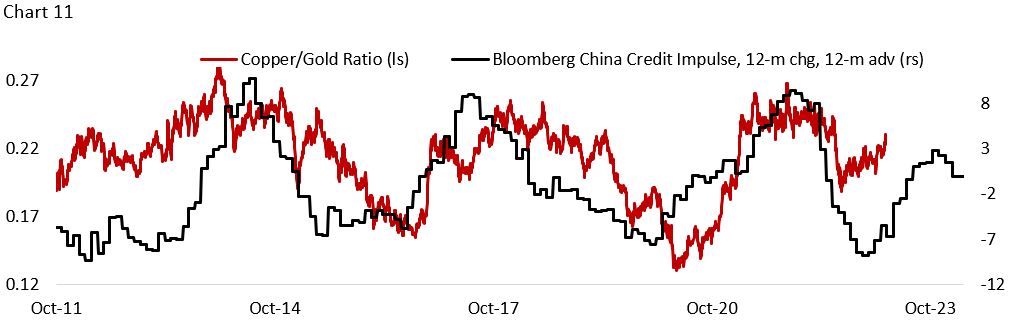
The good news for global growth in the coming months is that lower energy prices and Chinese economic reopening are bolstering European and Chinese manufacturing activity and consumer spending, which analyst hope could offset the weakness in U.S. economy. Investors need to be mindful of the potential for negative surprises from the war in Ukraine, and the probability that Chinese reflation effort could underwhelm this time around. China’s local governments are cash-strapped, and many provinces are citing difficulties meeting their debt burden due to the property crisis that impact their revenue from land sales. Chinese consumers have also received less government support compared to U.S. and European workers, alleviating the fear that economic reopening will trigger inflationary pressure much higher. So far, oil and base metal prices have not seen a significant upward pressure. Meanwhile, the tailwinds from fiscal stimulus and acceleration in credit impulse will likely dissipate closer to the end of the year (Chart 11).
Implication for Equities
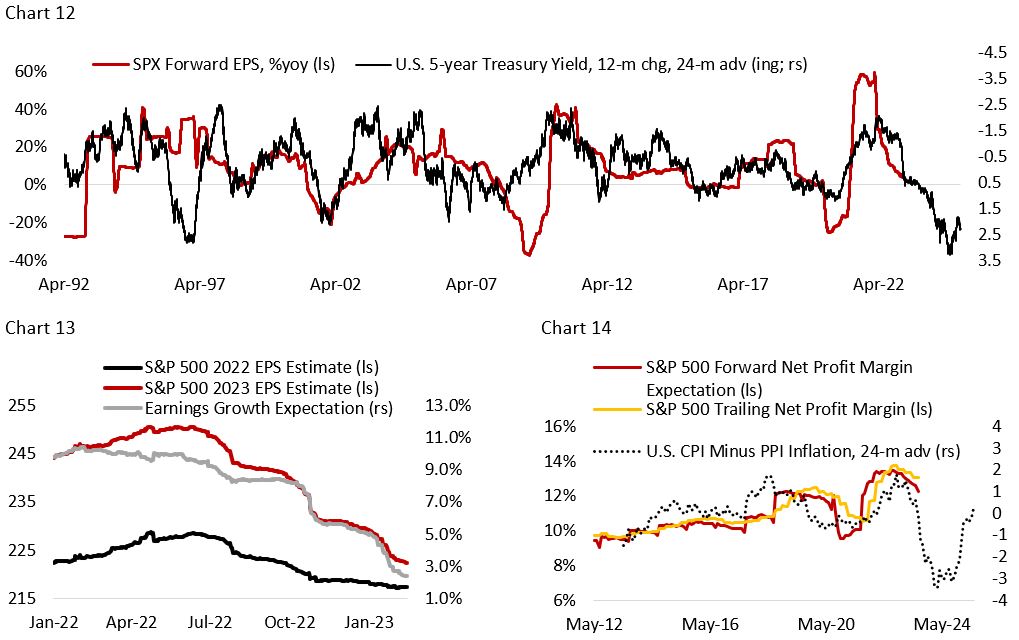
Our macro views prevent us from being more constructive on U.S. equities. Chart 12 highlights the risk to U.S. equity earnings this year. We have started to see analysts marking their Q1/23 and Q2/23 earnings estimate lower but increasing the Q3 and Q4 numbers as they expect margin to remain resilient (Chart 13). Our indicators are telling us otherwise. The differential between output and input cost is pointing much lower margin for the S&P 500 index (Chart 14).
Chart 12
We think the bear market rally is over, and U.S. equities can’t stand forward earnings multiple of 19x at a time when yields are still rising (Chart 15 and Chart 16). With the Fed being determined to shoot the economy twice in the head – just to make sure inflation won’t come back alive – it is difficult to see how multiple could trade sustainably above 16x, the historical average for S&P 500. Hard landing is the only outcome and bond yields should eventually move lower, probably rapidly once it becomes clear that the growth outlook is much worse than economists currently forecast.

Copyright © 2023, Putamen Capital. All rights reserved.
The information, recommendations, analysis and research materials presented in this document are provided for information purposes only and should not be considered or used as an offer or solicitation to sell or buy financial securities or other financial instruments or products, nor to constitute any advice or recommendation with respect to such securities, financial instruments or products. The text, images and other materials contained or displayed on any Putamen Capital products, services, reports, emails or website are proprietary to Putamen Capital and should not be circulated without the expressed authorization of Putamen Capital. Any use of graphs, text or other material from this report by the recipient must acknowledge Putamen Capital as the source and requires advance authorization. Putamen Capital relies on a variety of data providers for economic and financial market information. The data used in this publication may have been obtained from a variety of sources including Bloomberg, Macrobond, CEIC, Choice, MSCI, BofA Merrill Lynch and JP Morgan. The data used, or referred to, in this report are judged to be reliable, but Putamen Capital cannot be held responsible for the accuracy of data used herein.
