There is no doubt that the correction in risk assets has always been a great opportunity for long term investors to further accumulate equity exposure. Investors could boost their return by gearing towards equity every time stocks fell by over 20%. The question is, how far are we from the bottom in current market correction, and whether now is the time to scoop shares with both hands, given that analysts’ earnings estimate remains strong and valuation, although still above historical average, has moderated significantly from last year’s high. In this piece, we aim to answer the “What”, “Why”, and “How” of current risk assets correction: what has happened, why it happened, and how a portfolio construction should be to weather the current volatile environment.
Since the beginning of the year, we have taken a more bearish view towards equity, especially U.S. stocks, due to valuation concern, Fed tightening, and slowing growth outlook. We believed and continue to think that hawkish monetary policy will push up real yields and tighten financial condition – putting pressure on equity multiples – whereas slowing growth outlook and inflationary pressure will bode poorly for margin. Both factors largely explain the recent performances of equity sectors and styles:
- Cyclicals have led the correction whereas defensive sectors such as consumer staples and utilities have performed relatively well (Chart 1), which reflects market concerns that the Fed will have to send the economy towards recession to curb inflation. Moreover, certain subsectors of cyclical sectors, such as automobile, has been hit hard by the supply-chain bottleneck and the war in Ukraine. High-multiple growth stocks in consumer discretionary sectors that are highly sensitive to changes in long-term yields further weigh down the performance of cyclicals relative to defensives. As a result, capital has been migrating from cycle-sensitive sectors to lower-beta one, as will be discussed below.
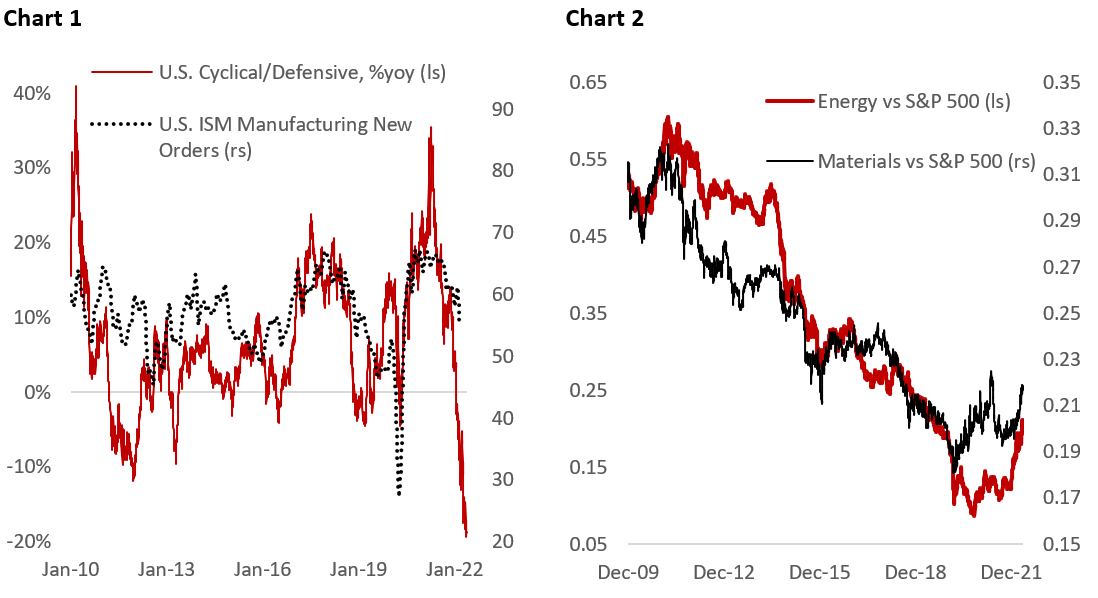
- Energy and materials remain our favorite sectors to hide, despite the deteriorating outlook for energy and base metal prices amid weakness in Chinese economy and downshift in U.S. and European growth (Chart 2). Both sectors’ high free cash flow yield assumes oil and base metal prices much lower than current spot price, and companies in these two sectors have taken advantage of the current price spike to deleverage their balance sheet and boost shareholders’ return. More importantly, investors are now acknowledging the importance of fossil fuel producers in global energy transition, a reversal of the trend is past decade where terminal value for oil producers was falling most of the time. Meanwhile, miners’ capital expenditure has not recovered to the high seen in 2011, and mining firms will likely continue to enjoy high base metal prices as growth in demand for base metals will exceed supply. Corrections in both sectors should provide an attractive entry point for investors to gain exposure, as both sectors are grossly underrepresented in the current benchmark weight.

- Valuation has also been an important driver in demarcating the size of correction across equity sectors. Generally, we are seeing valuation multiples coming down for most sectors as monetary condition tightens, with those starting with higher multiples at the beginning of the year suffering more. For instance, despite already significantly underperforming the benchmark, consumer discretionary and IT are still expensive, according to the cyclically adjusted P/E ratio (Chart 3 and 4). We see both sectors trading sideways before resuming their downward trajectory relative to the benchmark. On an index level, we are targeting S&P 500 to trade at 23x (CAPE), its historical average since early 1999 and 55th percentile, which would imply another 15% correction from current level (4030 at the time of writing).
The bottom line is that we expect risk assets to continue to drift downward in the coming months as the Fed hike policy rates by 50 bps in the coming two meetings, with forward P/E ratio for S&P 500 potentially falling to 16x from currently 18.5x, and earnings estimate to come down as growth slows. Already, we are seeing a flurry of downgrades from sell side analysts in the past two weeks.
Maintain Defensive Positioning While Watching for the Traffic Lights
Given that there is no material change in our investment thesis, we are maintaining our defensive positioning in our equity portfolio by overweighting low beta sectors and holding high cash balance. In terms of sector pecking order, we favor consumer staples, healthcare, utilities, energy, and materials, while underweight consumer discretionary, IT, financials, industrials, and communications.
The equity market is a leading indicator of economic growth and will rebound before the economy does, which makes it important for us to monitor signs of early improvement in macro environment, and a reversal in sector fund flows and performances. There are five big categories of indicators we currently monitor that often reverse at the bottom of equity market correction and are relevant to the current macro environment:
- 2-year yield and 10-year inflation breakeven rolling over (early signs): signs of peak Fed hawkishness and inflationary pressure moderating.
- Yield curve steepening and top in real yields (no): signs of the business cycle picking up and monetary conditions start to ease.
- Reversal in cyclical/defensive performance and fund flows; VVIX (no): market expectations that growth will start to improve; a top in VVIX embeds the expectation that volatility will come down. Chart 5 shows fund flows going into consumer discretionary versus staples are a decent confirmation (lagging) signal of the top and bottom of the broader index (see appendix for details).
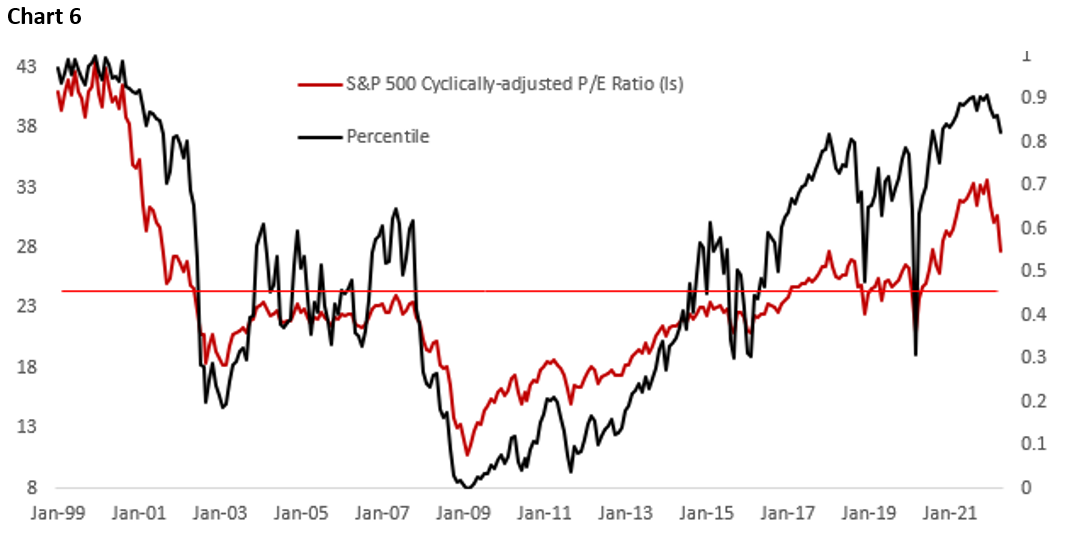
- Valuation percentile closer to 50th and discount from long-term average (not yet): valuation normally comes down to below 50th percentile and trade at a discount relative to long-term average during equity market bottom. This has been the case in 2015, 2018, and 2020 market correction (Chart 6).
- Top in high yield spread (no): indicator of stress in the corporate sector (Chart 7).
With only one out of five categories showing improvement, we believe the S&P 500 has not find its bottom just yet. We are expecting a pattern of lower high and lower low in the coming months for U.S. stocks.


Commodities, Bonds, and the Dollar
Lack of growth impetus in DM and EM economies means commodity prices will remain under pressure this quarter. China’s April industrial production (-2.9%yoy) and retail sales (-11.1% yoy) data highlight the weak domestic demand, although it probably marked the low this year, barring another strict lockdown of large cities (Beijing). However, the risk of prolonged economic slump in China could not be ruled out as the country insists on maintaining its zero-covid policy, which is unsustainable in the face of fast-spreading omicron variant, and the PBoC remains half-hearted in providing policy supports. We see copper-to-gold ratio breaking lower as global growth slows (Chart 8), and copper price to correct materially amid stronger dollar and easing supply/demand balance (Chart 9).
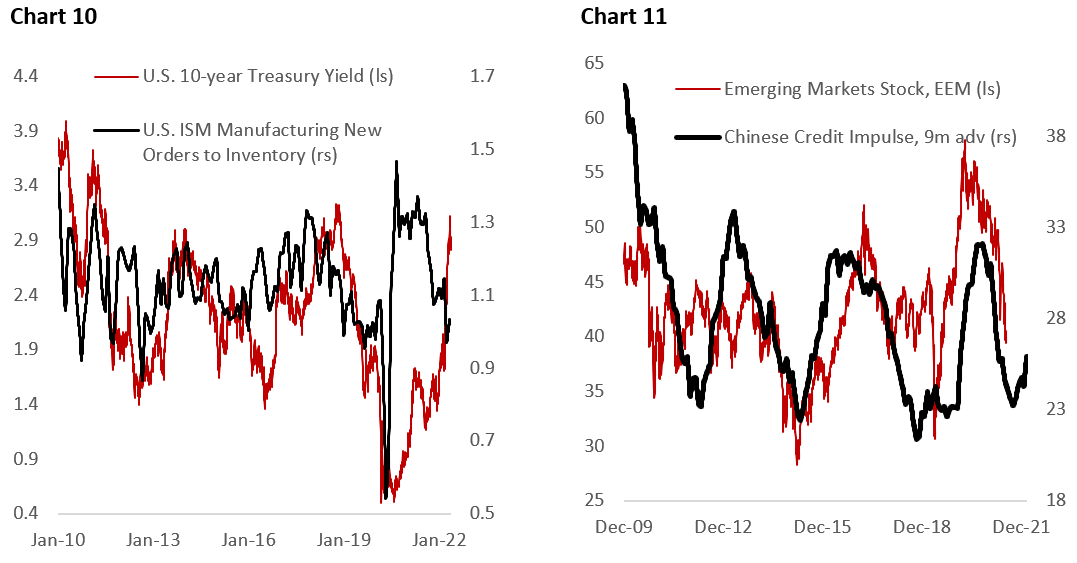
Meanwhile, U.S. Treasuries, trading at slightly below 3% level, are now very attractive from a cycle and valuation perspective. Inflation is showing some moderation in categories that are directly affected by the pandemic, and high base effect from last year means it has likely peaked in April. Following the planned 50 bps hike in the following two meetings, the Fed will likely take a more measured pace in tightening further (Chart 10). With QT ongoing, the risk of further riot in risk assets could not be ruled, which should benefit Treasuries.

Slowing growth and risk of environment also mean that the dollar will remain firm in the near term, at least until growth starts to accelerate and inflation is clearly turning down. EM, especially Latam, equities will be under pressure as commodity prices weaken (Chart 11). Moreover, high debt burden following the pandemic and elevated borrowing cost mean equity risk premium will remain high, although Latam central banks have front-loaded monetary tightening in advance of the Fed.
Copyright © 2022, Putamen Capital. All rights reserved.
The information, recommendations, analysis and research materials presented in this document are provided for information purposes only and should not be considered or used as an offer or solicitation to sell or buy financial securities or other financial instruments or products, nor to constitute any advice or recommendation with respect to such securities, financial instruments or products. The text, images and other materials contained or displayed on any Putamen Capital products, services, reports, emails or website are proprietary to Putamen Capital and should not be circulated without the expressed authorization of Putamen Capital. Any use of graphs, text or other material from this report by the recipient must acknowledge Putamen Capital as the source and requires advance authorization. Putamen Capital relies on a variety of data providers for economic and financial market information. The data used in this publication may have been obtained from a variety of sources including Bloomberg, Macrobond, CEIC, Choice, MSCI, BofA Merrill Lynch and JP Morgan. The data used, or referred to, in this report are judged to be reliable, but Putamen Capital cannot be held responsible for the accuracy of data used herein.
