Download PDF:
For the past several months we have ramped up our bearish view towards risk assets amid the unfavorable global macro and geopolitical backdrop. Central banks across the world are tightening aggressively as inflation spiked to decades’ high in many developed countries and over double digit in several developing economies, while fiscal boosts are turning into drags as governments, especially in EM, tighten their purse amid rising public debt burden. Tightening of monetary and fiscal policy are both headwinds for growth, which already past its peak in the U.S. and Europe and is likely in the process of bottoming in China.
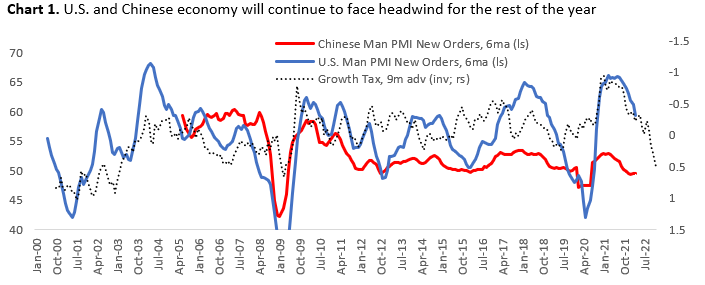
- In the U.S. and elsewhere, the spike in oil price, mortgage rate, and stronger dollar will start to be felt by households (Chart 1). It is estimated that before the pandemic the average U.S. households spend roughly 3% of their income for gasoline, a figure that has doubled since. On top of that, rising mortgage rate is also estimated to have increased housing-related expense 20-30% higher. Although employment has remained strong and wage growth is robust, this has not been enough to offset the increase in cost of living for most American. All these reduce discretionary spending on other categories.
- European countries are hit even harder due to its dependency on Russian for the bulk of its energy supply (Chart 2). Elevated gas and electricity prices mean energy cost is eating greater share of household’s income and manufacturing input cost. Anecdotal evidence shows that European firms are postponing their reshoring efforts amid high power prices and rising wages. With factories reducing its utilization rate, supply of many goods will be reduced, pushing prices higher.

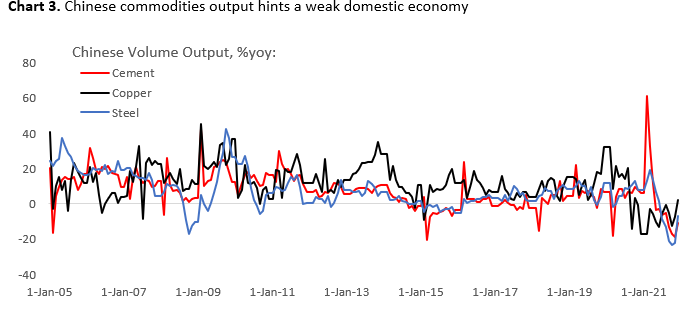
- China, the first economy to rebound from the pandemic slump, has already entered the downturn last year and is bottoming before being hit by another covid flare-up. Chinese cement and steel production contracted on the second half of 2021 as the country’s property sector undergo through a liquidity crisis (Chart 3). Worryingly, credit creation is still inadequate to lift growth – as highlighted by recent PMI data – despite Chinese authorities’ pledge to provide more support.
The bottom line is that the risk to global growth for the rest of the year is to the downside amid slowing U.S. and European growth, while the fate of Chinese reflation lies on the government’s ability to curb covid infection and willingness to ease its crackdown on highly levered sectors. The second half of this year may prove to be the most vulnerable period for equities amid earnings past its cyclical peak and continued central bank tightening.
Impact of Policy Rate Increase and QT
There are several ways central bank tightening could impact risk assets. As the Fed is now deemed to be behind the curve, it has committed to slam the break to curb inflation and aggregate demand by raising rates. To prevent currently high inflation turning into a wage-inflation spiral, arguably monetary policy has to be tighter than neutral, allowing inflation expectation back to Fed’s 2% target. Moreover, the Fed said it want financial condition to tighten further, a goal that could be achieved through higher volatility of risk assets and widening corporate spreads.
One indicator to watch to gauge the peak hawkishness of the Fed is the 10-year inflation breakeven rate. Fed will likely moderate its stance once inflation breakeven falls back to historical average, implying that monetary policy is sufficiently tight (Chart 4). By then, it is not unlikely that risk assets would have already sold off. A top in 10-year inflation breakeven would be provide a green light to upgrade equities to overweight.

The unwinding of Fed’s bond holding or QT also potentially drain liquidity in the financial system, increasing both corporate and bank borrowing cost. A normalization of bank’s balance sheet composition is consistent with real yield rising to 0.5% and S&P 500 trading at 14-16x forward earnings (Chart 5).

On the geopolitical front, the war in Ukraine still poses a fat tail risk to stocks and spread products as Russian aggressions and atrocities intensify, and the Western allies are responding by escalating sanctions severity and closing loopholes. Without removal of the sanctions – which is unlikely in our view – the risk/reward trade-off for ending the invasion is unattractive for the Russian government, making a quick resolution unlikely. QT potentially tighten offshore dollar liquidity and keep the dollar firm in the coming quarters.
Peak in Copper and Oil Price?
We have been bullish and remain so on energy and materials due to underinvestment in these sectors over the past decade, which results in supply-demand mismatch that could be resolved only through higher prices that is happening currently. However, we think oil and metal prices could face a correction in the near term amid slowing demand for growth-sensitive commodities and normalizing supply.
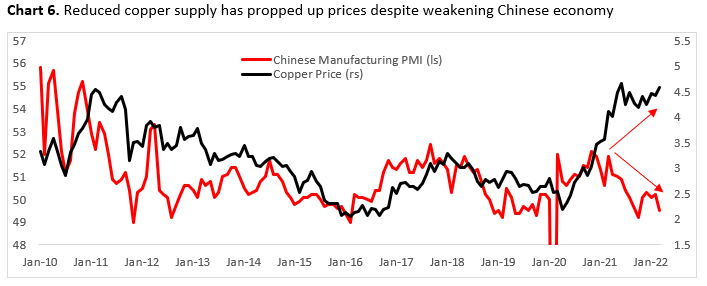
To be clear, supply of base metals, including copper, remain tight. But demand is probably past its peak for the current business cycle and given that many producers have built inventory in the past year – the reason prices remain resilient despite the significant slowdown in Chinese demand – the potential leg down could be harder than in previous correction. Chinese property sector, estimated to accounts for 10-15% of global refined copper demand, remains in crisis and house sales are weak (Chart 6). Meanwhile, oil stocks/oil price is trading at a level that historically marked the peak in price (Chart 7).

In addition, inventories of base metals have seen a build up despite the still very depressed levels, which are reflected in the normalization of 12-month vs 1-month futures prices. The red vertical lines in Chart 8 denote previous periods when those commodities are in a steep backwardation, which tend to be followed by correction in prices.

S&P 500 Sector: Few Places to Hide
Risk assets have corrected somewhat this year, but risk premiums are still low relative to historical averages amid the spike in Treasury yields, which provide thin buffer against tightening liquidity and slowing growth. In fact, at only 2.35%, ERP for S&P 500 has been higher 96% of the time since 2010. Although it is difficult to pinpoint the potential catalyst for correction in risk assets, it is not impossible that we will see the U.S. stock market grinding lower in the coming 12-18 months as companies shift their focus to protecting margin and balance sheet strength rather than shareholder’s return.
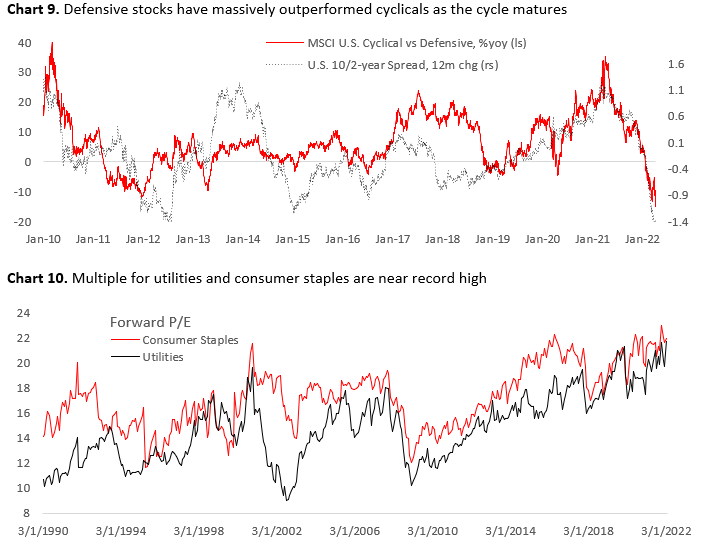
First, the sector rotation from cyclical to defensive is likely closer to the end than the beginning (Chart 9) with sectors such as utilities and consumer staples already bid up as highlighted by the strong inflows and outperformance. In fact, Chart 10 shows that forward earnings multiple for utilities and staples are at record high level.
Second, equity sectors valuation is expensive across the board with few places to hide. For example, 6 out of 11 S&P 500 sectors are at trading at its 75th percentile, with energy, materials, healthcare, and communication looking like a bargain on an absolute basis (Chart 11a). This strengthen our conviction that energy and materials are still our favorite sectors to hide, despite the softening growth outlook and potential correction for the underlying commodity prices. Chart 11b shows that on a relative to basis, energy, materials, healthcare, and communications are all trading at less than 25th percentile, followed by financials, consumer staples, industrials, and IT that are trading within 25th to 70th percentile. The former is should do relatively well should correction happens due to greater valuation buffer.

Lastly, profit margin, currently at record high levels, will also be difficult to sustain for many firms due to rising input cost and wages, on top of supply-chain disruption. Except for healthcare and energy, the rest of S&P 500 sectors’ net profit margin is above 85th percentile, making it more vulnerable to the shock from rising oil price, yields, and the dollar. Moreover, earnings growth expectation is high for discretionary and industrials, two sectors that are most sensitive to growth. Investors should watch for downgrades in their Q1 release.

The bottom line is that energy, materials, and healthcare remain attractive relative to the benchmark, while investors should watch for signs of peaking in the relative performance of utilities and staples – which we are still overweigh and have been bid of late (Chart 13). A top in 10-year yield could allow IT and discretionary to bounce back, but we think this would be the story for the second half of 2022.

Copyright © 2022, Putamen Capital. All rights reserved.
The information, recommendations, analysis and research materials presented in this document are provided for information purposes only and should not be considered or used as an offer or solicitation to sell or buy financial securities or other financial instruments or products, nor to constitute any advice or recommendation with respect to such securities, financial instruments or products. The text, images and other materials contained or displayed on any Putamen Capital products, services, reports, emails or website are proprietary to Putamen Capital and should not be circulated without the expressed authorization of Putamen Capital. Any use of graphs, text or other material from this report by the recipient must acknowledge Putamen Capital as the source and requires advance authorization. Putamen Capital relies on a variety of data providers for economic and financial market information. The data used in this publication may have been obtained from a variety of sources including Bloomberg, Macrobond, CEIC, Choice, MSCI, BofA Merrill Lynch and JP Morgan. The data used, or referred to, in this report are judged to be reliable, but Putamen Capital cannot be held responsible for the accuracy of data used herein.
