The price rally this year on tech and leading hot stocks have been phenomenal. Investors and sell-side analyst price target have been blown away by the stock performance, driven mostly by retail trader’s purchase, as could be seen from data provided by robintrack (https://robintrack.net/popularity_changes).
The website is a useful proxy for mania candidate and retail buying in the U.S. market. We acknowledged that to some extent the tech and discretionary stocks benefit from the pandemic (AMZN, NFLX, MSFT, etc.), but also believe that the significant number of retail purchase plays a more major role in driving prices to stratospheric level. AMZN does benefit from more online purchase during the lockdown (although cost is also rising), but it is hard to conceive that TSLA benefit from the pandemic with the closure of their plants and global vehicle sales barely recovered.
Table 1. Most popular stocks among retail traders

To us, the market is clearly driven by momentum buying, as higher prices attract more retail participation in a classic mania/Kindleberger pattern. It would only take prices to stop rising for these stocks for retail traders to shift their focus to other “opportunities”. And once the momentum stopped, it is very likely that price will start falling, fast. Of course, short selling is an art that few investors willing to participate in and takes a lot of nerves to be involved in. First, timing the top of a bubble is very difficult. Second, large daily spike in prices could trigger margin call or require reduction of capital at risk for hedge funds.
Nevertheless, we find the case for shorting TSLA stocks at the current level, from a technical and fundamental point of view. First, TSLA price has gone vertical in the last few week, which usually highlight the maximum effort and participation by traders. The contrarian logic is if every person who want to buy TSLA already bought it, then the price momentum will exhaust itself. The bull argues that index inclusion will force institutional buying of TSLA to track the S&P500 index, but this is not definite conclusion and the index committee likely will use discretion in determining if such volatile stocks is suitable for inclusion.
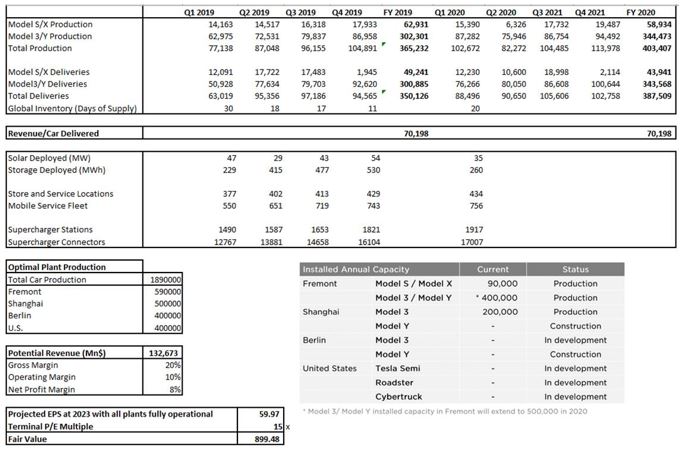
Second, we completed a financial model on TSLA based on a very generous assumption of revenue and margin up to 2023. Even during such bullish scenario, we found TSLA fair value significantly below current price, which gives us a margin of safety in shorting the stocks.
Currently TSLA only have operational factory in Fremont and Shanghai, with capacity of 690.000 cars/year. Assuming that all their current and plan factory capacity is fully operational in 2023 (1.89 million vehicle/year, a highly doubted scenario), and putting auto sector 8% profit margin, TSLA EPS will be about $60/share.
Multiplying the 2023 EPS projection with a generous terminal P/E multiple of 15x, this translates to a “fair value” for the stocks of $900/share, or roughly 40% below current price. It is also interesting to note that the previous “bubble” peak in TSLA is around $900, with their share price trading at $470 at the beginning of the year, which may better reflect the risk inherent in their businesses. Our point is that retail buying has drive valuation to a very lofty and unjustifiable figure even in the most bullish scenario, especially for hot stocks that does not actually benefit from the pandemic.
For now, we are holding our short position on TSLA and are eager to see their Q2 financial report released at market close.
Chart 1. TSLA stock price and number of robinhood user holding the stock
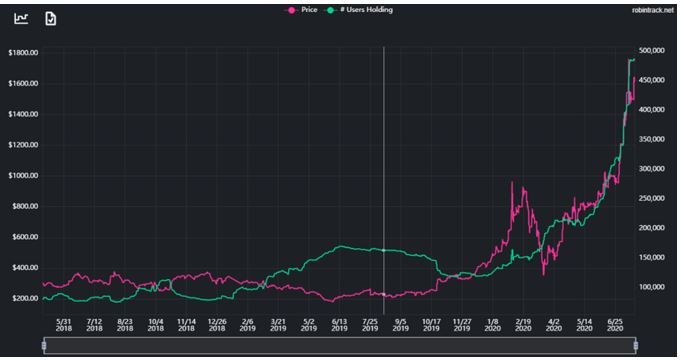
Chart 2. Snapshot of TSLA financial model
Copyright © 2020, Putamen Capital. All rights reserved. The information, recommendations, analysis and research materials presented in this document are provided for information purposes only and should not be considered or used as an offer or solicitation to sell or buy financial securities or other financial instruments or products, nor to constitute any advice or recommendation with respect to such securities, financial instruments or products. The text, images and other materials contained or displayed on any Putamen Capital products, services, reports, emails or website are proprietary to Putamen Capital and should not be circulated without the expressed authorization of Putamen Capital. Any use of graphs, text or other material from this report by the recipient must acknowledge Putamen Capital as the source and requires advance authorization. Putamen Capital relies on a variety of data providers for economic and financial market information. The data used, or referred to, in this report are judged to be reliable, but Putamen Capital cannot be held responsible for the accuracy of data used herein.
