The post–Cold War unipolar order is decisively over. What is replacing it is not a neatly balanced multipolar system governed by shared rules, but a far more unstable environment shaped by power, capacity, and self-interest. The escalation–de-escalation cycles that have characterized recent U.S. policies – across trades, immigrations, industrial strategies, and foreign interventions – are not temporary aberrations. The airstrike on Iranian nuclear facilities last June, the kidnapping of Nicolás Maduro from his palace in Caracas at the beginning of this year, and the assassination of Iranian leaders have highlighted how military and geopolitical power could shape the trajectory of another sovereign countries. This is a dangerous slide to a bigger conflict. Although we don’t have war between major powers, what we have in the Middle East today increasingly resembles a proxy war, with the U.S. backing Israel and Ukraine and Russia supporting Iran.
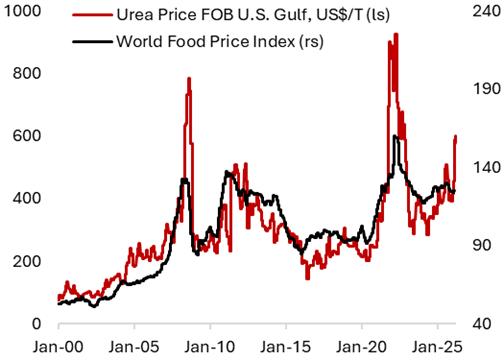
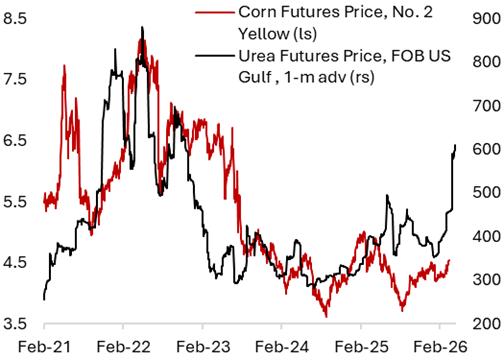
The impact of such actions not only affects the countries being targeted but also has ramification to the economic outlook of other countries that trade with them. For instance, 73% of oil imports by EM Asian countries pass through the Strait of Hormuz, including 40-70% of the supply for India, South Korea, and Thailand. The de facto blockade of the strait has large secondary and tertiary impacts for the global economy that are difficult to quantify today. It is likely that the conflict in Middle East will also translate to a fertilizer crisis due to most of urea production being co-located with natural gas. Given the importance of fertilizer in agriculture, this has implications for food prices around the world (Figure 1). Nitrogen fertilizer prices have risen sharply following the conflict in Middle East, which is a concern for corn producers preparing for the 2026 growing season. Since nitrogen fertilizer is a major input in corn production, rising costs can affect planting decisions, crop yields, and profit expectations across U.S. farms. For instance, soybeans require less nitrogen fertilizer compared to corn, which means farmers will likely plant less corn and more soybeans in the current season. Higher fertilizer costs may also lead some farmers to apply less fertilizer, which would lower crop yields. This, in turn, may support corn prices later in the season.
Figure 1. The Middle East conflict has indirect implications outside the energy sector
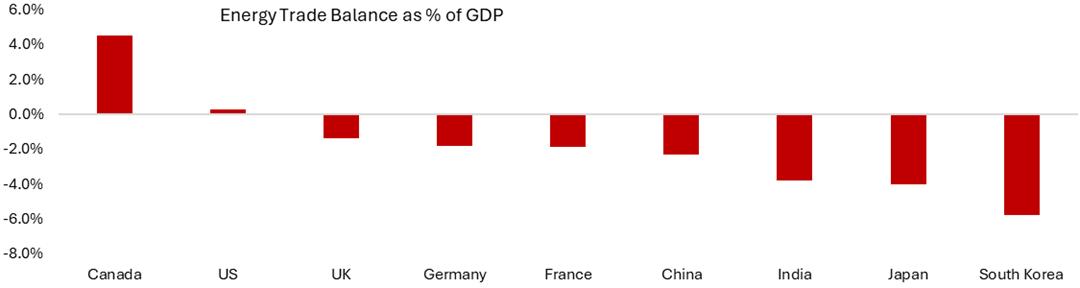
As net energy exporter countries, Canadian and the U.S. economy are less vulnerable to the spike in energy prices seen following the U.S. and Israel attack on Iran. This is in contrast to majority of Europe, Japan, and Emerging Market economies that run deficit with respect to their energy trade balance (Figure 2).
Figure 2. Canada and U.S. economy are less vulnerable to shock from higher energy prices
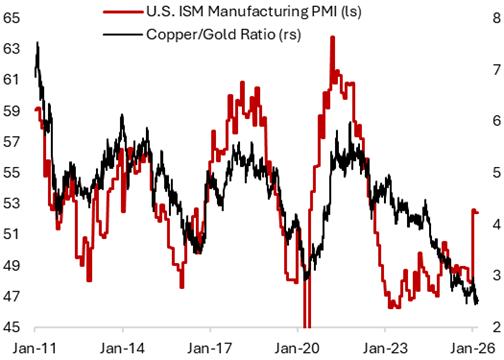
From an investment lens, the question is whether the conflict in Middle East will derail the ongoing cyclical upswing across the world (Figure 3). After three years of a slump in manufacturing activity, the outlook for cyclical sectors has improved this year. The ISM manufacturing activity entered expansionary territory in both January and February, and there has been sector rotation from asset-light businesses into asset-heavy businesses that are less susceptible from the AI disruption. If the cyclical acceleration continues, it is possible that we will also see rotation in the commodity sector from gold into base metals, including copper (Figure 4).
The spike in oil prices amounts to a stagflationary force, but there are reasons to be cautiously optimistic. First, fiscal policy is a tailwind for the U.S. economy in the first half of this year. Second, there is no systemic issues in the financial system – private equity and credit blowup unlikely to translate to a material risk for the regulated banking system. Third, the backdrop is very different from 2022 when the Federal Reserve was in a policy rate hike cycle, and the U.S. domestic economy was overheating amid fiscal stimulus and very strong job market.
Figure 3. Business cycle is potentially bottoming in Canada and U.S., following Japan and Europe’s lead
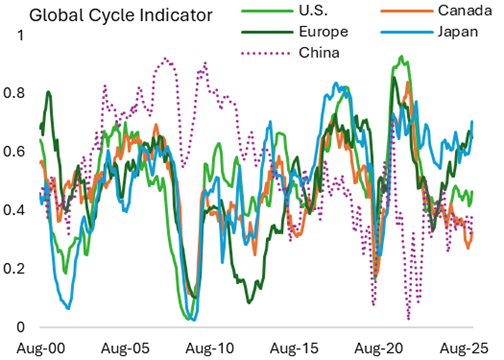
Figure 4. U.S. ISM manufacturing PMI is now in expansion territory, a reflection of accelerating cyclical sector activity
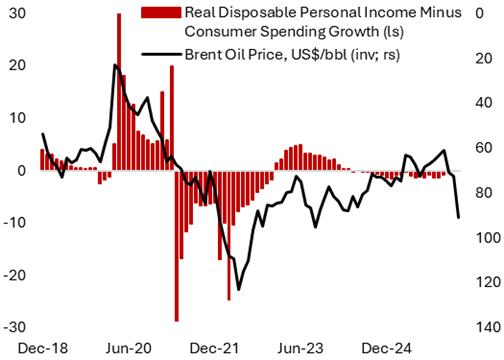
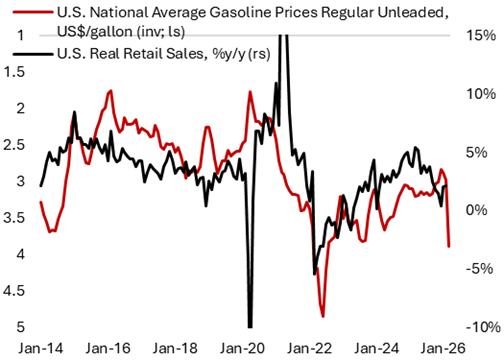
With that said, there are several transmission mechanisms of how higher oil prices affect broader economy, which creates winners and losers across sectors. Given that disposable personal income growth tends to be stable, spike in energy prices often force consumers to curtail their discretionary spending. Survey shows that spending on restaurants, travel, clothing, and electronics tends to be curtailed first during periods of increase in oil prices. Otherwise, consumers have to dip into their savings to sustain their living standard, which often translates to weaker consumer confidence (Figure 5). Higher oil prices also feed into the cost of goods manufacturing and services, raising their prices for consumers, which in response consume less of them – depressing sales in real terms and one of the reasons why non-EV car sales and air travel volume tend to be negatively correlated to the change in oil prices. This is especially true for lower-income households that spend more of their income on energy.
This is important given the context that momentum in U.S. consumer spending has been cooling, with real spending averaged only 0.1% m/m in November to January. The preliminary forecast for retail sales in February is pointing to a modest recovery in control group real sales at 0.2% m/m. Downside risks are also increasing amid the U.S. labor market looked sluggish in February. The ongoing conflict in the Middle East is already hitting sentiment, and real incomes will be dented in the near term due to strong inflation in March and April. The resiliency of the consumers in the U.S., and globally, are about to be tested in the coming months amid higher energy prices and increasingly K-shaped economy between the higher-income and lower-income households.
Figure 5. Higher oil prices are a headwind for consumer spending, especially on discretionary items
For investors, this transition away from unipolar order has profound implications. Capital allocation, asset pricing, and portfolio construction are being reshaped by geopolitics, fiscal realities, and supply-side constraints in ways that differ markedly from the disinflationary, globalization-driven regime of the 2010s. Concentration risk in equities has risen, diversification benefits of fixed income have weakened, and alternative strategies are re-emerging as strategic rather than tactical allocations.
If the first Trump presidency planted doubts about the durability of the U.S.-led global order, the second has largely extinguished them. The credibility of American commitments – whether to allies, institutions, or trade frameworks – has been weakened by policy volatility and the prioritization of short-term domestic objectives. With several years remaining in the current term, there is little reason to expect a meaningful reversal.
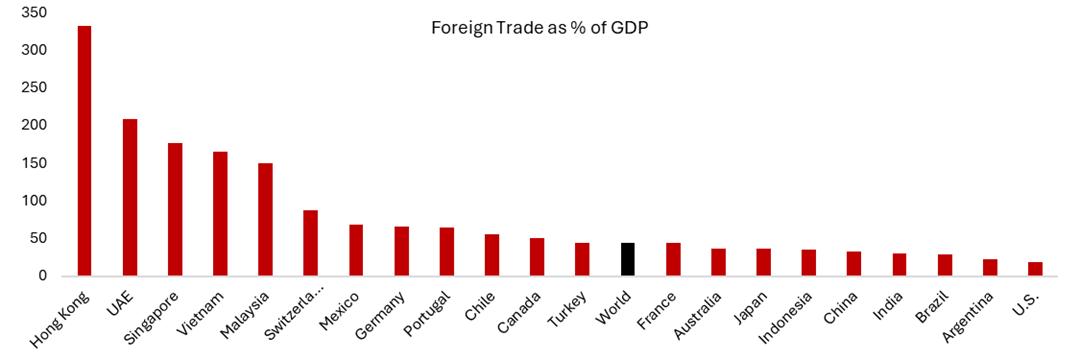
We are now entering a fractured, multipolar world order where power, not ideals, will shape and dictate trade and military relationships between countries. Governments across the world will have to start looking inward to boost their economy’s growth, invest and protect domestic industries, and become less reliant on the so called “global demand”. This is particularly important for small, open economies such as Hong Kong, UAE, Singapore, and Switzerland (Figure 6). These countries benefit enormously from global integration but lack the scale to insulate themselves from external shocks.
Figure 6. Small but open economies are most vulnerable from disruption in global orders
Singapore stands out as a case study in proactive adaptation. Its sovereign wealth funds—GIC and Temasek—have long invested in strategic sectors that cannot be easily replicated domestically, from global infrastructure to advanced technology. At the same time, Singapore maintains one of the highest levels of defense spending relative to GDP and compulsory military service, despite benign relations with its neighbors. This dual strategy – external diversification of assets combined with internal investment in security and resilience – offers a template for how small states navigate a harsher global environment.
The “law of the jungle” logic naturally leads to higher defense spending. The U.S. already accounts for the largest share of global military expenditure, yet President Trump’s proposals to increase the defense budget to USD 1.5 trillion by 2027 from $906 billion this year would mark a step-change. Importantly, this is not an isolated phenomenon.
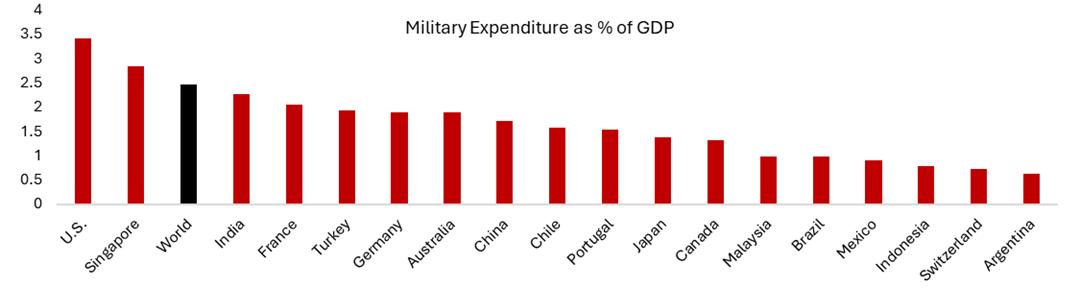
Across Europe, Asia, and the Middle East, governments are reassessing their military readiness. Defense spending, once politically contentious, is increasingly framed as an economic and industrial policy lever (Figure 7). From an investment perspective, this implies sustained demand for advanced manufacturing, aerospace, cybersecurity, and materials. Defense is no longer a niche sector—it is becoming a structural component of fiscal policy.
Figure 7. Law of the jungle means defense spending will have to increase across the world
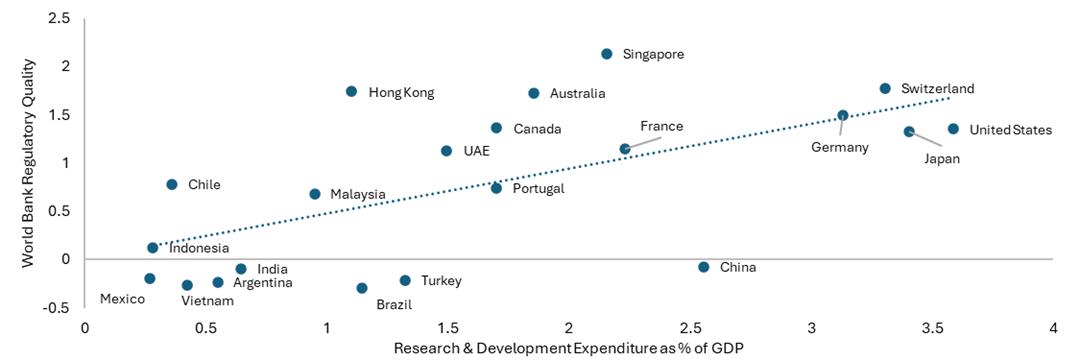
As we said earlier, more hostile external trade environment and breakdown of global orders mean governments have to look inward to sustain economic growth. Investments in R&D and productivity-enhancing tools and prudent regulation have the potential to develop domestic industries, especially in the service sector (Figure 8). Unfortunately, domestic political considerations have often translated to poor policies across developing countries. For example, governments in Indonesia, India, Brazil, Turkey, and China struggle with domestic political constraints that lead to suboptimal policy choices. In recent years, these have translated to varying issues ranging from protectionist policies that hinder productivity growth, undisciplined industrial policy that led to excesses in capacity, and wasteful spending that often result in inflation, capital flight, and currency depreciation.
Figure 8. Developing countries have to increasingly look inward to sustain economic growth
These governance challenges help explain the reason households and investors across emerging markets favor domestic real assets over financial ones. Land, property, gold, and foreign currency – ironically, especially the U.S. dollar – serve as stores of value in environments where rule of law and policy predictability are weak. But now, even the role of the latter as safe-haven assets is being questioned.
AI, the next arms race?
The global competitive frontier has shifted repeatedly over the past century—from agriculture to industrial manufacturing, from engineering to software. Today, it is centered on artificial intelligence. Yet unlike previous waves of digitization, AI is profoundly physical. Training and deploying large-scale AI systems requires vast quantities of advanced semiconductors and electricity. Producing those chips demands fabrication plants costing tens of billions of dollars. Powering them requires investment in generation, transmission, and grid stability. All of this, in turn, depends on raw materials: steel, copper, aluminum, rare earths, and specialized chemicals.
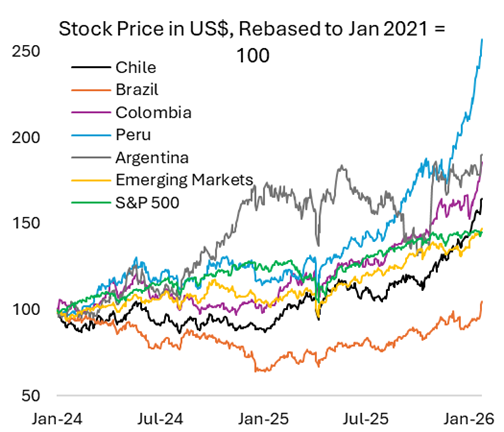
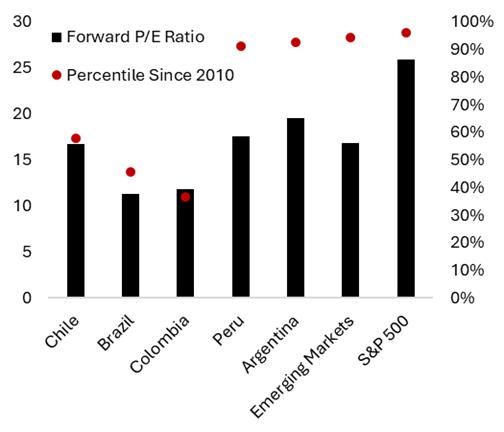
This supply-chain reality helps explain the recent surge in commodity prices. Demand has accelerated rapidly, while supply—constrained by years of underinvestment, regulatory hurdles, and geopolitical fragmentation—has struggled to respond. The implication is that commodities ex-oil is not experiencing a cyclical upswing alone, but a structural repricing driven by capital intensity and strategic stockpiling. Latin American countries with rich resources could potentially benefit amid the boom in base metals prices (Figure 9)
Figure 9. EM Latam countries have gained momentum amid commodity tailwind and several countries’ equity are still reasonably valued
One of the most underappreciated shifts in the current environment is that location matters again. In a world of frictionless trade, a ton of copper was a ton of copper. In today’s world, where supply routes can be disrupted and sanctions weaponized, physical proximity and political alignment matter.
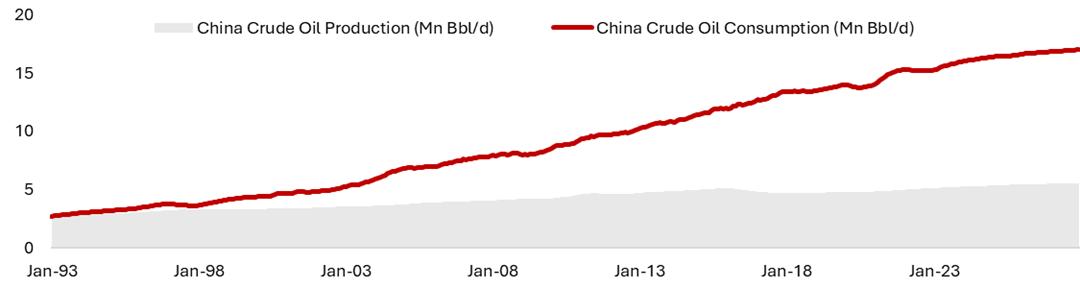
Major industrialized countries are increasingly stockpiling critical materials to hedge against supply disruptions. China offers a striking example. Highly dependent on crude oil imports—particularly from the Middle East – it remains vulnerable to potential blockades in the event of conflict (Figure 10). In response, Beijing has accelerated investment in renewables, nuclear energy, and strategic reserves. China’s accumulation of base metals is equally notable. Estimates suggest its strategic copper reserves now exceed 2 million tonnes, a dramatic increase from negligible levels two decades ago. Given global annual production of roughly 25 million tonnes, this stockpile is economically significant.
Figure 10. China is heavily reliant on crude oil imports, making it vulnerable to blockade
History provides a clear pattern: in periods of war, hyperinflation, or social unrest, capital seeks safety. In emerging markets, this often manifests as portfolio outflows, currency depreciation, and a surge in demand for hard assets. The 1990s crises in Mexico, Asia, and Russia; the European sovereign crisis; and the 2013 taper tantrum all followed this script. Traditionally, U.S. assets—and the dollar—benefited from these flows.
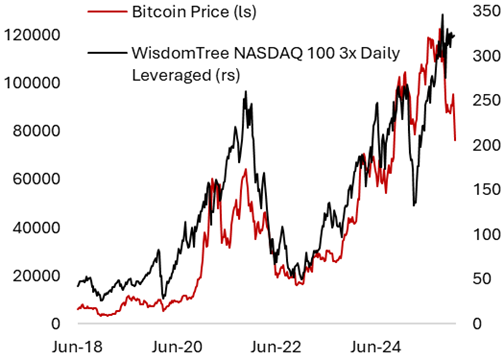
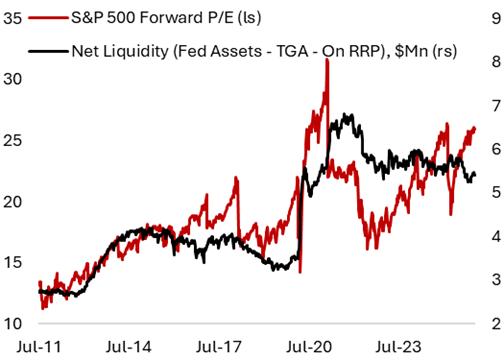
However, the question today is whether the U.S. can retain its unchallenged safe-haven status. While foreign central banks are unlikely to aggressively sell U.S. Treasuries, diversification away from dollar assets is ongoing (Figure 11). Gold has emerged as a key beneficiary, particularly amid concerns about central bank credibility and fiscal dominance. Cryptocurrencies, by contrast, have behaved less like inflation hedges and more like high-beta risk assets, closely tied to liquidity conditions rather than real purchasing power preservation (Figure 12).
Figure 11. Will the U.S. remain safe haven going forward?
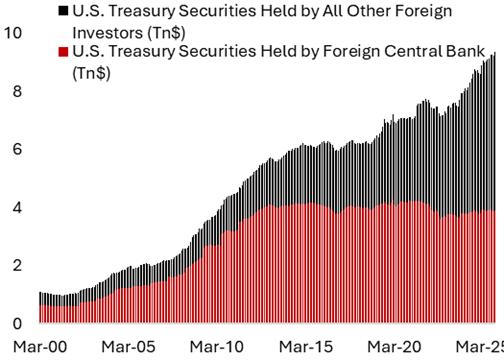
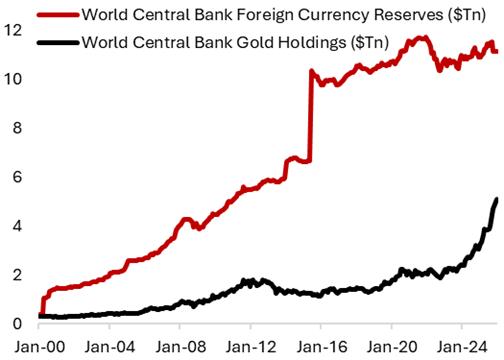
Figure 12. Bitcoin price is highly correlated to market and benefits from easing liquidity conditions
Countries that fail to adapt to this more hostile external environment will likely see higher social strain and political instability. Youth unemployment, housing affordability, and rising living costs have eroded confidence in incumbent governments. The resurgence of populist movements—both left and right—is a symptom of unmet expectations.
Recent unrest in Iran echoes broader historical patterns, from the Arab Spring to protests in Latin America and Europe. In advanced economies, dissatisfaction increasingly manifests through electoral volatility rather than street protests, but the underlying drivers are similar.
Policy responses aimed at affordability may provide short-term relief but risk distorting capital allocation if not carefully designed. Populist policies that prioritize electoral votes in the near-term risk becoming a boomerang down the road.
Market Pricing and The Canadian Perspective
Higher energy prices amid the conflict in Middle East have decisively shifted the path of monetary policy from easing to tightening globally. Prior to the conflict, the Federal Reserve was expected to cut policy rate by 50 bps this year while Bank of Canada was pricing in 50% probability of a 25-bps cut. Today, the market is pricing in 20% probability of a rate hike by the Federal Reserve and almost three 25 bps rate hikes in Canada (Figure 13). Similar trend could be seen in Europe and Britain.
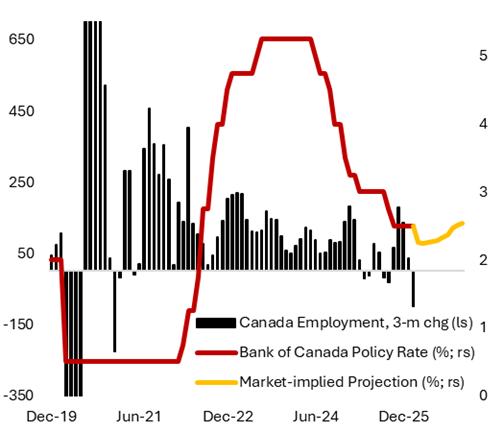
This is despite the contraction in Canadian employment in January and February, which together shed over 100.000 jobs, and decent trajectory of headline CPI inflation that grew 1.8%y/y (core inflation still at 2.3% y/y) in February – prior to the conflict in the Middle East (Figure 14). Economists expect Canadian economy to grow 1.2% this year, below the estimated trend growth of around 2%. Should the conflict in Iran become prolonged and oil prices stay higher for longer, this would complicate the job for BoC in balancing the need to control inflation while at the same time stimulate the domestic economy and employment.
Unemployment rate going up to 6.7% from 6.6% and consumer spending continuing to slow are both supportive of yields to trend lower. This, however, is offset by the impact of external shocks – higher oil prices – that will likely drive domestic inflation higher but also boost growth for Canadian energy sector. Unlike in 2022, when we have much stronger employment outlook and the economy was running hot, today the economy is running at or below trend, which translate to lower cushion for the outlook of Canadian economy and consumers.
Figure 13 Traders are now pricing-in rate hikes across G7 countries following the conflict in Middle East
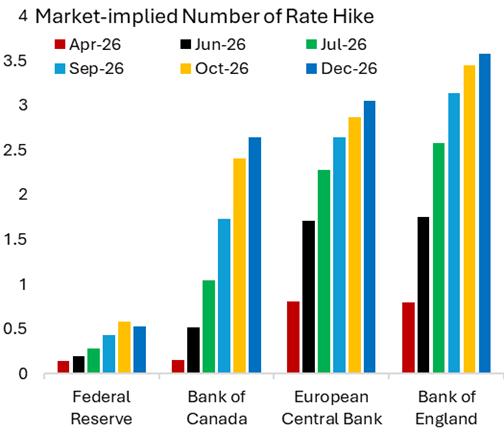
Figure 14. BoC is now expected to hike rates, despite weak Canadian employment and softer inflation trend prior to the conflict
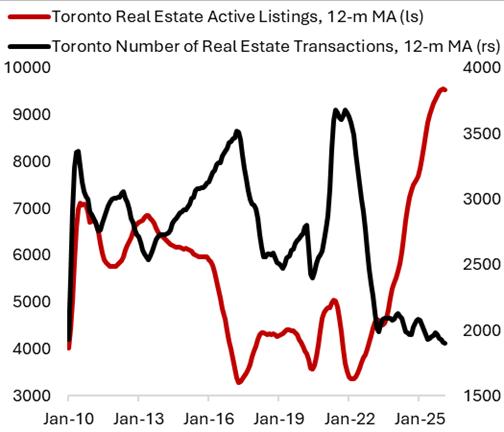
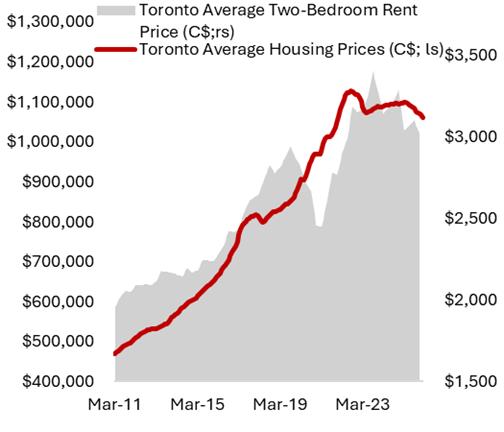
This has broader implications for the cyclical parts of the economy, including the housing market, through higher mortgage rate for borrowers and higher financing rate for homebuilders. In Toronto, for instance, volume of housing transactions is half of what it was in 2022, whereas the number of active listing is 2.8 times higher – highlighting buyers market (Figure 15). Meanwhile, rental price for a two-bedroom condo has fallen 11% in nominal terms from the peak in August 2023, which could partially be explained by the tightened immigration policy and increased supply of finished condo started in 2021-2022. With policy rate again set to increase and the Canadian economy growing below trend, the recovery of its housing market will likely be pushed back and more gradual.
Figure 15. Higher borrowing rate will push out the recovery of Canadian housing market
Investment Implications
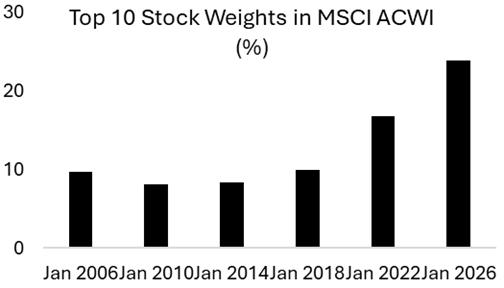
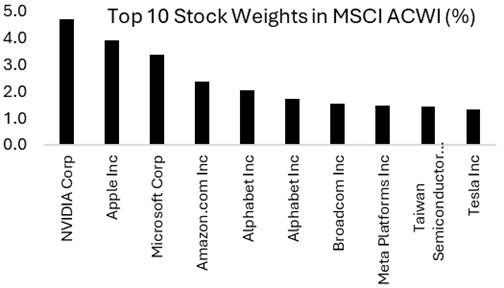
The traditional 60/40 portfolio faces structural challenges. Equity returns are increasingly concentrated in a narrow set of mega-cap stocks tied to the AI theme (Figure 16), while bonds have lost much of their diversification benefit due to elevated inflation volatility and rising term premium. In sum, the risks for equity and bond are higher today compared to the decade prior to the pandemic.
Figure 16. Concentration is rising for the global equity market, and all the mega-cap stocks’ outlook is tied to the AI theme
This environment favors:
- True active management over chasing momentum of growth stocks. Greater regional and sector diversification is the key, including to countries and industries that are underrepresented in the global equity benchmark.
- Real assets such as infrastructure and real estate with pricing power. Infrastructure, in particular, offers attractive characteristics: inflation linkage, high replacement costs, and strategic importance. In many cases, it may serve as a more effective stabilizer than long-duration bonds.
- Commodities have proven to be a ballast for a 60/40 portfolio post-pandemic, especially as it relates to a hedge against geopolitical risk. The spikes in oil prices, structural shift in gold demand, and long-term copper supply/demand dynamics have all point to the role of commodities in improving risk-return investment profile.
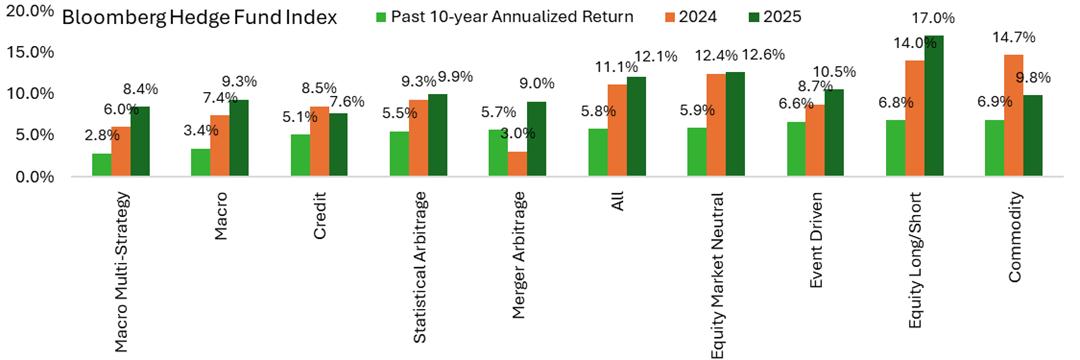
- Hedge funds, including multi-strategy mandates,have also seen a resurgence post-pandemic. Higher borrowing rates and wider dispersion of stock performance have translated to a fertile environment for active managers to harvest alpha, which shows in their performance in recent years (Figure 17).
Figure 17. Hedge funds have performed much better in 2024 and 2025 vs historical averages
The defining feature of the current era is not volatility per se, but uncertainty about the rules of the game. In such an environment, efficiency gives way to resilience, and diversification requires more than simple asset class labels.
Investors who adapt—by embracing active management, real assets, and global differentiation—can still generate attractive risk-adjusted returns. Those who rely on the assumptions of the past decade may find that the jungle has changed, and the old maps no longer apply.
Copyright © 2026, Putamen Capital. All rights reserved.
The information, recommendations, analysis and research materials presented in this document are provided for information purposes only and should not be considered or used as an offer or solicitation to sell or buy financial securities or other financial instruments or products, nor to constitute any advice or recommendation with respect to such securities, financial instruments or products. The text, images and other materials contained or displayed on any Putamen Capital products, services, reports, emails or website are proprietary to Putamen Capital and should not be circulated without the expressed authorization of Putamen Capital. Any use of graphs, text or other material from this report by the recipient must acknowledge Putamen Capital as the source and requires advance authorization. Putamen Capital relies on a variety of data providers for economic and financial market information. The data used in this publication may have been obtained from a variety of sources including Bloomberg, Macrobond, CEIC, Choice, MSCI, BofA Merrill Lynch and JP Morgan. The data used, or referred to, in this report are judged to be reliable, but Putamen Capital cannot be held responsible for the accuracy of data used herein.
