With less than three months to the end of the year, returns so far in 2024 is set to be among one of the best in recent years. The fear that the U.S. and global economy will go through a deeper slowdown amid the most aggressive monetary policy tightening in four decades has been quashed, and the chorus of bearish forecast for risk assets has been silenced as the U.S. stock market broke all-time-high levels. Indeed, the U.S. economy continues to grow at an above-trend rate and the labour market, although clearly softening, is not yet flashing a red light. Moreover, central bankers are confident that inflation will continue to move towards their respective target.
For investors, returns this year have been the mirror image of 2022, when both equity and bond prices fell amid aggressive policy rate hike. Monetary policy easing cycle, which have begun in June for Bank of Canada and European Central Bank, and just started last month for the Federal Reserve, have bolstered the performance of both global equities and bonds. The higher-for-longer mantra from earlier this year has now been replaced by moving lower faster as the market is pricing in a 25-bps rate cut in each of the coming 10 FOMC meeting (Chart 1), although many investors remain skeptical that the Fed will do so. However, after holding rate at 5.5% for thirteen months, the Fed started the first rate cut with a bang – lowering the Federal Funds Target Rate by 50 bps versus an expectation of 25 bps at the beginning of July. Following weaker-than-expected employment gains in July and August, policymakers at the Fed are becoming more worried about the downside risk to employment and growth. The good news is that lower rate will be a tailwind for the rebound in cyclical and housing sector.

Our cycle indicators (Chart 2) indicate that after stabilizing around trend (50th percentile) since autumn 2023, business cycle in the U.S., Canada, and Europe resumed its downward trend in the past quarter. In Europe and Canada, PMI is again relapsing as manufacturing activity stayed muted and service sector started to slow (Chart 3). Japan is the outlier where growth and the labour market remain strong, although the country’s inflation has also been declining. The relatively strong domestic Japanese economy vis-à-vis weaker rest of the world is the reason we are seeing monetary policy divergence between the Bank of Japan and other developed countries’ central bank – boosting the Japanese Yen performance.

Meanwhile, policymakers in the Middle Kingdom have started to unleash larger stimulus through the reduction of banks’ reserve requirement ratio, mortgage borrowing rate, and medium-term loan rate. The government is also recapitalizing banks which should boost credit creation going forward. While there have not been specifics on fiscal spending, China’s Ministry of Finance is planning to issue 2 trillion yuan ($284 billion or 1.6% of GDP) of special sovereign bonds this year to stimulate consumption and help local governments tackle debt problems (Chart 4), on top of the 1 trillion yuan pledged earlier this year. After two years of disappointment, the world’s second largest economy is potentially at a turning point.

Investors could expect elevated uncertainty and financial market volatility as we approach the U.S. presidential election on November 6th. Both the democratic and republican candidate have run on the promise of ignoring fiscal discipline, although fiscal deficit is expected to be larger under the latter. On the issue of taxation, who wins the election matters for the equity market as certain companies and sectors will see larger tax increase if statutory corporate tax rate rise. There are much to debate on each candidate’s view of the war in Ukraine and Middle East, but both is expected to maintain the current hawkish stance on China. Despite all the political noise, however, we think the financial market will likely continue to be highly focused to the upcoming release of U.S. labour market data.
There is a stark contrast today between the expectations embedded in the equity market and those implied by the bond market. Currently the U.S. stock market is pricing in around 13% earnings growth in 2025 – a very healthy rate given the current late cycle backdrop – and consensus expects the U.S. GDP to grow 1.7% in real terms. In sum, the pricing for U.S. equity market is heavily skewed towards soft landing. Meanwhile, the rate market is pricing in an aggressive rate cutting cycle that historically happened only in recession. The commodity market has also been weak of late amid weak Chinese economy and concerns on growth in the developed world, with oil and base metal prices falling over 30% from their recent highs.
There are reasons to believe that the U.S. economy will continue to glide on the path of soft landing. Chart 5 shows the progression of how macroeconomic indicators have evolved in the U.S. across various sectors. Utilizing all the monthly and quarterly data release, we tracked the changes in growth trajectory, employment, inflation, leading indicators, cyclical sector activity, consumer spending, housing sector, and credit growth. Each datapoint is transformed into percentile range since the earliest data availability or the beginning of 1990, with larger percentile denoting better performance. Compared to in the beginning of the year, most indicators have seen slight improvement, with actual price inflation seeing the largest positive change (currently at 40th percentile from 28th percentile in January 2024). Employment is the largest detractor, with actual/hard employment hard data moving to a still healthy 54th percentile from 58th percentile and the outlook for employment declined to 33rd percentile from 37th percentile.

Clearly, with the S&P 500 index up more than 25% y/y the market is pricing in a soft-landing scenario – comparable to in the 1995 rate-cutting cycle when the S&P 500 rose 23% y/y at the time of first Fed policy rate cut. Chart 6 and Table 1 compare how the U.S. economic data look like at the time of first Fed policy rate cut date. Comparing today’s situation to the previous four easing cycle, we divided these into two: the July 1995 and July 2019 cycle as a soft-landing scenario and the January 2001 and September 2007 cycle as recession scenario. Let’s dig into how today’s indicators compared to in the previous cycles: the good, the not so good/bad, and the bad:


The Good: Growth and Job Market
On the positive note, growth condition today is at a much better spot compared to the beginning of four previous monetary easing cycles. Our growth indicator currently stands at the 57th percentile, supported by the strong 3.0% q/q annualized GDP growth in Q2/24 and the Fed Dallas Weekly Economic Index at 2.34% (Chart 7). Given that both indicators are still above the 2% growth rate considered as trend, majority of economists and investors think the risk of recession is low.

The totality of data for employment is also in a relatively decent spot, better than during the July 1995 and September 2007 cycle, but very similar to during the January 2001 cycle (Table 1). Note that the 2001 easing cycle coincided with the burst of tech bubble and did end with a relatively shallow recession in the U.S. (see Appendix). Digging into the details, hard data on employment that includes actual job gains and job openings is at the 53rd percentile in the current and 2001 cycle, while soft data is around the 30th percentile and wage growth is around the 60th percentile. The cyclical sector is a tad stronger today, but the consumer and housing sector is in worse shape compared to the 2001 easing cycle.
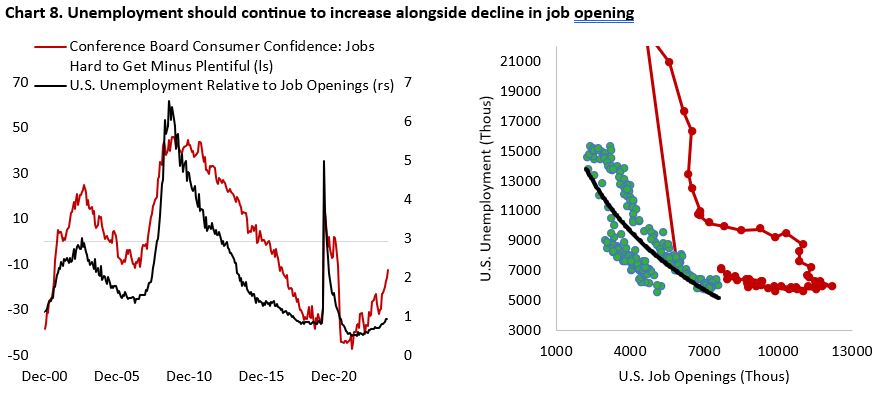
Given the historically leading properties of several soft data on employment, investors are highly attentive to the incoming data, including the monthly release of non-farm payrolls and weekly jobless claims. Conference Board survey highlights that the share of respondent saying jobs are hard to get has been rising sharply since the second quarter of 2024, which historically coincided with a rising trend in unemployment (Chart 8). This is corroborated by the U-6 (underemployment) measure of unemployment rate that continue to rose to 7.9% in August. Fortunately, initial and continuing jobless claims are still at a relatively low level today even as job openings fall.
The Not So Good/Bad (Cyclical sector, Housing Sector)
Compared to the past four rate-cutting cycle, score for the cyclical sector today is in between. As highlighted by Chart 5, the cyclical manufacturing and industrial sector has improved compared to earlier this year and should benefit from the tailwind of lower borrowing rate. Since the pandemic-associated lockdown, the manufacturing sector has experienced a drastic boom-bust cycle – starting with the shortages from supply-chain disruption during covid-19 pandemic to an overbuild of inventory, which have begun to unwind in the second half of 2023. If economic activity firm in China and across Europe, we could potentially see a stronger goods demand next year.
In the housing sector, we are looking for the market to thaw. The impacts of 550 bps policy rate hike and elevated property prices following the pandemic boom are clearly visible across our indicators (Chart 5). Unlike in September 2007, however, the housing sector is in better shape today (39th percentile vs 18th percentile in the Fall of 2007). Mortgage applications and housing transactions have fallen over 70% since the Fed started hiking policy rate in 2022, but house prices have been holding up. A resilient labour market should support the sector to rebound from its current weak condition.

The Bad (Survey & Leading Indicators, Consumer Sector, Credit)
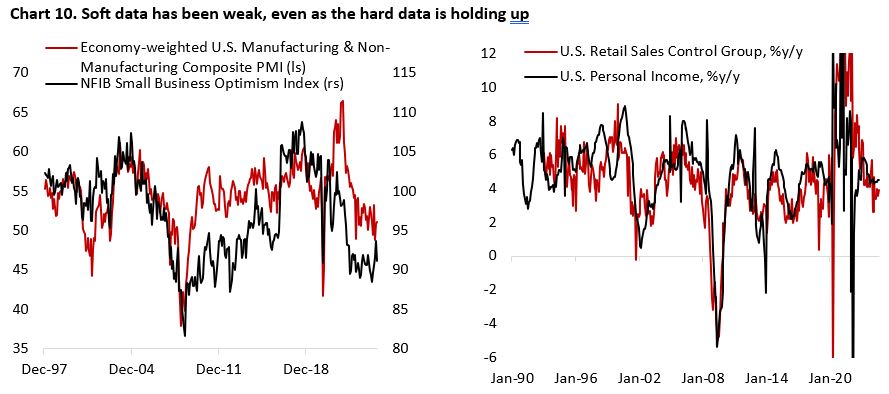
Among the list of worries plaguing the market today could be found among the survey and leading indicators, which have worsened significantly over the past two years even as the economy remained strong. The aggregate of leading indicators is currently at its 24th percentile, higher only compared to in the 2001 easing cycle. Chart 10 shows that the economy-weighted PMI is at 51.1 in August – the lower end of historical range – and NFIB business optimism is falling again.
The consumer sector, currently at the 34th percentile, is also notably weaker compared to all previous four rate cutting cycle – weighed down by slower retail spending on goods. However, services spending have been holding up, which supported personal consumption expenditure growth. With the Core PCE inflation running around 2%, nominal income growth at 5.9% and personal consumption growth at 5.2% imply consumer spending of around 3% – not far from Atlanta Fed GDPNow estimate.
Finally, credit growth has been particularly weak, with consumer credit growing only 1.9% y/y and C&I loan growth slightly negative. The ongoing monetary easing cycle should boost this metric going forward.
The bottom line is that so far growth has remained resilient and the job market, although softening, has yet to flash a warning sign. With policy rate cut underway and greater urgency by Chinese policymakers to reflate its economy, we expect the more cyclical manufacturing and housing sector to rebound in the coming quarters. However, a faster-than-expected deterioration in the U.S. labour market continue to pose a downside risk to the U.S. and global economy, which to an extend depends on the U.S. consumers to keep spending.

Copyright © 2024, Putamen Capital. All rights reserved.
The information, recommendations, analysis and research materials presented in this document are provided for information purposes only and should not be considered or used as an offer or solicitation to sell or buy financial securities or other financial instruments or products, nor to constitute any advice or recommendation with respect to such securities, financial instruments or products. The text, images and other materials contained or displayed on any Putamen Capital products, services, reports, emails or website are proprietary to Putamen Capital and should not be circulated without the expressed authorization of Putamen Capital. Any use of graphs, text or other material from this report by the recipient must acknowledge Putamen Capital as the source and requires advance authorization. Putamen Capital relies on a variety of data providers for economic and financial market information. The data used in this publication may have been obtained from a variety of sources including Bloomberg, Macrobond, CEIC, Choice, MSCI, BofA Merrill Lynch and JP Morgan. The data used, or referred to, in this report are judged to be reliable, but Putamen Capital cannot be held responsible for the accuracy of data used herein.
