The resurgence of the long end of the yield curve back to the high in October 2022 has puzzled many strategists and investors. Compared to last year when CPI inflation was at 8.3% y/y and the Fed was barely halfway through its monetary policy tightening cycle, CPI inflation today has fallen to 3.2% y/y (July) and the Fed’s next move is expected to be a cut, not a raise – the market is putting November rate hike probability at 32%. The backup in future interest rate expectations have been sharp, driven by the lowered probability of interest rate cut this year and in 2024 through the increase in real yield component. For instance, the Fed Funds Rate at the end of 2023 is expected to be at 5.44% today versus 4.18% in early April – 125 bps different.
Two main reasons attributed for the rise in long term yields are the renewed optimism on economic growth in the U.S., with consensus now putting a low probability of recession in the next 12 months, and the greater supply of treasuries amid burgeoning fiscal deficit and Fed’s quantitative tightening. Several strategists are also highlighting the impact of fewer demand of U.S. treasury purchase by foreign investors due to the tweak of BoJ’s yield curve control policy and PBoC’s efforts to ease its domestic policy while stabilizing the yuan.
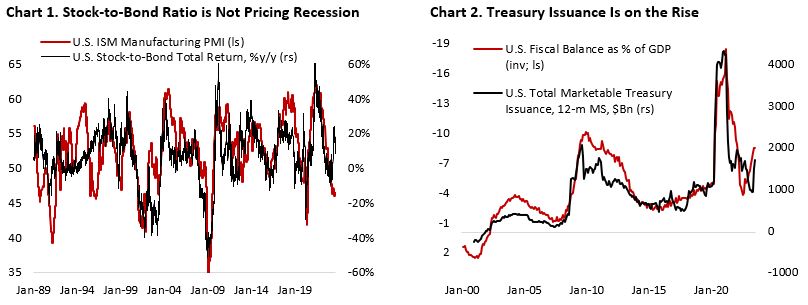
First, analysts point to the robust Q2/23 GDP growth (2.3% y/y) and tight labour market, expecting growth to remain robust in the coming year and support the higher for longer narrative echoed by several Fed officials. The backup in long term yields is also corroborated by the performance of equity market, where cyclical stocks have been outperforming defensive stocks between January and mid-July. Neither the equity market nor the bond market is pricing in recession – a sharp reversal compared to the beginning of the year (Chart 1).
Second, the widening U.S. fiscal deficit despite record-low unemployment rate is driving treasury issuance higher. This, and quantitative tightening by the Fed means it is no longer reinvesting $60bn of Treasury and $35bn of MBS every month, which translate to greater supply of treasury securities that needs to be absorbed by private market participants (Chart 2).
If fiscal deficit holds around 8% of GDP (~$1.7 Tn) and QT is maintained at $90 bn/month, we should be looking at $2.4-2.5 Tn of net treasury supply in the coming year. At around 10% of GDP, this is arguably bigger than the size private sector savings in the past. If we take 2010-2019 average fiscal deficit of 4% GDP and current account deficit of 2% GDP, and calculate private sector savings using the equation below:
S – I = C + (G-T) + (X-M)
Private Sector Savings (2010-2019) = S – I – C = Fiscal Deficit + Net Exports = 4% + (-2%) = 2% GDP
As of Q1/23, current account deficit is estimated at 3.3% GDP and Fiscal Deficit at 6.8% GDP. This implies private sector savings of 3.5% GDP, slightly higher than pre-pandemic average. Going back to the point that net treasury issuance for the next 12 months could be as big as 10% of GDP, this means either private sector savings have to increase materially in the coming year, or foreign investors will have to significantly increase their purchase. Both will probably keep yields high until the secondary impact of higher yield becomes unbearable for the real economy. Greater treasury purchase by the private sector should also absorb excess global liquidity in the market.
Third, the hedged yields of U.S. treasuries for many foreign investors are no longer attractive. For example, Japanese investors are facing much more expensive currency hedging cost (policy rate differential between the two central banks) and have the better domestic alternatives amid the rise in Japanese government bond yield, although the BoJ remains uncommitted to raise its policy rate and said that underlying inflation is still below 2%.
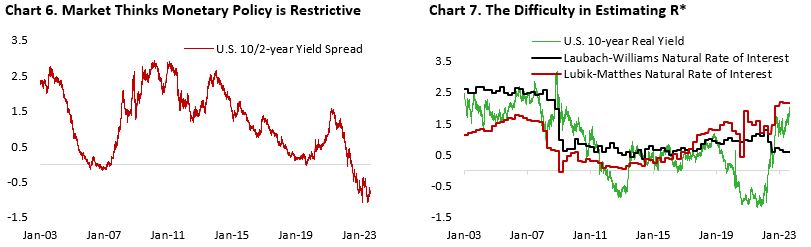
The resurgence of long-term yields increases the risk of the Fed overtightening monetary policy, which will weigh on growth and equity earnings with a lag (Chart 3). After all, economic expansions don’t die of old age, economists like to say; they are murdered by the Federal Reserve. The faster and higher rate hike administered in the current cycle increases the odds that the impact of policy tightening will come more abruptly, with hard data potentially deteriorating at an exponential speed, driven by the negative feedback loop between weaker employment, consumer spending, and corporate earnings. Our fear is that this time monetary and fiscal support will come late to the rescue and less forceful given concerns that inflation could flare again ala late 1970s.

In the meantime, stronger-than-expected growth data and stabilizing but above target inflation should keep the Fed maintaining its hawkish bias. But that is barely a reason to cheer for the equity market. Although sentiment has improved somewhat across the board and we are expecting a bottom in the manufacturing cycle this quarter, consumer sentiment remains weak and discretionary spending will continue to slow from here. Commentary this month from Target, Macy, Nordstrom, Gap, and Foot Locker, among other retailers, all highlight managements turning more cautious on demand and consumer delinquency.
Target: “Our Q2 financial results clearly demonstrate the agility of our team and the resilience of our business model, as we saw better-than-expected profitability in the face of softer-than-expected sales… At the same time, we continue to take a cautious approach to planning our business and have therefore adjusted our financial guidance in anticipation of continued near-term challenges on the topline.”
Macy’s: “In light of ongoing macroeconomic pressures and uncertainty on when those will abate, the company continues to take a cautious approach on the consumer.” Management also highlighted increased bad debt impact in credit card revenues is due to higher aged balances across all delinquency levels, with potential impacts from legislative ruling on limiting late fees.
Nordstrom: “We continue to see a cautious consumer and it remains to be seen how changes in inflation and higher interest rates will affect discretionary consumer spending in the second half of the year, particularly during the holiday season. We saw sequential top-line improvements in the second quarter. However, while it is early in the third quarter, sales trends have decelerated at both banners. We expect to make continued progress on our key priorities, which will help improve our profitability and mitigate inflationary cost pressures. Considering these factors, we are taking a cautious approach to planning. We maintain our outlook for the full year despite better-than-expected results in the first half.”
Gap: “Let me now provide some sales color and highlights by brand, starting with Old Navy. Net sales in the second quarter were $1.96 billion. Both net sales and comparable sales declined 6% versus last year. We’re pleased that Old Navy again modestly gained share in the quarter despite increased softness in the active category, as well as continued slower demand from the lower income consumer... Turning to Banana Republic, second quarter sales of $480 million declined 11% year-over-year. Comparable sales were down 8%. Revenue remains impacted in the short term as the brand laps an outsized benefit last year, driven by the dramatic shift in customer preferences.“
Foot Locker: “Looking back to March, when we outlined our Lace Up plan and our longer-term targets, we were coming off a strong holiday and had not yet seen the full weight of the macro environment on our lower income consumer. This became much more evident through the second quarter, including a weaker start to back-to-school… The same sales and promotional dynamics have continued into August, and as a result, we’ve lowered our sales and margin outlook for the year.”
In July and August newsletter, we argued that U.S. manufacturing activity may have bottomed this cycle and is likely to rebound from current depressed level. However, we expect services spending to slow and weigh the overall consumer spending for the remainder of the year. The problem is that U.S. stocks have front run these developments by a wide margin. Last month we wrote:
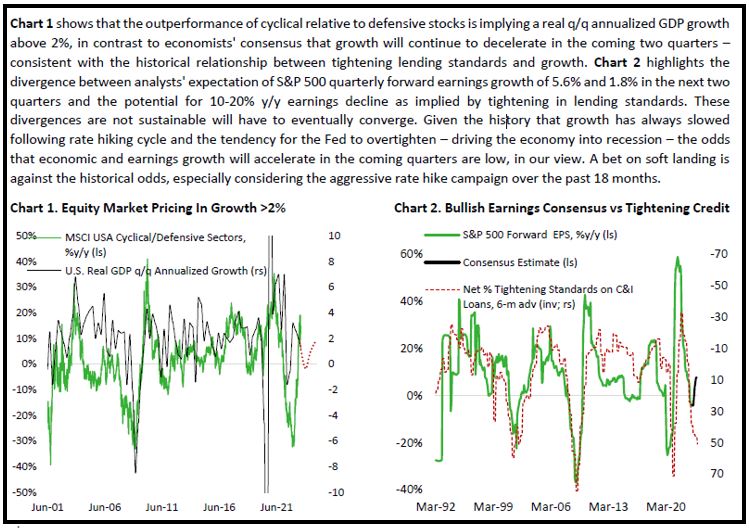
Since then, the equity market has shifted towards defensive footing amid higher yields (Chart 4 and 5), although this is driven more by fear that a too strong U.S. economy could force the Fed to deliver more rate hikes down the road – similar to what Bank of Canada did following a presumed “pause” in January. This is simply not a central bank’s reaction function that is supportive of a soft-landing scenario. Given our view that growth will continue to slow in Q3 and Q4 and unemployment rate potentially increasing to above 5% in the coming 2-3 quarters, we remain defensive in our equity allocation and believe that the reward of holding long-term bonds outweighs the risk of further potential rise in yields.
Assessing Consumers’ Financial Health
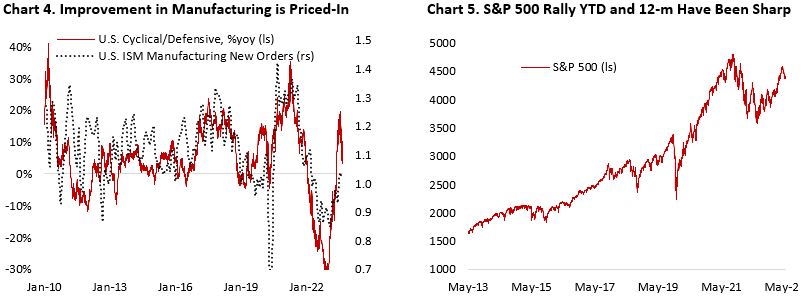
Fed Chairman Jay Powell repeatedly said in his remarks over the previous months that current monetary policy is restrictive. As outlined in June’s Summary of Economic Projection, the Fed believes neutral Fed Funds Rate, the rate that is neither stimulative nor restrictive for the economy, remains at 2.5%. This is also reflected in market participants’ expectation of lower interest rate in the longer run, hence the inverted yield curve (Chart 6). Another way is to look at the estimate of natural rate of interest, which is the real rate that is neither fuels nor restricts growth and inflation. However, estimating this variable is difficult and economists are lacking consensus, with current projection ranging from 0.5% to 2.2% (Chart 7). If the estimate by Laubach and Williams on r* is correct, then we should see rapid deceleration in growth and general macro conditions. But given the fact that U.S. GDP as of Q2/23 is still growing slightly above trend, is r* now much higher as estimated by Richmond Fed (Lubik-Matthes)? Or perhaps the lagged impact of monetary policy has yet to hit the real economy?
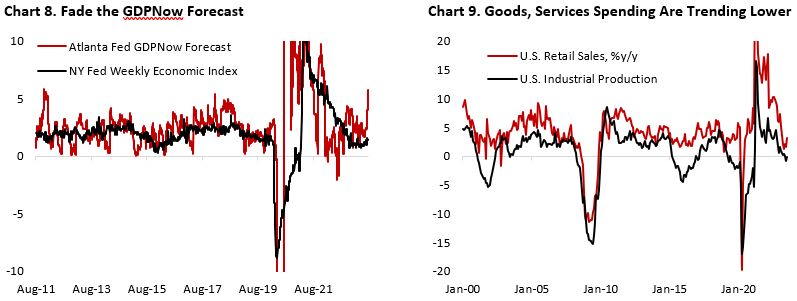
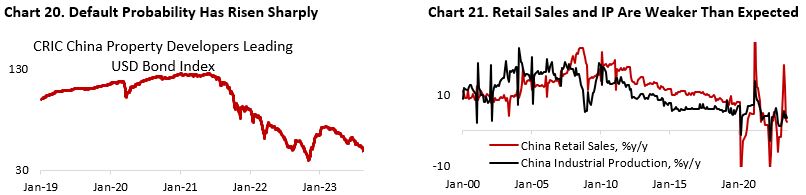
There are several reasons to be suspicious of the ultra-strong GDP estimate by Atlanta Fed that forecast annualized q/q growth of 6% for this quarter. First, the GDPNow forecast is highly volatile and tend to be revised with incoming release of economic data (Chart 8). Compared against New York Fed’s weekly economic index, which also track GDP growth on a real-time basis, the latter is more reliable and consistent in forecasting GDP growth. Although the index accelerated more recently amid the better-than-expected hard data, it remains below the historical trend of 2%. We are on the camp that think that the drag from higher rates is still ahead of us, given the historical 12-24 months lag between rate hike and slowing GDP growth, and believe growth will deteriorate. Chart 9 shows that industrial production growth is already contracting while retail sales are also trending down. The last leg down on consumer spending, which is highly dependent on consumer’s health, will determine whether the U.S. economy will fall into recession.
For households, the 30-year fixed mortgage structure in the U.S. means a slow burn rather than abrupt shock from the rise in the average effective mortgage rate, unlike in Canada or Australia where 5-year fixed mortgage term is more common (Chart 10). But this does not mean monetary policy is not effective in curbing consumer demand. The lower sensitivity of household debt service burden to rise in mortgage rate means the Fed have to raise interest rate even higher to quell consumer spending, punishing other sectors of the economy including the manufacturing and other rate-sensitive sectors. This could be seen in the contrast between very weak manufacturing activity and robust retail spending. Meanwhile, the recent acceleration in housing activity is driven primarily by a shift from existing home to new home sales amid low inventory in the former as consumers hesitate to take a new mortgage at current rate (Chart 11).

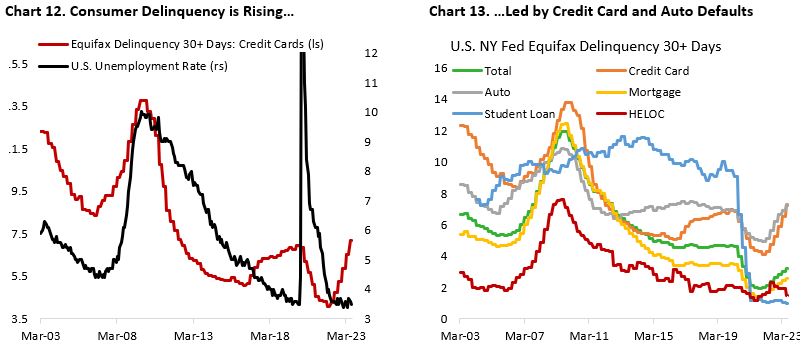
Despite the still low effective mortgage rate in the U.S., consumers’ credit delinquencies are on the rise too. Credit card and auto credit balances have been rising despite the much higher borrowing cost and their default rates are now above pre-pandemic level, which is concerning considering that the job market is still at a very tight condition (Chart 12). Historically, it is only about time before delinquencies in other parts of consumer credit to rise following the pickup in credit card and auto loan defaults (Chart 13).
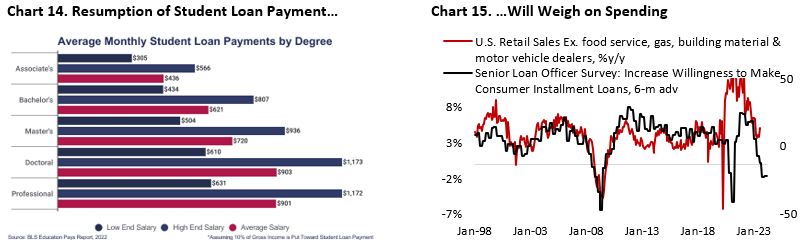
On top of this, the resumption of student loan repayment in October will further strain household finance. The average monthly student loan payment is estimated to be around $503, based on previously recorded average payments and median average salaries among college graduates, according to Student Data Initiative (Chart 14). It is inevitable for consumers to cut on discretionary spending to meet their bills (Chart 15).
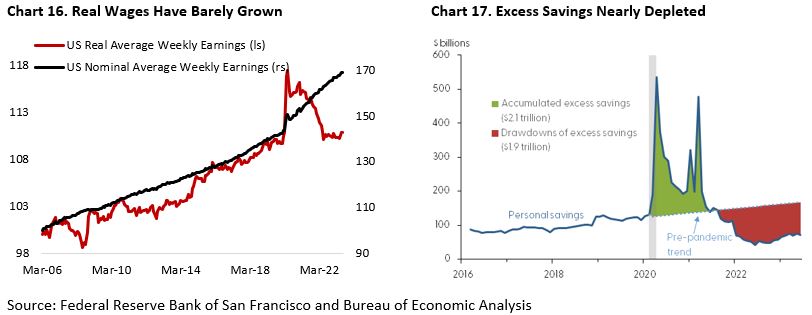
On the income and asset side, Chart 16 shows real wage has barely grown relative to pre-pandemic level despite the decline in inflation and strong nominal wage growth. Meanwhile, excess savings are estimated to have decline to $190 Bn in June from $2 Tn peak during the pandemic, according to Federal Reserve Bank of San Fransisco (Chart 17), and wage inflation is expected to continue to decline amid easing demand from the corporate side – both of which will put a lid on consumer spending.
Taken together, the rising consumer delinquency above pre-pandemic level despite tight labour market, higher credit card utilization despite spike in borrowing rate, additional debt service burden from resumption of student loan payment, slowing wage growth, and drain in excess savings all point to a potentially rude awakening for the average American in the coming months.
Crisis in the East
During the whole month of August, the bad news on China seems to be unstoppable. The liquidity and insolvency problem among Chinese property developers have been a drag on consumer sentiment, many of which put a chunk of their savings for a down payment of a house that have yet to be built and may never be built. At the same time, the decision to stop publishing its youth unemployment figure (21% in June) has instead intensified focus on the country’s malaise (Chart 18).
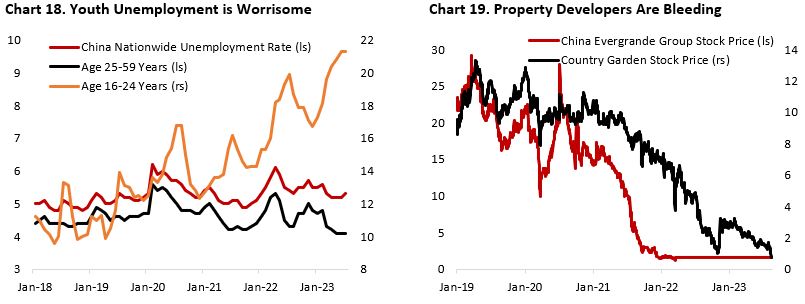
The plunge in Chinese property developers’ stock and bond price (Chart 19 and 20), Evergrande’s bankruptcy filing in New York court, and weaker-than-expected retail sales and industrial production data (Chart 21) all highlight the economy is spiraling into a deflationary slump. Without fiscal support to boost demand and improve the general sentiment, Chinese growth will likely miss the government target of around 5% this year.
So far, policymakers’ easing effort on the monetary front looks like a half-hearted effort (Chart 22), with less-than-expected interest rate cuts being delivered. This is probably out of concern that more aggressive rate cut could hurt its banking sector profitability and result in domestic financial instability. The recent issuance of provincial government bond worth CNY 1.5 Tn may provide near-term liquidity to help local governments servicing its debt. However, rather than solving the problem, this would only shift the burden from property developers and local government to provincial government. IMF estimated that local-government Financing Vehicles amount CNY 57 Tn ($7.8 Tn), a far larger sum that the support announced so far. More importantly, Chinese central government remains uncommitted in assuming the responsibility of its local government (Chart 23).

The greater risk for Chinese growth is that liquidity problem arising from property developers’ default could start reverberating to the household sector through the non-payment of wealth products in which many households invested their savings. Although direct investment of these trusts to the property sector is estimated to be only in single digit to low teens, the true exposure could be greater through investment in other categories that are exposed to the sector. The fact that many wealth products stopped paying investment income to its investors despite low stated exposure to the property sector highlights the severity of the issue. Consequently, consumer confidence and willingness to spend will remain low if the underlying problem – weak property sector activity and lackluster consumer demand – is unaddressed through greater fiscal support (Chart 24).
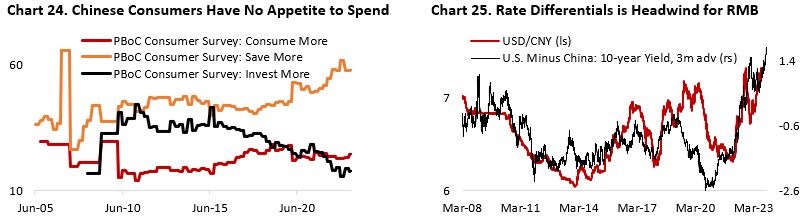
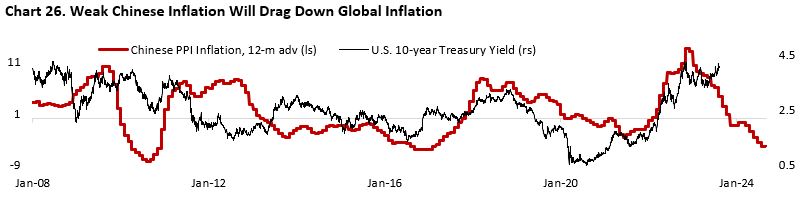
The contrast in macro condition between U.S. and China will continue to be a headwind for Chinese Yuan against the dollar (Chart 25). The better-than-expected growth and tight monetary policy in the U.S. will support yields at a high level, whereas weak Chinese growth and PBoC’s easing effort to reflate its economy will weigh on the yuan – potentially stoking policymakers’ fear of capital outflow. Weak Chinese growth and deflationary trend in Chinese PPI inflation should also cap the upside risk of U.S. treasury yields through downward price pressure on U.S. goods import prices (Chart 26).
Repricing The Cost of Capital
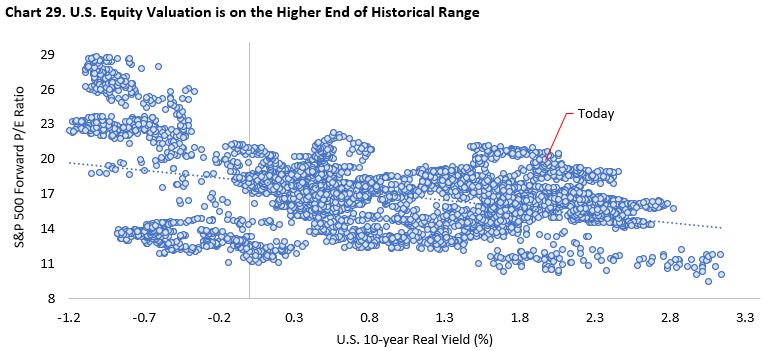
Given our negative view on U.S. consumers’ health and China’s deflationary tendency, we maintain our defensive positioning with overweight position in Treasury bonds and underweight equities and real assets. Despite recent pullback in U.S. stocks, we believe current valuation is nowhere close to fair value, let alone undervalued, at the index level. The rise in nominal bond yield to above 4% – more than a decade high – presents a very attractive opportunities for investors to lock in yields for the long term if investors could weather the near-term volatility (Chart 27). On the other hand, the rise in real yield this year has not been followed by derating in U.S. stocks amid the euphoria related to positive development on AI and equity investors underestimating the risk of recession in the next 12 months (Chart 28). Without decline in real yields, we think forward earnings multiple has to move closer to 16x before U.S. stocks turn attractive (Chart 29).

The rich valuation of U.S. assets, however, is not only concentrated in its equity benchmark (S&P 500). Both investment grade and high yield spreads are tight when compared to historical levels and considering the macro picture (Chart 30). On the positive note, U.S. corporates have front loaded their borrowing needs by locking rates at low level during the pandemic. This reduces the sensitivity of Fed’s monetary policy tightening and the impact to the corporate sector, similar to the mortgage rate lock-in for the household sector. Still, at 0.5 standard deviation below historical average, IG and HY spreads are not particularly attractive (Chart 31).
Lastly, on currency, we are positive on the dollar in the near term due to stronger U.S. growth vs rest of world and the more hawkish repricing of the yield curve relative to other global central banks. In addition, if we are right that the U.S. economy is on the brink of recession, flight to U.S. safe haven assets could provide a tailwind for the greenback.

Copyright © 2023, Putamen Capital. All rights reserved.
The information, recommendations, analysis and research materials presented in this document are provided for information purposes only and should not be considered or used as an offer or solicitation to sell or buy financial securities or other financial instruments or products, nor to constitute any advice or recommendation with respect to such securities, financial instruments or products. The text, images and other materials contained or displayed on any Putamen Capital products, services, reports, emails or website are proprietary to Putamen Capital and should not be circulated without the expressed authorization of Putamen Capital. Any use of graphs, text or other material from this report by the recipient must acknowledge Putamen Capital as the source and requires advance authorization. Putamen Capital relies on a variety of data providers for economic and financial market information. The data used in this publication may have been obtained from a variety of sources including Bloomberg, Macrobond, CEIC, Choice, MSCI, BofA Merrill Lynch and JP Morgan. The data used, or referred to, in this report are judged to be reliable, but Putamen Capital cannot be held responsible for the accuracy of data used herein.
