The combination of declining inflation and easing labor market condition has so far been interpreted by the market as signs that the U.S. economy will be able to stage a soft landing – a softening in growth without significant pick up in unemployment – before a new cycle begins. The equity market is disregarding the long and variable lag impact from monetary policy, betting that the labor market will loosen by just enough, and not more, to bring inflation down to Fed’s 2% target before stabilizing or tightening again.
Chart 1 shows that the outperformance of cyclical relative to defensive stocks is implying a real q/q annualized GDP growth above 2%, in contrast to economists’ consensus that growth will continue to decelerate in the coming two quarters – consistent with the historical relationship between tightening lending standards and growth. Chart 2 highlights the divergence between analysts’ expectation of S&P 500 quarterly forward earnings growth of 5.6% and 1.8% in the next two quarters and the potential for 10-20% y/y earnings decline as implied by tightening in lending standards. These divergences are not sustainable will have to eventually converge. Given the history that growth has always slowed following rate hiking cycle and the tendency for the Fed to overtighten – driving the economy into recession – the odds that economic and earnings growth will accelerate in the coming quarters are low, in our view. A bet on soft landing is against the historical odds, especially considering the aggressive rate hike campaign over the past 18 months.

Last month we explored the potential for a bottoming process in the U.S. manufacturing sector and highlighted the increasingly consensus view that the U.S. economy will avoid recession. The release of July’s ISM manufacturing PMI shows that the general sentiment did improve slightly, led by new orders, but the employment sub-component fell deeper into contraction at 44.4 from 48.1. Meanwhile, other labor market indicators continue to point to a softer U.S. labor market ahead:
- Job openings and quits rate continue to drift lower (Chart 3), with the latter signaling workers’ increasing reluctance to shop around for new jobs given that the premium between job switchers and stayers has narrowed significantly. Quits are back to pre-pandemic level, and average weekly hours worked is at the bottom end of historical range – highlighting employers’ preference to reduce hours per employee rather than doing outright layoff. Additional demand for workers has also soften due to the strong job gains observed so far this year. June JOLTS opening data reported vacancy of 9.58 Mn jobs, a decline from downwardly revised 9.62 Mn in May and below consensus of 9.70 Mn.
- Chart 4 highlights the faster decline in jobs vacancy by small and medium enterprises that has been hit harder by the tightening in lending standards. Note that SMEs’ demand for worker has been the primary contributor to the labor market imbalance seen today, with businesses employing 1-249 workers currently accounting for 76% of job vacancies. The third quarter Senior Loan Officer Surveys show banks are still on a defensive footing, with 50.8% of domestic banks tightening lending standards, higher than 46% in the previous quarter, 44.8% at the beginning of the year and 24.2% a year ago. Meanwhile, the share of banks increasing loan spreads increased from 12.1% in July 2022 to 68.3% in the current quarter. SMEs will increasingly feel the credit crunch in the coming months.
- The backdrop of slowing real growth, harder access and more expensive financing, and cooling but still elevated wage growth should translate to a continued deterioration in small business sentiment ahead. NFIB small business hiring plan has been drifting lower and is consistent with a sub-200k monthly job addition in non-farm payrolls going forward, while jobs categorized as temporary help – the first to be cut during economic downturn – are indicating contraction in non-farm payroll in the coming quarters (Chart 5). In addition, the historical relationship between tightening credit and change in unemployment rate is pointing to a 2%+ increase in the latter by the end of year (Chart 6). An unemployment rate of 5.5% in December 2023 is significantly above Fed’s projection of 4.0-4.7% rate in March’s Summary of Economic Projection and is not the soft landing many espouse today.

However, we have sympathy to the view that the U.S. economy may be entering a period of stabilizing/stronger cyclical sector – manufacturing and housing – even as the service sector expansion continuing to soften. New orders/inventory ratio is pointing to a bottom in the headline ISM manufacturing index, which has been aggressively priced in by the cyclical/defensive performance. Investors would do well to not chase the rally amid the lack of evidence that growth will accelerate in the coming two quarters. We are also skeptical on the narrative that the rise in housing activity will be sustained, given the elevated mortgage rate and cooling labor market. After all, housing starts and new home sales have been rolling over again.
Meanwhile, the service sector expansion continues to slow, as highlighted by July’s ISM service PMI falling to 52.7 from 53.9. Although new orders are only slightly lower (55 from 55.5 prior), employment fell to 50.7 from 53.1. This is consistent with other employment data discussed above that paint the picture of softening in labor demand to a more balanced condition. Consumer spending growth will likely decelerate faster in this second half as wage growth moderates, excess savings being drained, and student debt payment all reduce consumer spending power. Early signs of difficulty by consumers in servicing their debt obligation could be seen in the rise of credit card default rate from pandemic low.
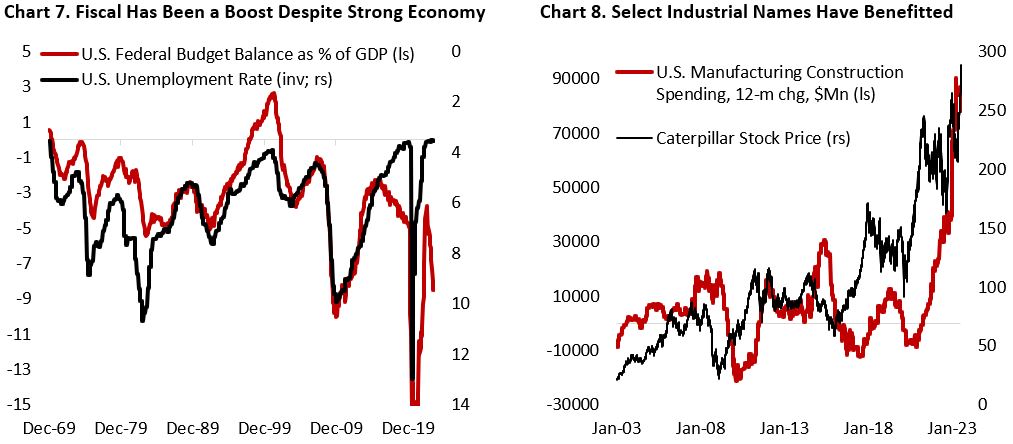
We remained in the camp that think the timeline for recession has been delayed, not canceled, due to the still deteriorating trajectory of macro data. However, we have underestimated the massive boost to the economy coming from various U.S. fiscal stimulus. Chart 7 shows that U.S. fiscal deficit has widened to a massive 8% of GDP, at a time when growth is above potential and the labor market being tight. The reshoring of manufacturing supply-chain, incentive for chipmakers to build factories in the U.S., and President Biden’s program to rejuvenate infrastructure building have all been a tailwind for the construction and heavy machinery sub-industry – countering the general weakness in industrial stocks (Chart 8)
On equity, the aggregate forward EPS for the S&P 500 remained flat at $218 – the same level at the beginning of January – which means the YTD rally could be explained by valuation expansion alone (S&P 500: 20x forward earnings). Although the spread between CPI and PPI inflation is pointing to an expansion in margin next year, it is still facing near-term headwinds (Chart 9). This is supported by our main reason to stick to our bearish view on U.S. stocks, which is the anticipated lag effect from monetary tightening over the past 18 months (Chart 10). Rather than the single-digit growth expected by consensus in the coming two quarters (Chart 2), we are expecting further contraction in earnings.

Given that the decline in earnings have been more than offset by multiple expansion, the question then turns into what has been driving multiple higher? First, there is the hype surrounding potential application of AI that has led to a surge in mega-cap tech stocks. Second, Fed’s borrowing facility program following the regional banking crisis in March is injecting liquidity to the market, although this has not been a contributor since May (Chart 11). Third, the unwinding of bearish positioning by hedge fund and active managers as the index crawl higher has extended the rebound in stocks.
Now that the S&P 500 is trading at 20x forward earnings, how much further could it go? We think at this level the market is priced for perfection and vulnerable to negative surprises. The catalyst could come from various front: 1) higher-than-expected borrowing need by U.S. Federal government and rebuilding of Treasury General Account (Chart 11), 2) the rise in long-end yield amid BOJ’s marginal shift towards normalizing monetary policy and implications from U.S. government rating downgrade, 3) Tighter financial conditions from ongoing quantitative tightening (Chart 12). It is difficult to predict the trigger point for the latter, but we know that at some point tighter lending standard and more expensive borrowing rate will choke businesses looking to refinance their debt obligation. As in the previous QT cycle, the repo market should be one of the first market to signal that liquidity has been overly tight.

In addition, whereas positioning was at an extreme bearish level last October, the reverse is true currently. Asset managers have boosted their equity allocation and retail investors are euphoric – both contrarian indicators for short-term returns in the coming months (Chart 13).

Copyright © 2023, Putamen Capital. All rights reserved.
The information, recommendations, analysis and research materials presented in this document are provided for information purposes only and should not be considered or used as an offer or solicitation to sell or buy financial securities or other financial instruments or products, nor to constitute any advice or recommendation with respect to such securities, financial instruments or products. The text, images and other materials contained or displayed on any Putamen Capital products, services, reports, emails or website are proprietary to Putamen Capital and should not be circulated without the expressed authorization of Putamen Capital. Any use of graphs, text or other material from this report by the recipient must acknowledge Putamen Capital as the source and requires advance authorization. Putamen Capital relies on a variety of data providers for economic and financial market information. The data used in this publication may have been obtained from a variety of sources including Bloomberg, Macrobond, CEIC, Choice, MSCI, BofA Merrill Lynch and JP Morgan. The data used, or referred to, in this report are judged to be reliable, but Putamen Capital cannot be held responsible for the accuracy of data used herein.
