One valuable suggestion my former boss gave me when I started writing macro research note was to imagine myself standing one year in the future, looking back to the events that have transpired since and asking yourself if it should have been more obvious.
The regional banking crisis back in March is one of those events that I argue should have been obvious to many analysts. One decade of near zero interest rate has led investors to the extreme in their search for yield by investing in various risky structured products and alternative assets, while companies were tailoring their balance sheet and business model to take advantage of the low interest rate environment. These have translated to an unsustainable interest cost burden for many companies as rates go up and compounded in some cases by their business models becoming less profitable in the new, higher-rate environment.
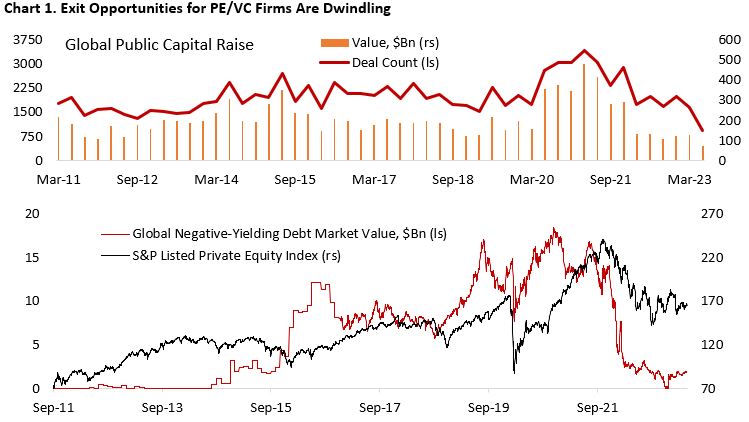
- /reward profile than those done in 2018 when the Fed was at the end of its hiking cycle. With fewer exit opportunities in the public market and rising cost of capital, valuation for private companies should face significant headwinds – as could be seen among loss-making companies in the stock market (Chart 1).
- /reward profile. Prior to the pandemic, cap rate – the discount rate that applies in valuing future cash flows – for the overall REITs was as low as 5.4%, according to NAREIT, and in some cases the cash flow itself is based on a highly leverage balance sheet that will be eroded as borrowing cost increases. The cap rate for all equity REITs have risen from 4.5% in Q4/22 to 5.85% in Q1/23, implying asset price decline of roughly 20%, while the number for office REITs is slightly worse with cap rate rising from 5.4% to 7.6% (Chart 2). Although the increase in cap rates is welcome, their spread over 10-year Treasury yield is currently only back to their historical average.
- In the case of regional banks, we have seen massive expansion of Treasury bonds holding in their balance sheet to cope with the flood of deposits during the pandemic, with managers assuming that returns on such investment would still be above cost of funding in the medium term. In late March we learned the amount of losses that would have been incurred should these available-for-sale and held-to-maturity bond holdings are realized, which shaken the confidence of uninsured depositors and caused a negative feedback loop between the regional bank’s stock price and deposits outflow. Although Fed’s intervention and borrowing facility have calmed market somewhat, the deposit flight from the banking sector will likely continue at a slower pace amid the lure from money market that offers a significantly more attractive yield compared to bank deposit.

In hindsight, the damage from higher interest rate to these three major sectors should have been more obvious. Unfortunately, data transparency for private equity and venture capital deals is low, leaving analysts with only CRE and regional banks to scrutinize for signs of stress in the sector. The changes in bond spreads for firms in these sectors are worth monitoring closely, as early warning signs for financial crises have almost always shown up first in the credit market.
But What About the Economy in General?
Granted, stresses in the three sectors mentioned above need not to increase – it could even decrease – but the backdrop of tightening liquidity and slowing economy historically means heightened risk in the market. As we saw in late March, financial accident could trigger a sharp repricing in rate and equity market. However, we are not dogmatic and will revise our view when the coming macro and fundamental data improve. The optimistic and bullish view on the market looks like this:
- Inflation continues to decline to Fed’s 2% target, allowing the U.S. central bank to cut rate and stimulate a new business cycle. Lower yields and mortgage rates bolster activity in the housing and manufacturing sectors, pushing GDP growth higher.
- Meanwhile, the service sector does not fall into contraction as consumer spending remain strong amid buffer from accumulated excess savings and positive real wage growth.
- The U.S. economy avoided a recession and jump in unemployment, with the labor market remaining relatively tight even as job openings and wage growth moderate.
The bullish view on equity, however, is also some sort of a conundrum. If the economy is too strong, the Fed might have to hike interest rate again to prevent overly tight labor market causing another surge in inflation, as had happened in 1970s. This scenario would translate to a delay in the timing of recession. What is more likely, however, is that the Fed will hold rates at currently elevated level and maintain tight monetary policy, which increase the risk of another financial accident and bode poorly for earnings and risk sentiment. Let’s review the likelihood of the three bullet points above.
We think inflation will continue to fall to Fed’s 2% target. Despite the core measure has yet to clearly roll over, significant progress has been made this year, with data in recent months showing price pressures surprising to the downside. The volatile part of the CPI basket, such as energy and food prices, have eased materially compared to last year, driven primarily by diminishing shocks from the Ukraine-Russia war. Oil prices have fallen from around $120/bbl last year to $70/bbl while agricultural commodity prices have continued to slide and should weigh both U.S. and global food prices going forward.
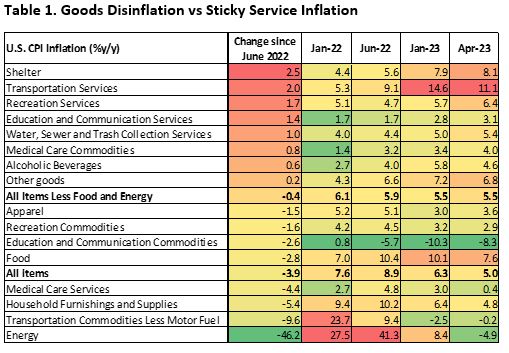
Looking at the core measure, which strip out food and energy, the decline in inflation has been driven by the goods sector. Inflation on new and used cars, auto parts, electronics, household appliances, and furniture have all eased (Table 1). This should not be a surprise given that consumers have pulled forward their spending for these categories of goods during the pandemic.
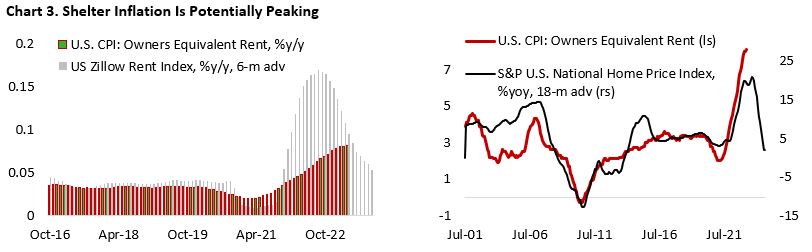
However, the battle on inflation has yet to be won, with the focus now shifting towards the service sector, in which shelter has the largest weight. Encouragingly, we are seeing potential peak in shelter inflation, as indicated by the rolling over of Zillow rental price index and deterioration in housing sector sentiment last year (Chart 3). Continuation of the decline in shelter price inflation should weigh the headline and core figure in the coming months.
Inflation for the rest of the service sectors, however, have been stickier, and policymakers have been highly attentive to the risk of a more persistent inflation in this area. Tight labor market and strong wage growth have been the primary driver, including in education and recreation services – two sectors that have seen stickier inflation this year. Bringing inflation down for the broader service sector necessitate further cooling of the labor market. Although we have seen moderation in wage demand and job openings have come down, both are still too high and inconsistent with Fed’s 2% inflation target.
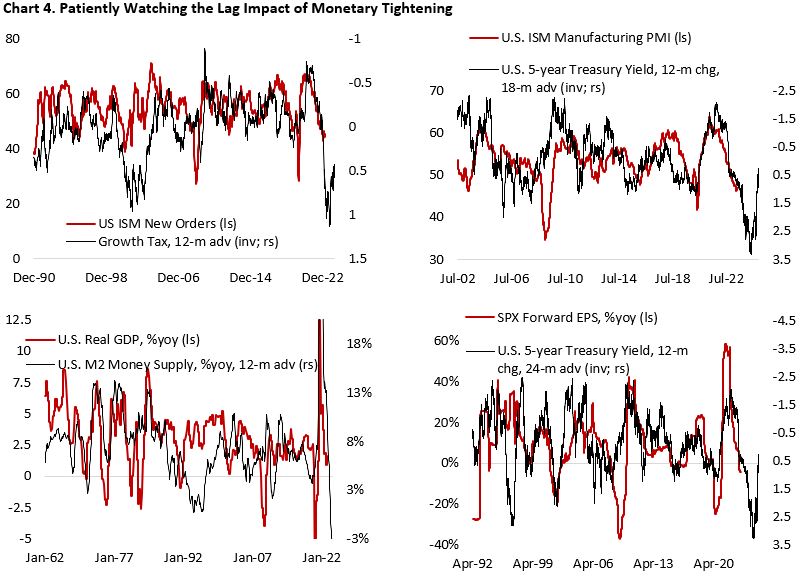
Despite all these, our bias for yields remains tilted to the downside as recession risks are still elevated. As highlighted in May FOMC when discussing factors that could weigh on future policy decisions, participants cited, “the degree and timing with which cumulative policy tightening restrained economic activity and reduced inflation, with some participants commenting that they saw evidence that the past years’ tightening was beginning to have its intended effect.” We have been saying this since last year, pointing to a 12–24-month lag historically between the time Fed started raising policy rate and the economic data showing obvious signs of slowdown in consumer spending and labor market weakness. Given that the Fed started to raise policy rate in March 2022 in this cycle, the bulk of the tightening will be felt around the second half of this year (Chart 4). Interestingly, we did have a mini crisis on U.S. regional banks back in late March, where the underlying issues have yet to be resolved completely.
We believe that growth and the labor market will continue to soften in the months ahead, including in the service sector, hence our suspicion that lower yields will translate to a strong rebound in the housing sector. Affordability remains poor amid high prices and mortgage rates, while the labor market is cooling and pose a downside risk to household income – all of which should weigh housing starts. In addition, mortgage applications are weak and historically led the moves in homebuilder sentiment (Chart 5).

The positive surprise on economic growth – where we have been wrong so far – comes from the strength of the service sector. The pace of the ongoing slowdown has been slower than we previously thought due to: 1) Excess savings and continued support from the government, including student debt forbearance and SNAP, in which the latter just ended last month; 2) Tight labor market that allows labor to gain the upper hand in wage negotiation; 3) global demand tailwind from Chinese economic reopening and lower-than-expected energy prices amid the war in Ukraine.
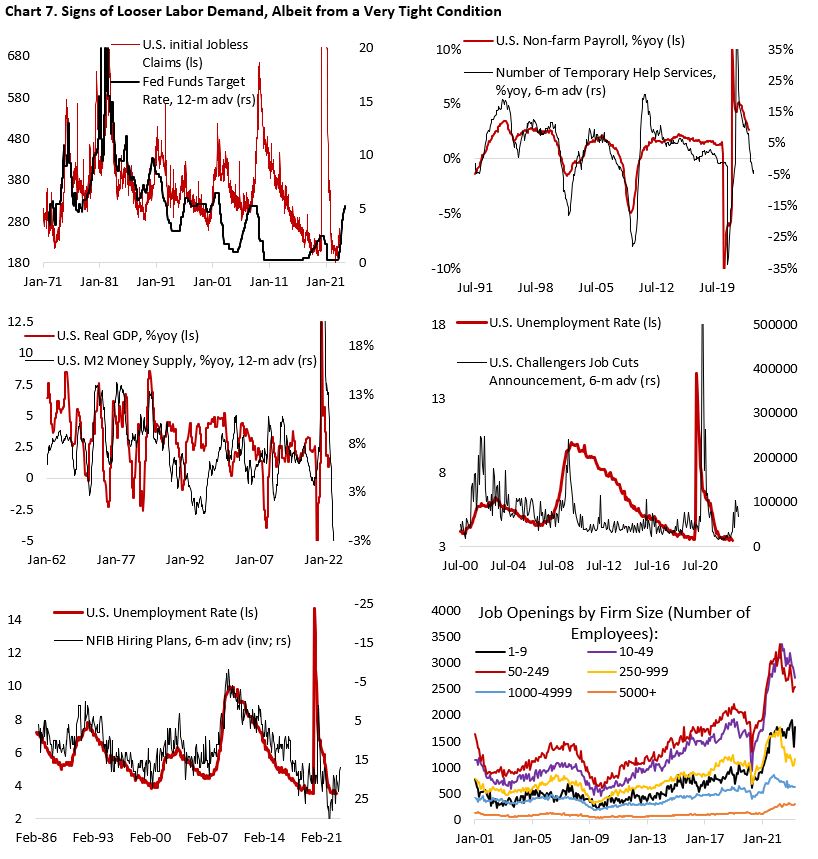
Given the declining trajectory of inflation, analysts and the market have increasingly shifted their attention to the labor market as the arbiter of the economic trajectory. Our expectation for a looser labor market this year has also been wrong, with unemployment rate in the U.S. currently remaining at 3.4% and non-farm payroll in April indicating a healthy job addition. Chart 6 shows that the easing in U.S. labor market has much more to go. Wage growth, currently at above 6%, needs to fall to around 3% to be consistent with Fed’s inflation target while job openings/unemployment ratio has to fall closer to one.

Not all the data, however, is pointing to the outlook of a strong labor market. Both initial and continuing jobless claims are on the rise, albeit from a very low level, and increasing number of companies are laying off their workers (Chart 7). Meanwhile, soft data continue to point to further cooling in the labor market. NFIB small business hiring plan is at the lowest level post-pandemic and job openings by firms with 1-249 employees have seen material decline in past few months, despite a tick higher in April. Given the fact that small businesses are more reliant on banks, the recent regional banking crisis will limit their access to financing and increase borrowing cost. These should act as a headwind to their expansion plan, especially if macro uncertainty persists. In sum, the labor market should continue to loosen.
Another risk to the market comes from the secondary effect of quantitative tightening, whose impact has been partially offset by the borrowing facilities Fed created post-SVB collapse (Chart 8). This has translated to a less-than-expected decline in Fed’s reserve balance and liquidity. The out of consensus view is that a deal on the debt ceiling could potentially be a negative factor for risk assets, as cash build by the treasury will be a drag to liquidity in the U.S. financial system.

The Market is Not the Economy?
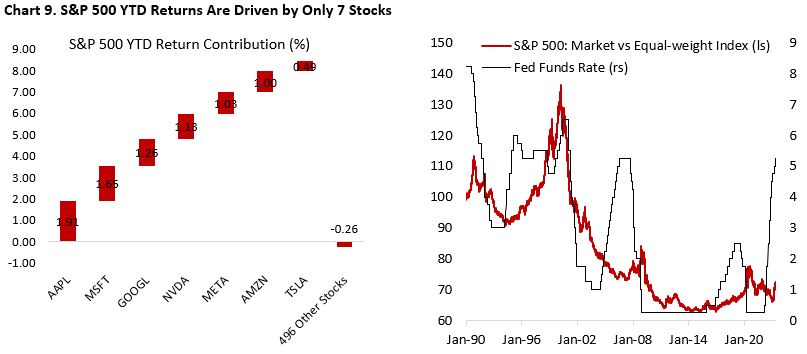
The combination of strong service sector, tight labor market, and less-than-expected decline in liquidity have supported the performance of U.S. stock indices this year, although the average stock has done much poorly than the mega-cap tech stocks. The biggest theme for U.S. equity this year has been the massive outperformance of the latter relative to the rest of the U.S. stock universe. Looking at S&P 500 YTD returns, only seven stocks explain the positive performance of the index, with the rest 496 stocks falling 0.26% (Chart 9). This reminds us of the late 1990’s when several tech names were leading the bull market in S&P 500 and Nasdaq Composite – supercharged by the policy rate cut amid LTCM collapse and Russian default.
So far this year, our call to overweigh bonds over equities has not worked out, mainly due to the strong performance of U.S. stocks rather than weakness in bonds (Chart 10). With a top-heavy S&P 500 index influenced primarily by the mega-cap stocks that deserve to trade at a premium valuation, it remains to be seen whether we will see higher low multiples in the current cycle. Analysts are pointing to the attractive free cash flow yields of the FAANGM to justify the current S&P 500 valuation premium being sustainable. On the other hand, we think slowing global growth will eventually translate to pressure for earnings growth, even for companies that enjoy structural tailwinds. Within equities, however, cyclicals have continued to struggle relative to defensives despite consumer staples and utilities facing headwinds from higher yields. We expect further defensives outperformance in the next 6-12 months as recession risk rise again.

On currencies, we see the dollar strengthening in the coming months, in both the case of a stronger U.S. growth and in a recession. In the first scenario, stronger U.S. economy should translate to lower expectations of Fed rate cut and drive yields higher – a tailwind for the greenback. In case of recession, heighten risk aversion should see safe-haven flow into Treasuries, bidding the U.S. currency higher (Chart 11). This means commodities will continue to be under pressure this year, despite having a more constructive longer-term outlook. Investors would do well to accumulate exposure to the sector during periods of price weakness.

We stick to our cautious stance on U.S. equities on the back of further potential decline for earnings and record-low equity risk premium (ERP). Chart 12 shows the divergence between consensus expectation on S&P 500 and what historically happened following a tightening on lending standards. Whereas market is expecting single-digit earnings growth in the coming two quarters, senior loan officer survey is pointing further contraction. Given the latter indicator has decent track record and our leading indicators are decisively pointing to recession in the coming quarters, we think earnings disappointment is likely in the next quarter.
Chart 12. U.S. Stocks: Earnings Risk and Thin ERP

Copyright © 2023, Putamen Capital. All rights reserved.
The information, recommendations, analysis and research materials presented in this document are provided for information purposes only and should not be considered or used as an offer or solicitation to sell or buy financial securities or other financial instruments or products, nor to constitute any advice or recommendation with respect to such securities, financial instruments or products. The text, images and other materials contained or displayed on any Putamen Capital products, services, reports, emails or website are proprietary to Putamen Capital and should not be circulated without the expressed authorization of Putamen Capital. Any use of graphs, text or other material from this report by the recipient must acknowledge Putamen Capital as the source and requires advance authorization. Putamen Capital relies on a variety of data providers for economic and financial market information. The data used in this publication may have been obtained from a variety of sources including Bloomberg, Macrobond, CEIC, Choice, MSCI, BofA Merrill Lynch and JP Morgan. The data used, or referred to, in this report are judged to be reliable, but Putamen Capital cannot be held responsible for the accuracy of data used herein.
