Download PDF:
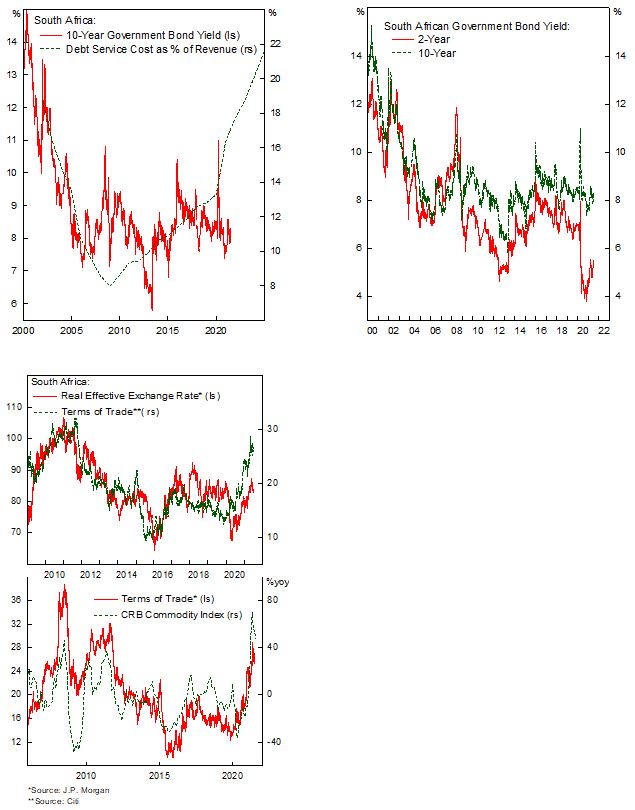
South African local curve will likely continue to bear flatten in the coming months as the central bank start to raise policy rate as inflationary pressure rises – in line with other EM countries. Currently we see sufficient spread of ZA 10-year bonds against global benchmark amid the backdrop of abundant global liquidity and rising commodity prices, but the longer-term outlook for South African bonds is rather bleak. The country’s chronic fiscal deficit and tepid growth means public debt level will continue to rise in the coming years and push borrowing cost higher, as discussed in a previous piece. Alongside Brazil, South Africa is among the most vulnerable country in EM universe, which means that the ZAR has historically suffered during EM correction regardless of its (currently) cheap valuation.

Meanwhile, on the currency side, one of the most important input to our fair value model for South Africa is terms of trade, which is largely driven by the changes in commodity prices. My hunch is that the strong rally in commodity prices has not been fully priced in the Rand due to South African domestic issues (covid-related malaise, political instability), which supports the Rand to continue its rally. However, as the Chinese economy slows down the downside risk for commodity prices and risk asset in general will also intensifies in the coming months. We downgraded South Africa to neutral in our Q3 equity recommendation, reflecting the high beta nature of the country’s stocks and currency. The bottom line is that valuation is supportive for the Rand to strengthen, but sentiment is turning negative.
Copyright © 2021, Putamen Capital. All rights reserved.
The information, recommendations, analysis and research materials presented in this document are provided for information purposes only and should not be considered or used as an offer or solicitation to sell or buy financial securities or other financial instruments or products, nor to constitute any advice or recommendation with respect to such securities, financial instruments or products. The text, images and other materials contained or displayed on any Putamen Capital products, services, reports, emails or website are proprietary to Putamen Capital and should not be circulated without the expressed authorization of Putamen Capital. Any use of graphs, text or other material from this report by the recipient must acknowledge Putamen Capital as the source and requires advance authorization. Putamen Capital relies on a variety of data providers for economic and financial market information. The data used, or referred to, in this report are judged to be reliable, but Putamen Capital cannot be held responsible for the accuracy of data used herein.
