PDF: Lessons from Past Emerging Markets Cycles Part II -Bonds
In the past five years, the size of Emerging Market corporate and sovereign bonds has increased by over 50%. This highlights the increasing need of investment for EM to continue growing. Although currently the size of EM bond market is pale compared to U.S. bond market alone, at less than 5% of U.S. total market cap, this number will certainly grow larger going forward and take a greater proportion of global investor’s portfolio. As a reference, EM equity market cap today is around 19% of its U.S. counterpart and 10% of world total.
It is noted that although EM equity market cap is 11% of world total, EM average equity allocation is only 5%. And within bond space, investors only allocate 1-5% of their portfolio into EM debt. Both are consistent with the view that investors have been overlooking EM assets.1 (Amundi Asset Management)
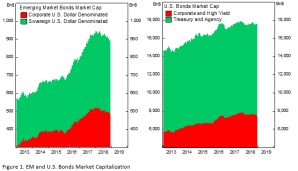
Figure 1. EM and U.S. Bonds Market Capitalization
Adding EM bonds into a fixed income and global portfolio also makes sense, especially for EM Investment Grade corporate bonds, due to the diversification benefit and attractive risk-reward ratio relative to U.S. equivalent securities.
Granted, EM corporate bonds are deemed to be riskier due to the currency mismatch between corporate revenue and its dollar debt, hence the higher yield and return potential.
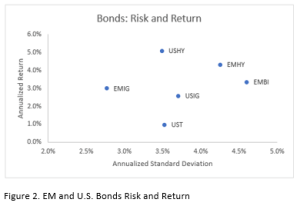
Figure 2. EM and U.S. Bonds Risk and Return
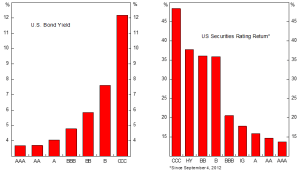
EM minus U.S. sovereign spread are the widest relative to its IG and HY counterparts for the reason that countries borrowing in hard currency tend to be those that are riskier and unable to issue debt in local currency. However, it is interesting to see that EM high yield bonds are trading at a lower spread than investment grade corporate bonds despite the added distress from currency fluctuation and mismatch.
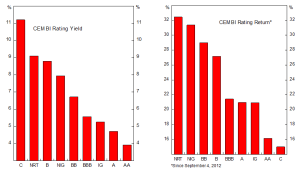
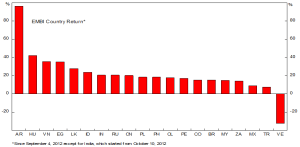
In figure 4, our suspicion is validated that EM high yield bonds should be trading at a much higher spread to offset the losses from default, as highlighted by the lower return of EM HY relative to U.S. HY despite the slightly higher yield. EM sovereign and investment grade corporate are behaving as expected by trading at a higher yield and producing higher return.
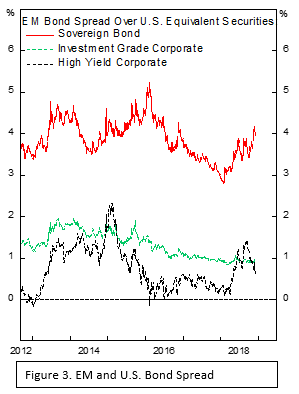
| Figure 3. EM and U.S. Bond Spread |
The bottom line is that EM sovereign and investment grade corporates are an attractive asset class to be added for diversification and enhancement of portfolio return.

Figure 4. EM and U.S. Bond Return and Yield
Performance of Emerging Markets Bond in Various Cycles
Despite the prejudice that EM assets are always suffering during market volatility, we found the opposite to be true for EM corporate bonds. It posted a slightly positive return during the recession compared to the negative return of its U.S. counterpart. And within period of rising Fed rate, the asset class outperformed, but due to the higher weighting in high yield securities and not due to the better performance of the securities itself. Investment grade securities constitute 84% of U.S. corporate bond market and only 60% of EM. Consistent with our precious thesis, EM HY tend to lag the performance of U.S. HY.
EM local currency bond (GBI) performance is more mixed, with positive return during rising rate by the Fed and PBoC, while exhibiting negative return during PBoC easing cycle.

Figure 5. Performance of Emerging Markets Bond in Various Cycles

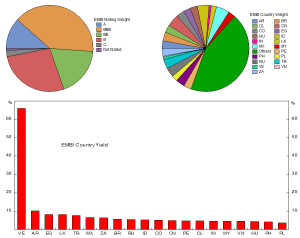
Figure 6. EM Corporate Bonds Weight
Spread per Turn of Leverage for EM Corporate Bonds

Since the rating composition of EM and U.S. corporate bonds differ significantly, we need to standardize the return relative to risk in order to assess the attractiveness. Spread per turn of leverage is a metric commonly used to assess the relative risk-return for bonds market, it is calculated by dividing bond spread to net debt to EBITDA ratio. The current EM corporate bonds TOL is 2.3x, almost twice of U.S. TOL (1.2x). Although this means that EM provides more value for each unit of risk taken, we need to keep in mind of several additional risk that is not captured in the metric, such as:
- Distribution of leverage within EM and U.S. corporates, whether it is dispersed or more concentrated
- The cyclicality of companies in each asset class
- Mismatched exposures in maturity or currency, or both

Emerging Markets Corporate Bonds


Emerging Markets Sovereign Bonds

Emerging Markets Local Currency Sovereign Bonds


U.S. Bonds

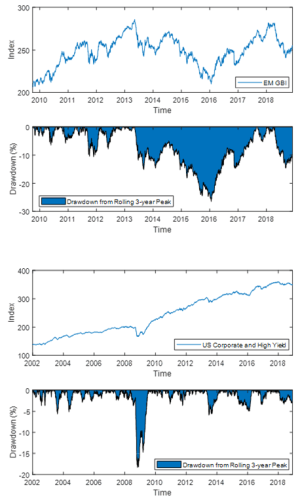
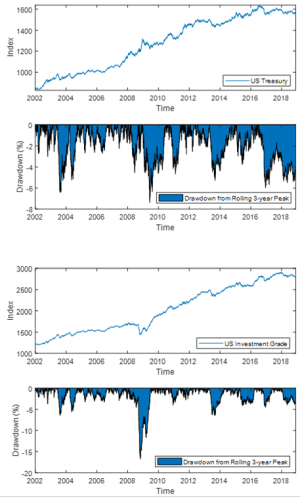
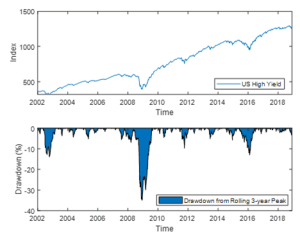
Drawdown from 3-Year Peak of Emerging Markets and U.S. Bond Securities

Kevin Yulianto, PFM
