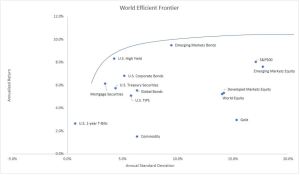
Figure 1. World Efficient Frontier (1988 – Nov 1988, except for few asset classes)
A teacher of mine once said to me that in order to gain anything in life, investing included, we need to take risk. The amount of risk we are willing and able to face determines the expected gain or progress that we will incur in the future. Entrepreneur, risking both his financial capital and time, is rewarded handsomely should he succeed. However, not everyone has the risk appetite to take such amount of risk, which is the reason that salary man with familial obligation would think twice before quitting his job to start a new business venture. Young people, however, has nothing to lose but everything to gain. It increases the risk tolerance that they could stomach in facing uncertainties (volatility).
The same concept applies in investing, with pension funds having less risk tolerance relative to equity mutual funds, and even less compared to hedge fund or private equity fund. Assessing investors or beneficiaries’ risk tolerance is a crucial step before any asset allocation decision, which usually results in weight limit in particular asset class, country, or even securities, which in turn, affects the return potential in the long-run. In managing the money investors delegated to Putamen Capital, we determine carefully the asset classes included in the portfolio, based on both proven past return and expected return going forward.
In the current economic situation, we shy away from high yield (junk) bonds despite the high return it has provided in the last 30 years (slightly above 8% annually), as we believe that the current risk from corporate leverage and peak cycle will weight down these securities. We also currently underweight emerging markets bond and equity, despite the attractive valuation, but is planning to gradually increase our allocation. In the anticipation of Fed backing-off from rising rates further in 2019, we do believe equity markets will rally with EM outperforming DM. Our conclusion from studying previous cycles and yield curve inversion is that the market will have another up leg before major correction happening in the current cycle.
Putamen Growth Fund currently has lots of dry powder to be invested in riskier securities should we become more positive on the market, a position that require us to time the market adequately. In fact, we have majority of our allocation in Treasury bonds, which should benefit further from the lower inflation expectation from oil price correction in the past three weeks.
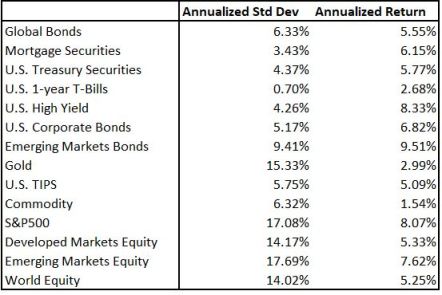
Table 1. Return and Volatility of Asset Classes (1988 – Nov 1988, except for few asset classes)
Here is our view on various asset classes in the next 6-12 months:
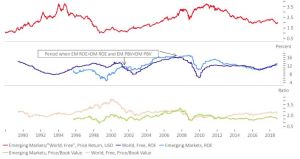
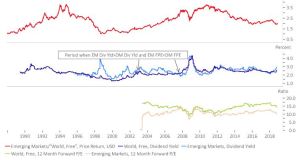
- Emerging markets equity should outperform developed markets, but developed markets will not necessarily outperform S&P500. Emerging markets valuation is currently cheap relative to its DM counterparts and earnings outlook is improving as well. EM ROE and Dividend yield have converged to DM, but P/B ratio and Forward P/E are still trading at a wide discount. European equity, despite being very cheap, may still face headwinds from Brexit, credit problem in the banking system and Italy budget sanction from EU. We do noted, however, that the financial sector is trading at a real bargain. We will discuss our country allocation at the end of this post.
- We like U.S treasury securities and believe that yield will go down further. Our forecast is for 10-year yield to drop toward 2.8%, giving us expected return of 5% from the holding. As discussed above, lower inflation expectation and accumulation of safe haven assets in anticipation of downturn should bode well for bond prices. However, we acknowledged that mortgage, corporate, global, high yield and EM bonds are likely to still outperform, in that order, at least until first quarter of 2019. The increase in high yield spread this month is particularly concerning, although a large portion is contributed by the drop in credit worthiness of energy-related companies as oil price collapse. The peak cycle is still at its early phase, but we feel uncomfortable “collecting pennies in front of steamroller”. For tactical asset allocation into riskier assets, we prefer shifting our allocation to EM equity instead of riskier bonds.
- We are slightly bearish on gold and silver, although open speculative positions indicate that a short-term reversal is likely. In the face of strengthening U.S. dollar, pressure on soft commodities, metal and ore are likely to continue.
Although PGF is a global macro fund, we also utilize quantitative method to confirm our market view and determine weights between bonds and equities, and also each country weights for equity allocation. Admittedly, we prefer concentrating our equity allocation to 4-5 countries to balance the quality and quantity of our coverage. We currently favor Russian, Hong Kong, Finland and Indonesian equities in our allocation, with the greatest weight in Russian equity. Thanks to years of sanction from the U.S and weak corporate governance of Russian corporations, Russian equity is very cheap with P/B value less than 1x and Forward P/E less than 8x. Meanwhile, ROE at 13.62% is above the world average and Debt/Enterprise Value at 0.49x is much lower than world’s 0.67x.
The quantitative model we built determine the allocation between asset classes and within equity country allocation separately, allowing us to evaluate the performance of each allocation. Based on our strategy back-testing with monthly rebalancing, our equity country allocation model outperformed MSCI All Country World Index by over 5 times, boosting the annual return from a meager 4.1% to 10.1%. Combining our equity country allocation strategy with the asset allocation strategy boost the return further to 16.5% annually while decreasing the volatility significantly. Our model currently only suggest 18.1% allocation to equity and 81.9% to safe haven securities, using treasury as a proxy.

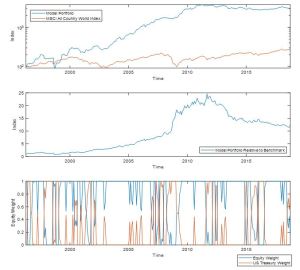
One notable observation is decline in outperformance of the model relative to benchmark since 2011, caused by the relative underperformance of the equity country allocation model, which we believe is due to the massive liquidity injection by central banks across the world through Quantitative Easing. (QE). This distort the valuation of each country equity market that experience massive inflow from foreign investors, but with liquidity being tightened by the Fed, ECB and BOJ, we believe that market will correct these imbalances going forward. The proliferation of investing through ETF, especially in emerging markets, also exacerbate the bubble in “overvalued” countries relative to “undervalued”.
We will be continually improve our model based on rational economic and financial relationship to guide our allocation decision, aside from our subjective macro judgement that the model may not anticipate quick enough. In conclusion, we are currently positioned in a very defensive way, a stance that has work well so far, but are looking for opportunity to increase our allocation to riskier asset class over time.
Kevin Yulianto, PFM
