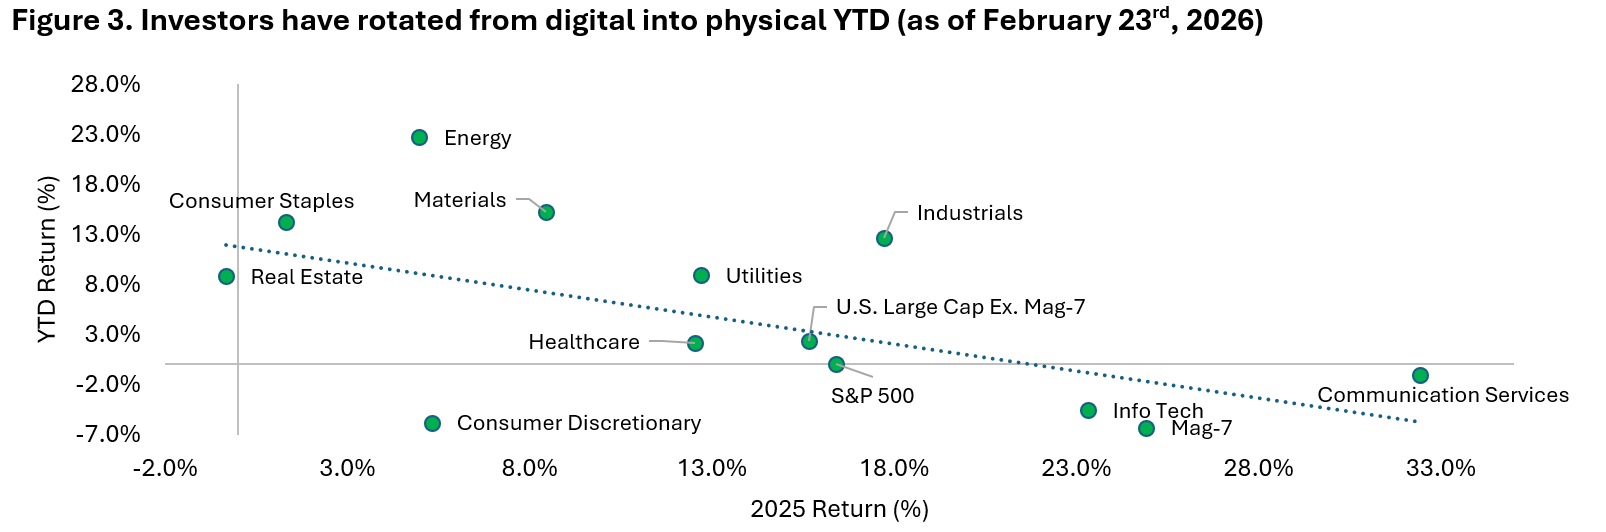
Since the beginning of the internet revolution in late 1990s, humans have gradually shifted their daily activities from physical to digital world. The rise of social media and e-commerce has only accelerated this trend, with the average American now spending more than 8 hours per day consuming digital media – a trend that has accelerated after the pandemic (Figure 1). Similarly, in the investing world, investors have favoured asset-light businesses with high profit margin – valuing them at multiple few times higher than companies in the old-economy industries. That is until last October when investors’ concern on the potential for AI tools to replace incumbent software players started to mount (Figure 2).
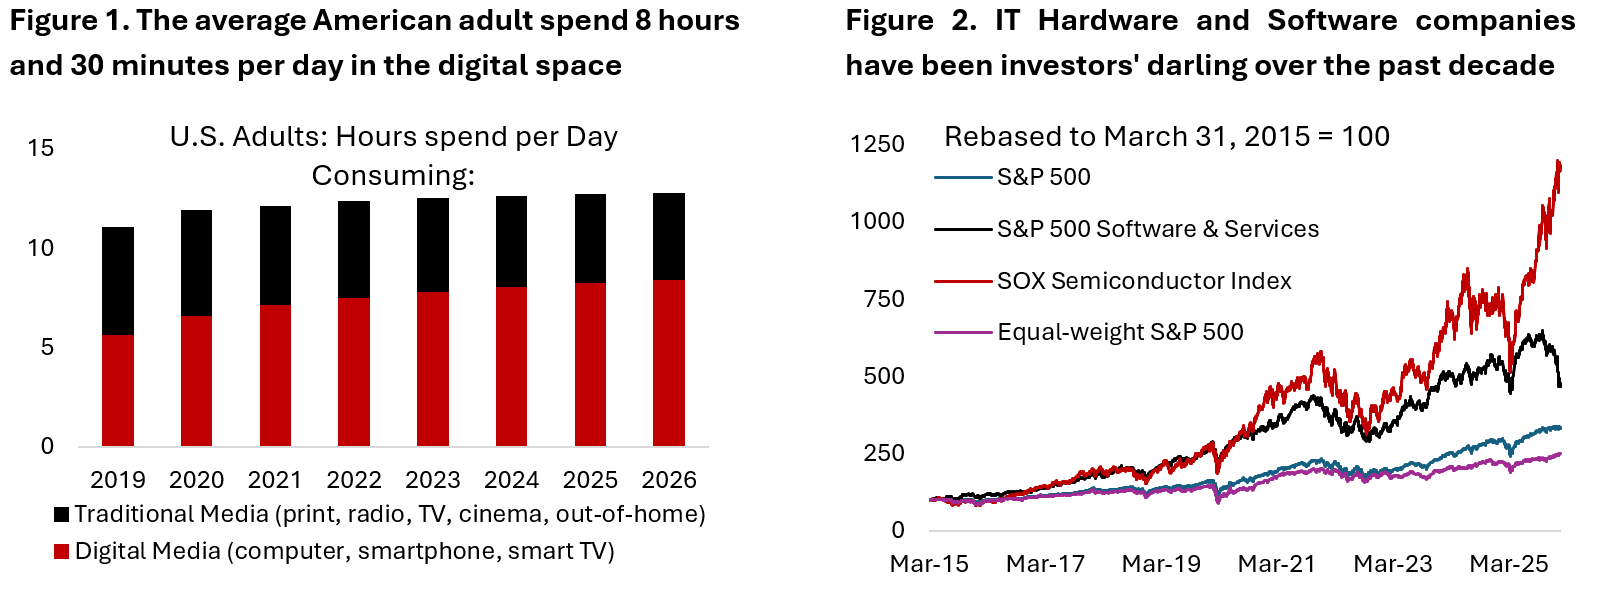
This happened amidst the parabolic move higher by the semiconductor subsector that benefits from the buildout in AI infrastructure including data centers. Ironically, businesses that used to be capital-light are now becoming capital-heavy as they need to invest significant portion of their profits into the AI arms race. This could be seen in the cash use of big five hyperscalers – ORCL, AMZN, GOOG, META, and MSFT – that this year will invest roughly 90% of their free cash flow to fund AI-related investments.
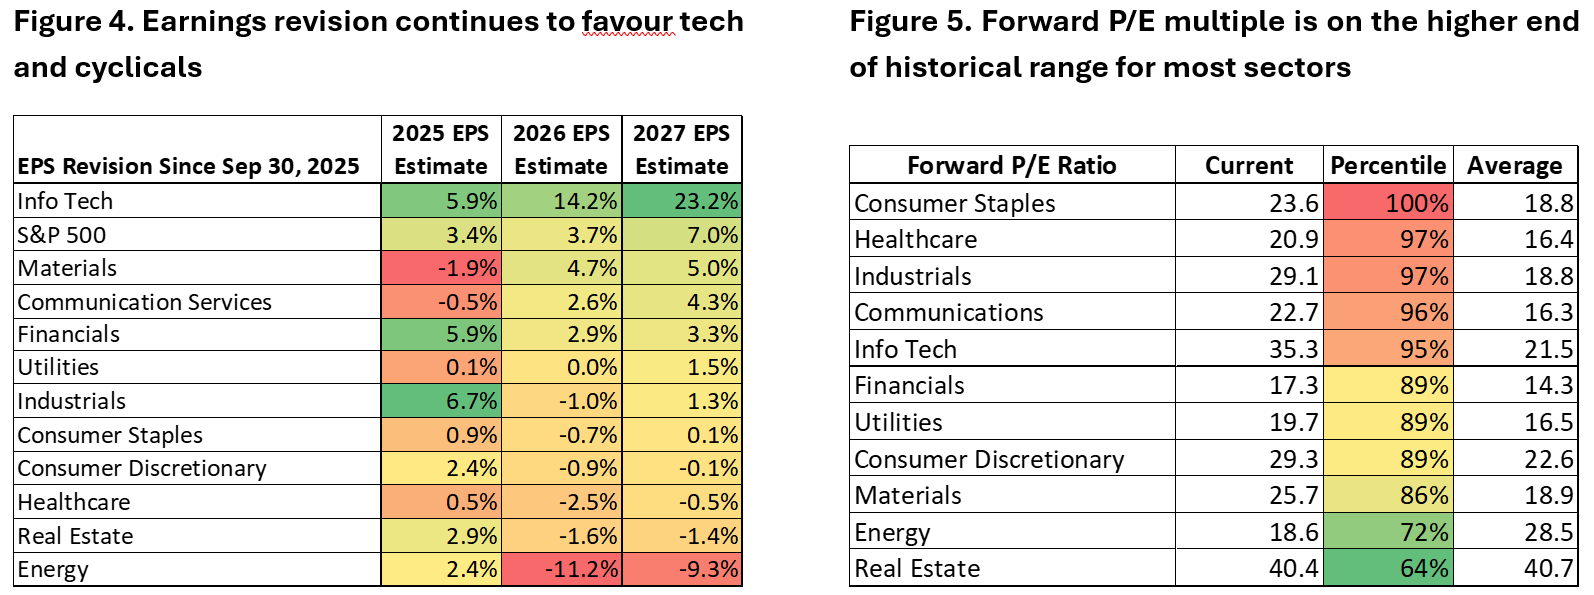
Amidst all the uncertainty in the tech space, investors have rotated away from the winners of the previous few years into the laggards whose businesses are mostly grounded in the physical space and hence saw less disruption from advancement in AI (Figure 3). Investors are bidding up the latter, which includes food manufacturing, mining and energy, real estate, select pockets of industrials, and utilities.
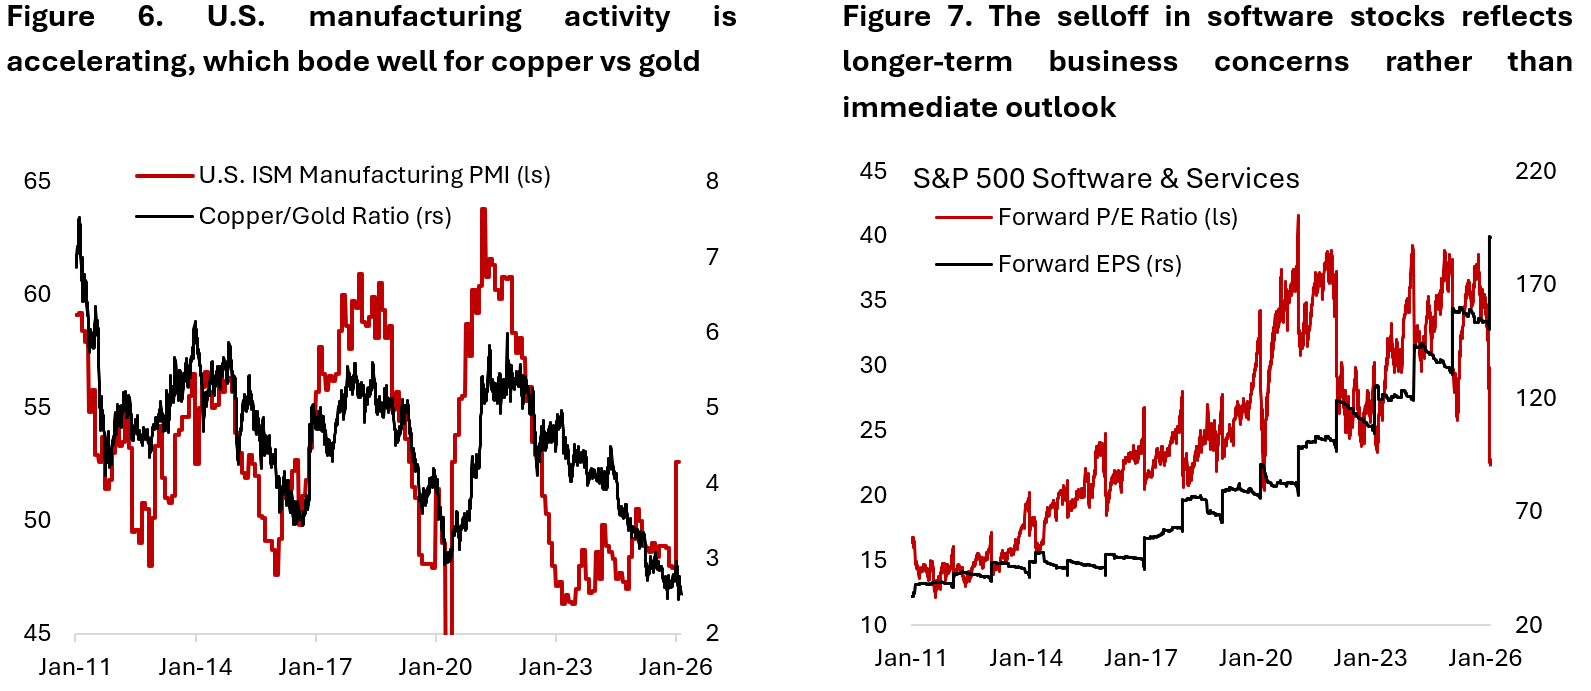
Looking at the fundamentals, however, info tech sector continues to see the most favourable EPS revision as the earnings season unfolds, followed by materials, communication services, financials, and utilities (Figure 4). Meanwhile, energy sector – the best performing YTD with 22.7% return – continues to see downward earnings revision despite being relatively cheap (Figure 5). This divergence between stock performance and earnings revision perhaps reflects a normalization of valuation of these sectors from an elevated/depressed level. It is interesting to see the info tech and consumer discretionary (AMZN, TSLA) sector finally trading at lower percentile of forward earnings multiple than those of consumer staples, healthcare, and industrials, which has not been the case in the past three years.
It is possible that the rotation has gone too far and too fast, and our contrarian gut feel tells us to go short consumer staples and long growth stocks. We remain constructive on the outlook for cyclical sectors, including materials industrials, and financials as the U.S. business cycle is inflecting higher – confirmed by the strong ISM Manufacturing PMI reading in January. Within commodities we go long copper vs gold, which historically benefits more from the upswing in manufacturing activity (Figure 6).
Going back to the software issue, the selloff in AI-disrupted stocks so far highlights investor concern on the longer-term outlook of such business rather than the immediate business fundamentals (Figure 7). Investors are now broadly expecting margins in the software sector to be eroded and hence discount a lower terminal value as the probability of AI co-working tools meeting the demand for such software increases. Given that it is difficult to disprove the impact of AI on their businesses, we do not think the market will re-rate these businesses back to prior earnings multiple anytime soon.
The good news is that software accounts for only 9% of S&P 500 index – limiting the damage from AI disruption for diversified investors. However, investors are increasingly concerned about the secondary impact of dramatic devaluation of software companies:
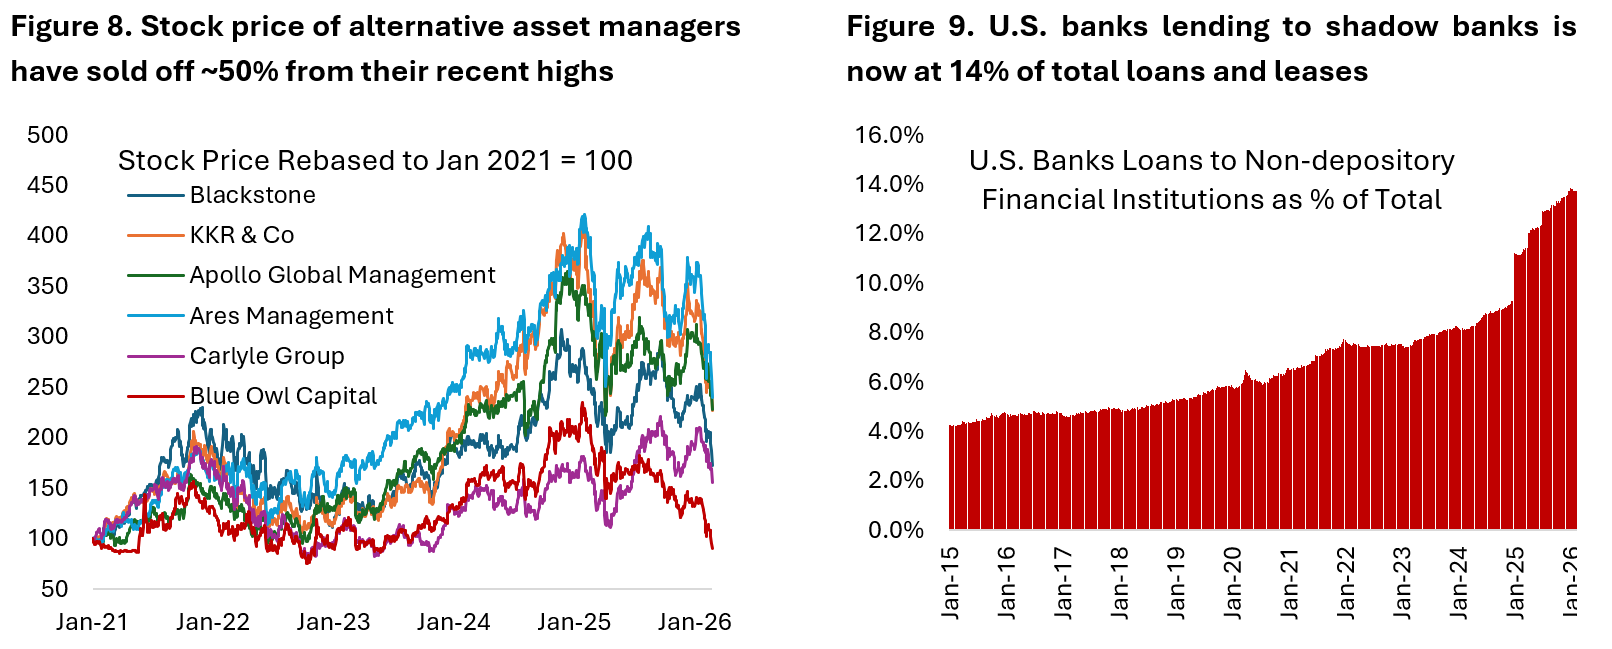
- Private market: Bank of America’s Fund Manager Survey highlights private credit and private equity as one of the main tail risks today given the difficulty of assessing risks in the space amid opaque holdings and not so transparent calculation of the underlying asset value. For instance, in one extreme example, Blue Owl – a private credit player – said that most (70%) of the 200+ companies the company lends to are in software category. The company has also halted redemption on its private credit fund. The stock prices of more diversified managers (outside private credit) have not been spared either, with the group on average down ~50% from recent high (Figure 8). Perhaps, investors are wondering how different the conditions are for private equity funds, which have also invested in software companies and lower capital stack.
- Banking sector: roughly 14% of U.S. commercial bank lending today is to shadow banks or non-depository financial institutions (NDFI), which have been an important intermediary for private market players (Figure 9). If default rises in the private market, it will likely have a ripple effect on the banking sector, although we believe it should be limited given thick cushion from equity investors. We do not think a credit event or (ehm) liquidity issue in private market will translate to a broader systemic risk for the financial sector.
- Tightening financial conditions and liquidity: currently liquidity backdrop remains supportive amid the Fed returning back to de-facto QE and ample reserve balance in the banking sector. However, liquidity has the habit of evaporating just at a time when the market needs it most. We are being mindful of the stretched positioning in JPY carry, treasury basis trades, and also record retail position on levered ETFs – all of which has the potential to unwind and amplify volatility across asset classes.
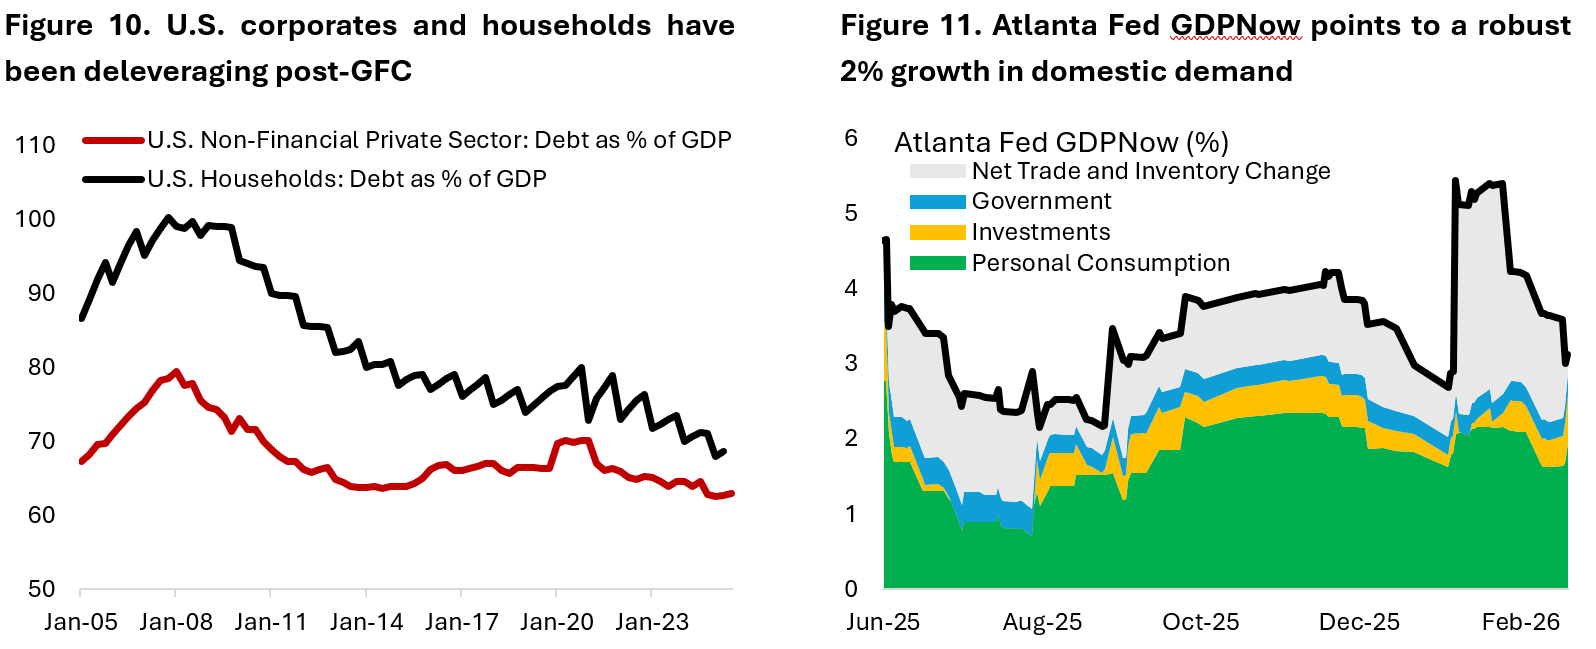
The good news is that the U.S. economy is in a good position to weather such credit event. First, private sector (household and corporate) debt has been declining since the GFC, and fiscal policy is turning stimulative this year – both of which should cushion the economy from credit shock (Figure 10). Second, the decline in software stock price is a reflection of much lower terminal value rather than fundamental concerns in the near term, which has negligible net economic impact from macro perspective in the near term. Third, the macro backdrop remains very conducive for risk assets. GDP growth is still expected to be around 2% this year, the Fed is still on monetary easing path, and fiscal is becoming a tailwind at least for the first half of the year (Figure 11).
Given the ongoing equity rotation towards cyclical and goods sectors, rising uncertainty on the tariffs front is unwelcome news for investors. The SCOTUS decision to strike down IEEPA tariffs has brought back last year’s trauma with many countries now in a state of confusion of what their effective tariffs rate is. China is the greatest beneficiaries as the country’s effective tariffs rate dropped 7.2% whereas countries that previously enjoyed low effective tariffs rate see a higher one following President Trump’s 15% global tariff announcement (Figure 12).
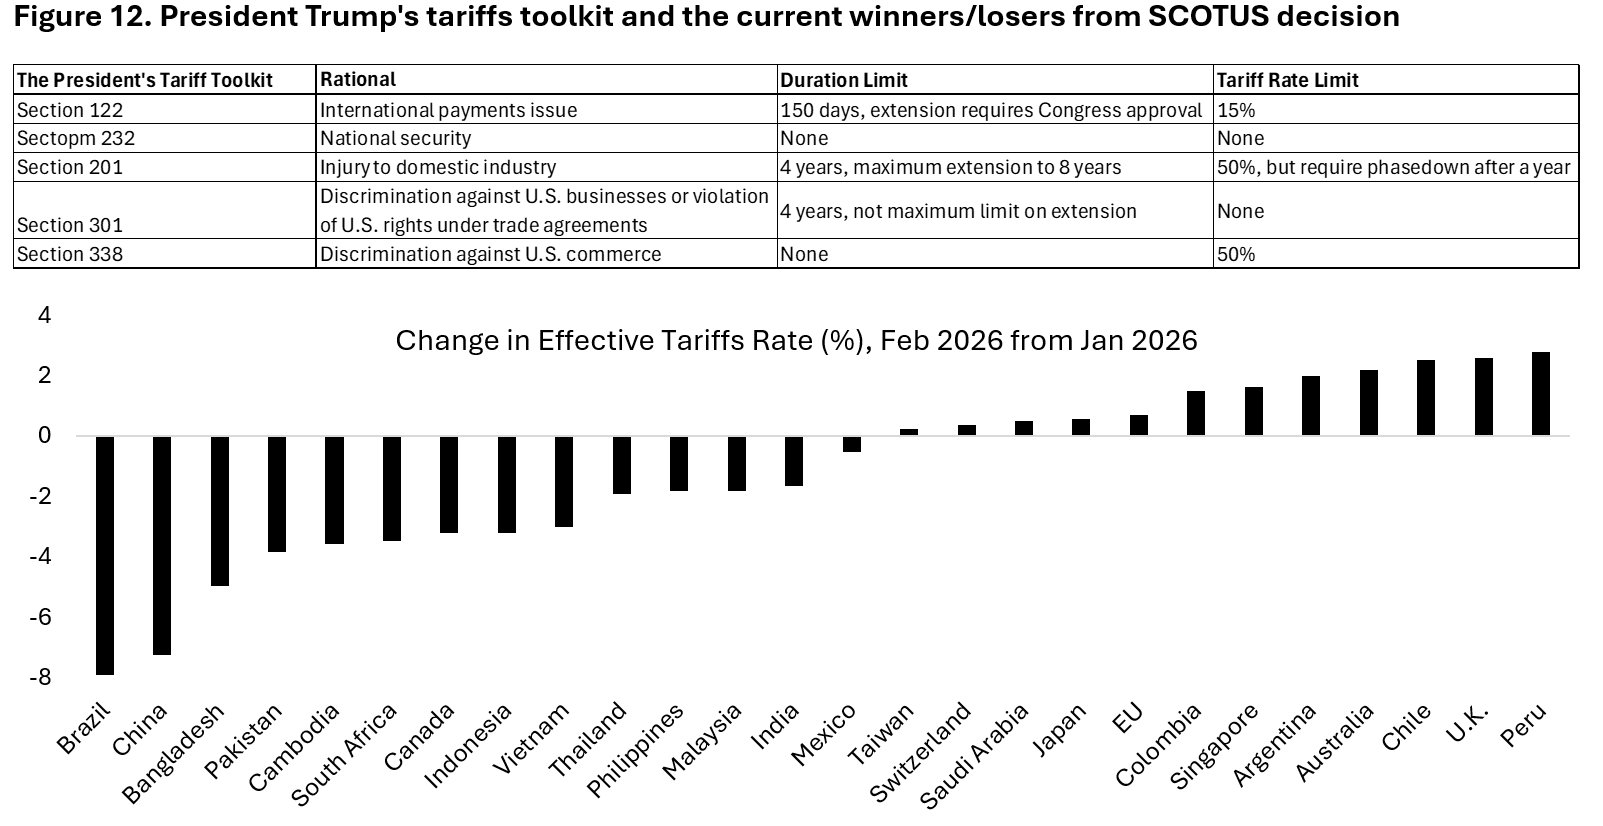
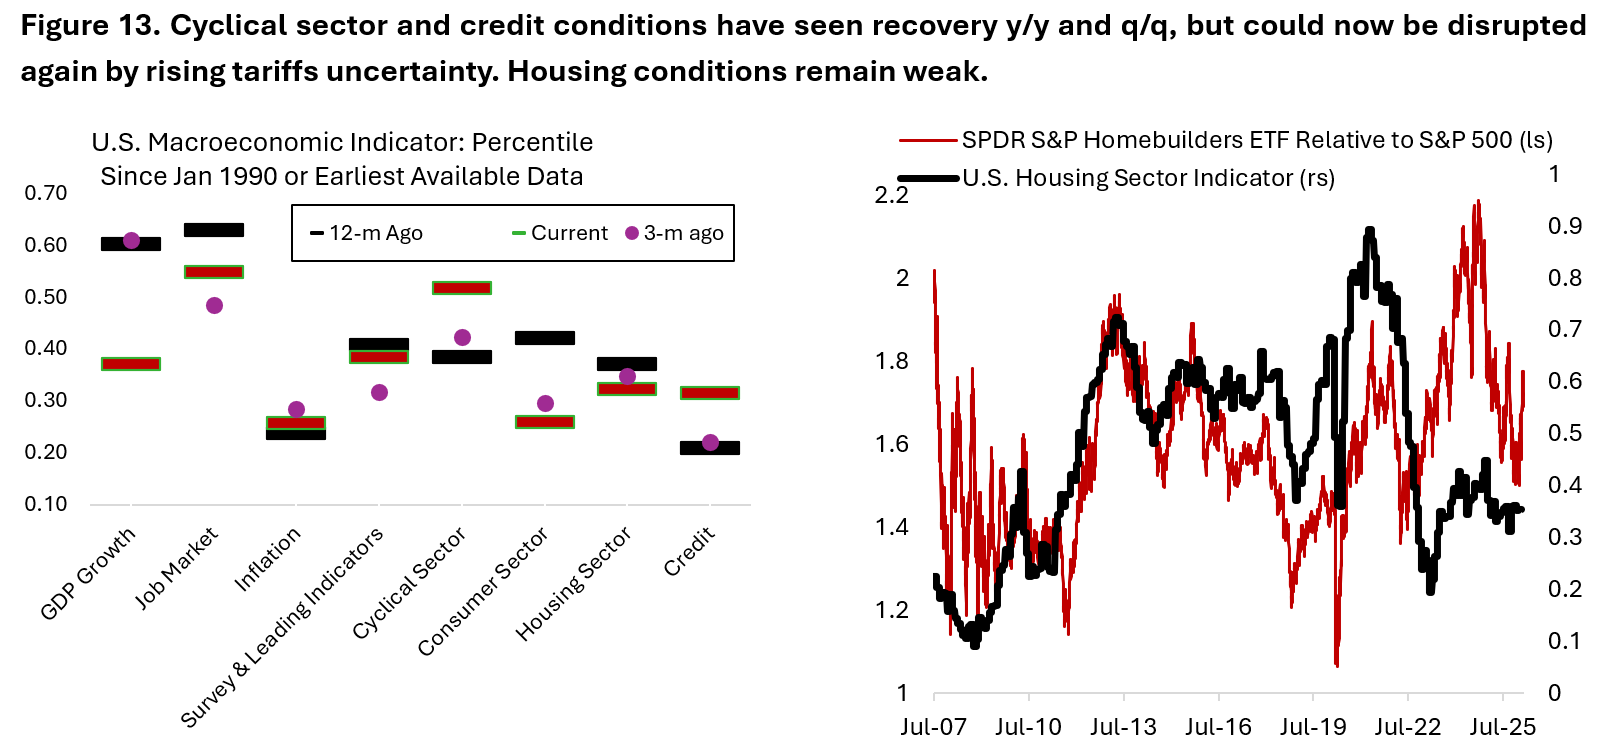
From investment perspective, the refund of tariffs revenue could translate to higher fiscal deficit – prompting worries from fixed income investors. Early analysis shows that tariffs revenue from 15% global tariffs under Section 122 will bring down the effective tariffs rate from 14% previously to around 12% – essentially lower than the previous arrangements. We do not have much to add here as the situation remains fluid, but a reneging of the previously announced trade deals could disrupt the budding recovery in cyclical goods sector while rising yields is a headwind for the already depressed condition in U.S. housing sector (Figure 13).
Copyright © 2026, Putamen Capital. All rights reserved.
The information, recommendations, analysis and research materials presented in this document are provided for information purposes only and should not be considered or used as an offer or solicitation to sell or buy financial securities or other financial instruments or products, nor to constitute any advice or recommendation with respect to such securities, financial instruments or products. The text, images and other materials contained or displayed on any Putamen Capital products, services, reports, emails or website are proprietary to Putamen Capital and should not be circulated without the expressed authorization of Putamen Capital. Any use of graphs, text or other material from this report by the recipient must acknowledge Putamen Capital as the source and requires advance authorization. Putamen Capital relies on a variety of data providers for economic and financial market information. The data used in this publication may have been obtained from a variety of sources including Bloomberg, Macrobond, CEIC, Choice, MSCI, BofA Merrill Lynch and JP Morgan. The data used, or referred to, in this report are judged to be reliable, but Putamen Capital cannot be held responsible for the accuracy of data used herein.
