Introduction
Research shows that the equity market responds to macro news, with favorable macro news tend to be followed by increases in revenues, profits, and investment activities of companies (Modugno and Palazzo, 2024). In the study, the authors concluded that macro surprises could explain up to 34% of the S&P 500 return variation – highlighting the importance of monitoring macroeconomic data release for equity portfolio managers.
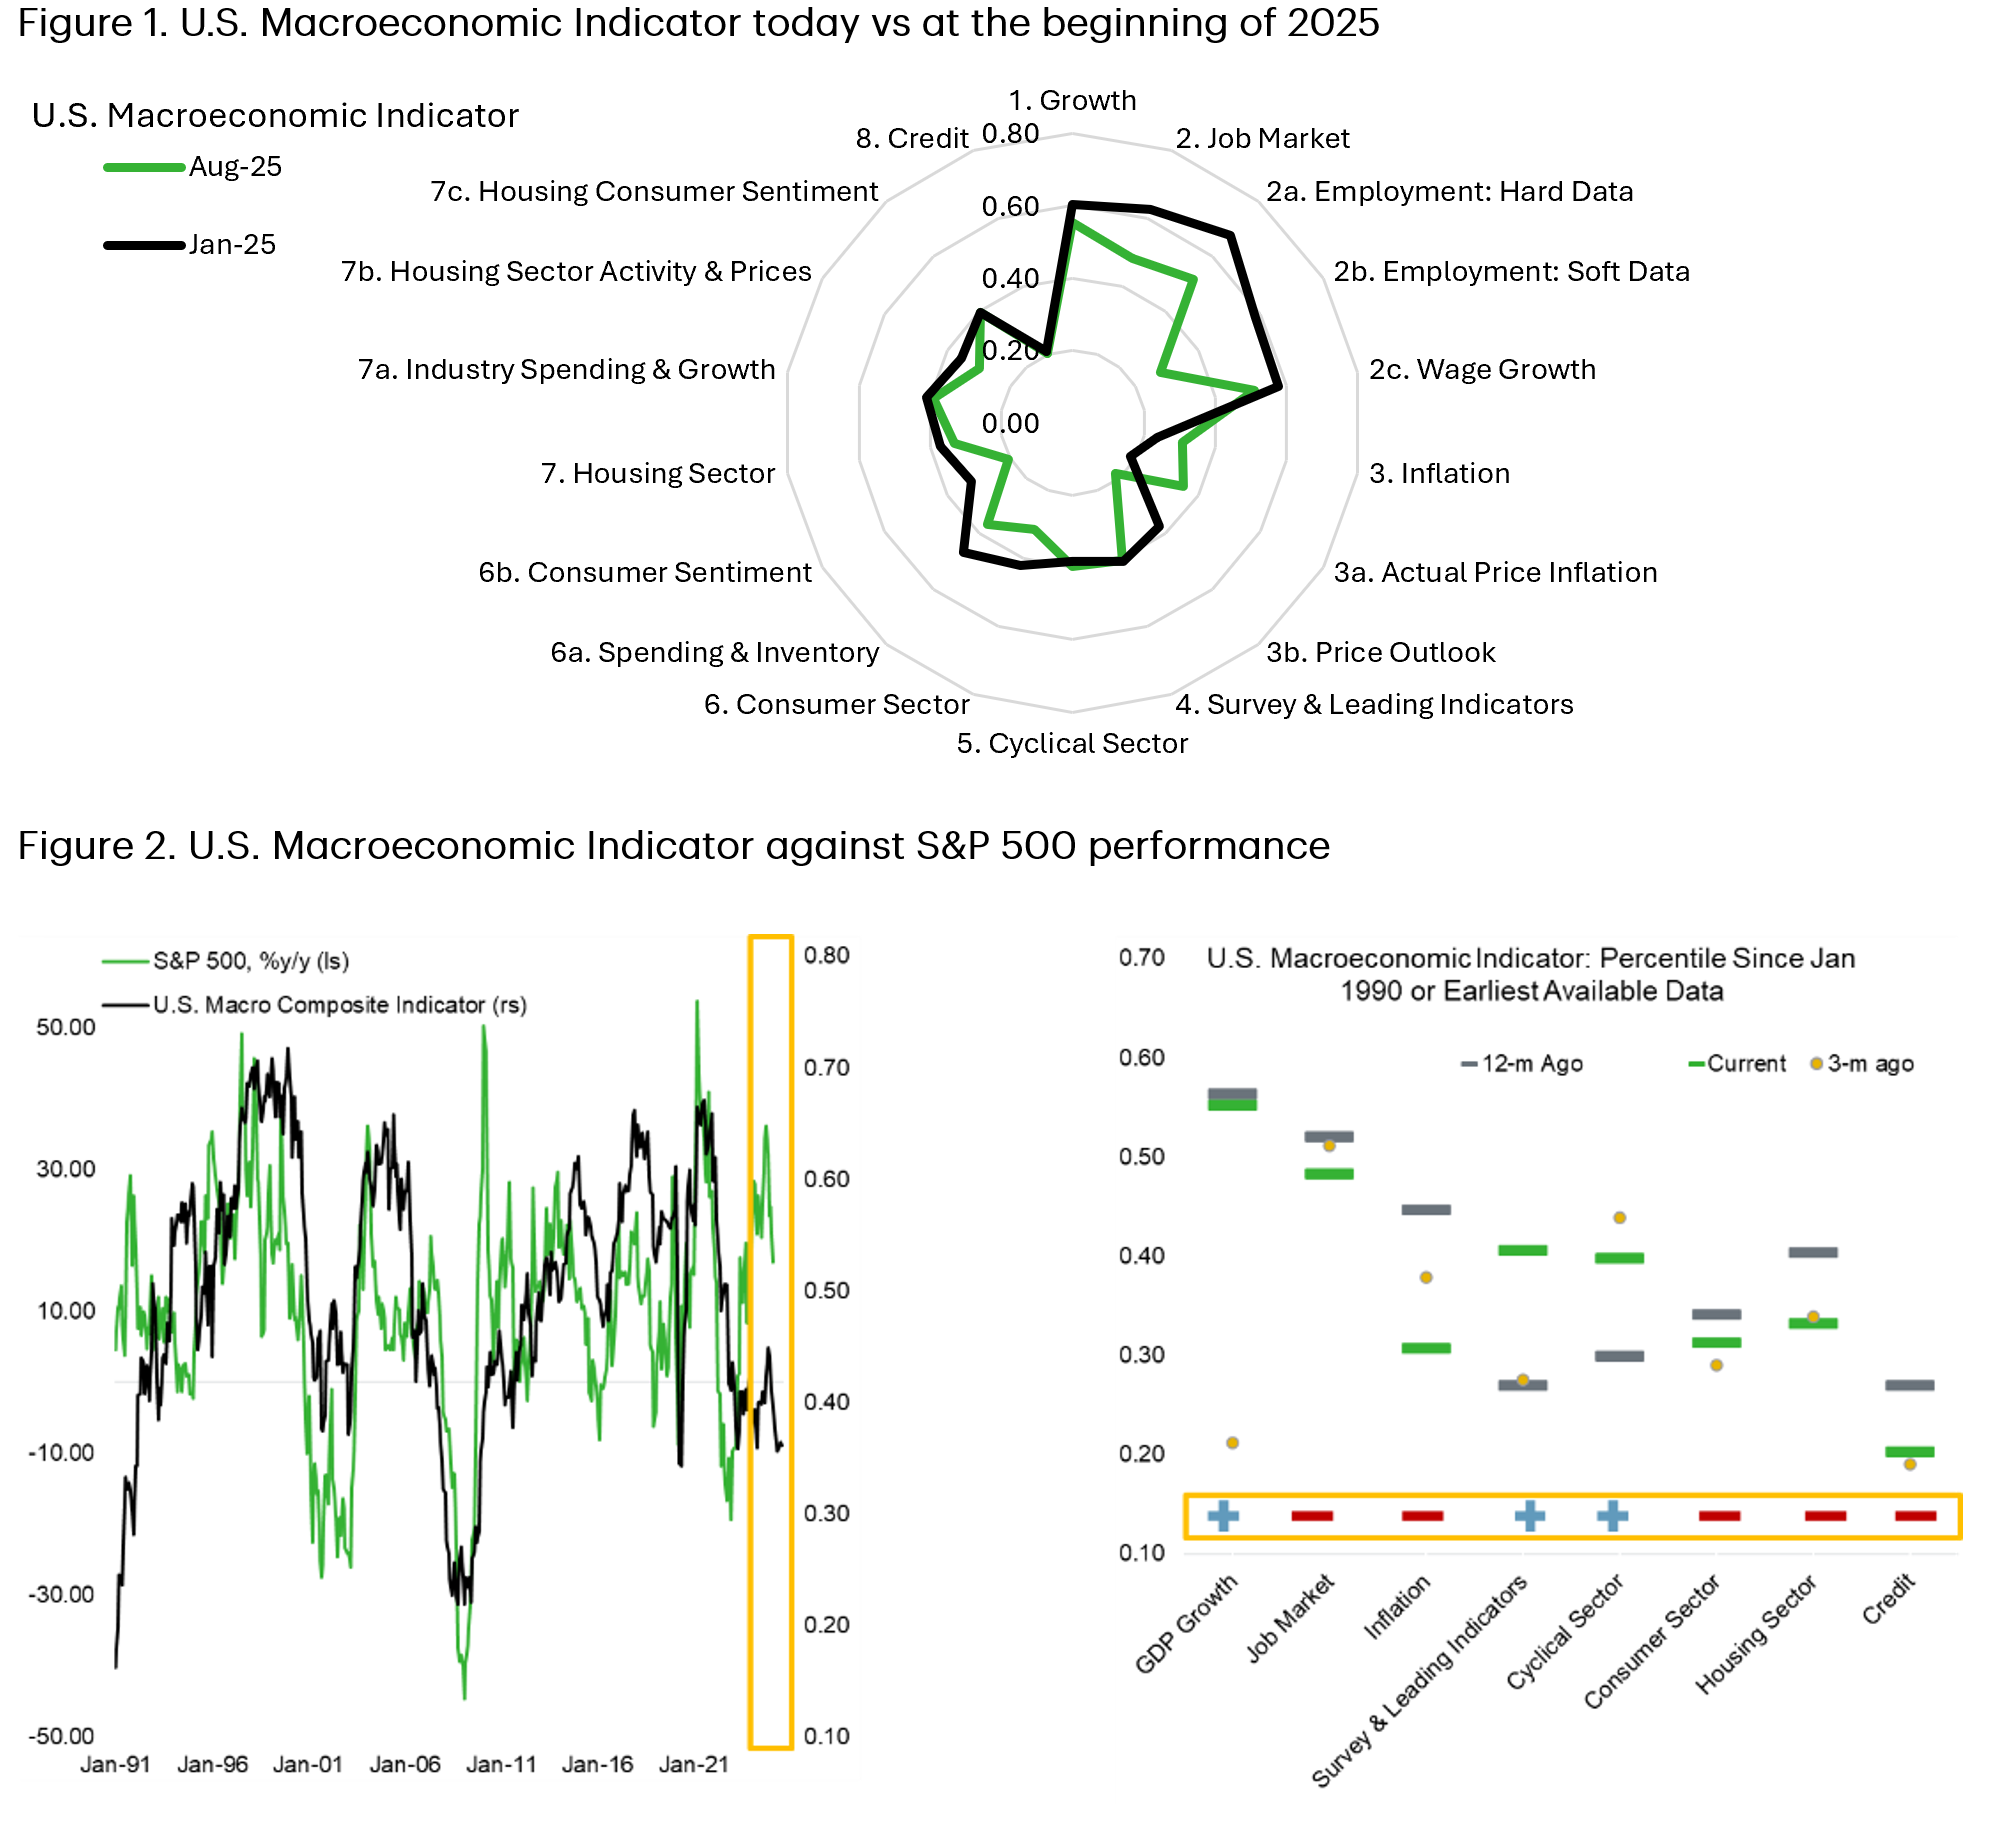
As a foundation of our quantitative equity project, in August 2024 we developed a U.S. Macroeconomic Indicator (USMI) that tracks developments in the U.S. economy across various metrics, shown in Figure 1 and Figure 2. This month we are introducing the Quantitative Sub-sector Rotation Strategy (QSRS), which leverages the USMI for quantitative application of U.S. sub-sector rotation strategy – essentially linking macro developments into micro or company level and portfolio management application.
All The Data in the World – August 2024
One of the common problems being a macro strategist is being accused of cherry-picking data to fit whatever narrative one is conveying at the time. Over the past two years, those with more negative view of the U.S. economy pointed to the depressing figures out of the industrial and cyclical sectors, while those with more positive view highlighted the strength in employment gains and consumer spending. Arguably, the gap between the bear and the bull has narrowed significantly today, with broad economic indicator continuing to soften even as U.S. equity market continues to march higher), driven primarily by the decline in employment gains and retail spending to levels that is in-line with trend growth.
This month we are introducing an enhanced U.S. macro monitor based on all 119 releases of U.S. economic data on either monthly or quarterly basis (see Appendix for details). Each data point is transformed into either %y/y or %m/m growth, or both, and then transformed into percentile rank versus its own history. We then classified all these data into eight main categories: growth, job market, inflation, survey & leading indicators, cyclical sector, consumer sector, housing sector, and credit. For each category, we divide the classification further into hard and soft data. The consumer sector, for example, is classified into spending & inventory that tracks actual consumer spending and inventories across channels, and consumer sentiment.
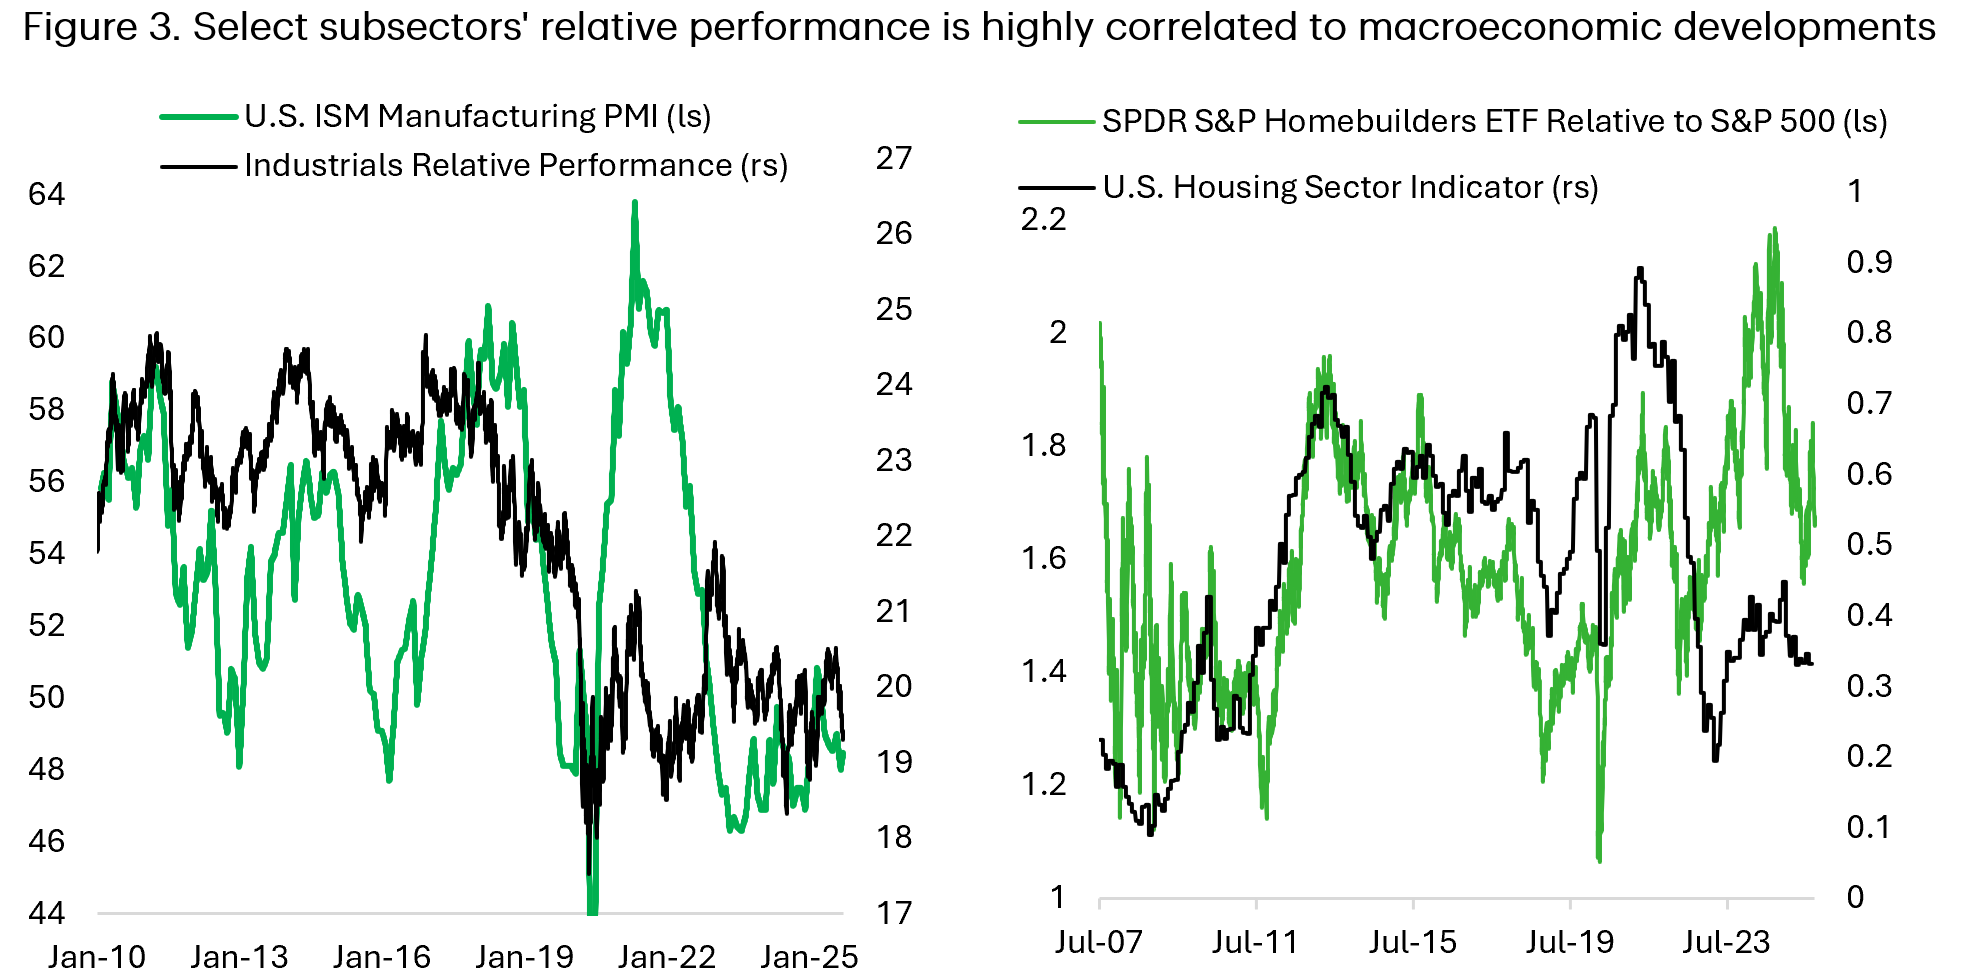
Equity strategists and fundamental portfolio managers have long tried to link macroeconomic developments to sector positioning. For instance, industrial sector relative performance tends to be positively correlated to the changes in the U.S. manufacturing PMI while homebuilders’ relative performance tracks our housing sector indicator well (Figure 3). QSRS aims to formulate this thought process surrounding economic data release and its implication for equity subsector relative performance.
The various categories in USMI tend to ebb-and-flow together, which translates to the broader U.S. business cycle, but is not always in sync with each other (Figure 4). For instance, the consumer sector tends to be less volatile than the housing sector that is more sensitive to monetary policy and credit cycle. At a higher level, however, readers should note that all these indicators are influencing each other.

There are three main use cases for Quantitative Sub-sector Rotation Strategy:
- Strategy and client communication: bridging the gap between macro and micro in the context of portfolio management; addressing the “so what?” question to macro data release.
- Discretionary portfolio management: screening for (sub)-sectors that are potentially over/underpriced. Quantifying the logic in OW/UW decision in managing equity portfolio.
- Quantitative application: systematic trading strategy with low rebalancing frequency (monthly) with the goal of outperforming passive equity allocation
QSRS Data and Methodology
Stock price, sales per share, and earnings per share for all 24 GICS level 2 industries were retrieved through Bloomberg terminal, in addition to the proprietary U.S. Macroeconomic Indicators outlined above. Given the goal is to build a quantitative subsector rotation model that outperform the U.S. equity benchmark, rather than predicting subsectors that will deliver positive absolute return, all variables related to equity fundamentals are converted to relative to benchmark.
We use multiple least square methods to determine macroeconomic and equity fundamental variables’ explanatory power to each subsector’s relative performance. Acknowledging that economic data release for a particular month will be available one or two months later, all explanatory variables are lagged by two months so that the model does not read into the future. The adjusted R-squared for these models range from 52% for the capital goods industry to 94% for software and services (Figure 5).

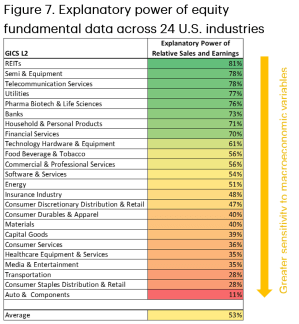
Figure 6 shows the 24 industries classified under Global Industry Classification Standard and the direction and size of each variable in explaining the dependent variable. Perhaps unsurprisingly, relative sales and earnings per share account are two major contributors to explaining subsector’s relative performance, with large variation across industries. These two equity fundamental variables could explain more than 50% of the subsector’s relative performance for 13 out of the 24 industries, which also means that macroeconomic variables account for more than 50% explanatory power for 11 out of the 24 industries (Figure 7).
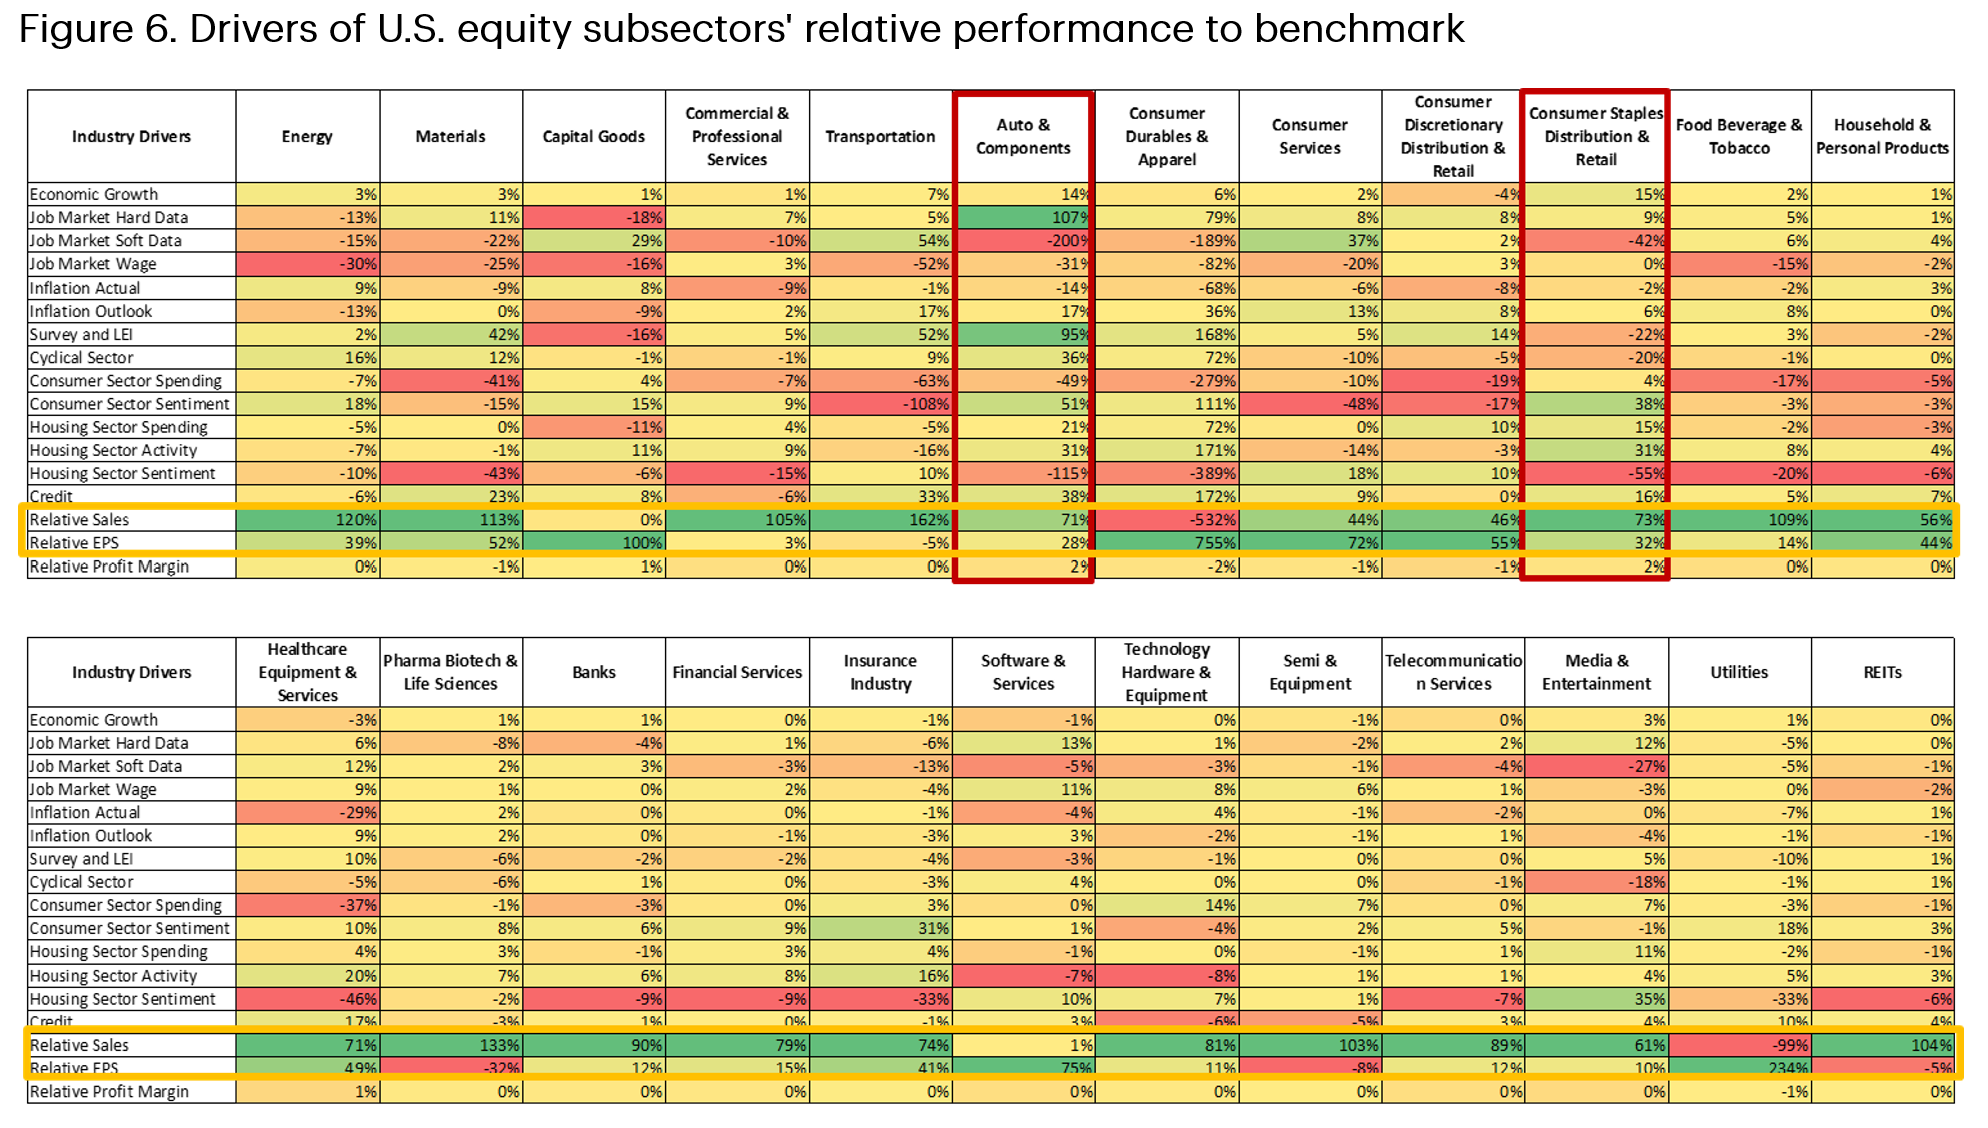
The model highlights that the relative performance of industries such as real estate investment trusts (REITs) and semiconductors & equipment are driven more by equity fundamentals rather than macroeconomic variables, with 81% and 78% of the movement in the subsector, respectively, explained by relative sales and EPS. On the other hand, industries that are more sensitive to the business cycle, such as auto, consumers, and transportation, attributed only 11% to 28% of their relative performance to equity fundamentals.
Take the example of auto & components – industry with the highest explanatory power driven by macroeconomic variables based on our model. Auto is one of the industries that tend to do well in early phase of the business cycle, when the economy has just gone through recession and on a renewed upswing. Improvement in the hard data of job market category would be positive for the subsector but increase in the soft data on job market on average contributed negatively to the subsector’s relative performance as the indicator tends to surge prior to actual improvement in the hard data category (Figure 8). The same logic goes for housing sector sentiment.
Another example is consumer staples distribution & retail, which is a defensive industry that tends to be countercyclical and outperform when the economy is deteriorating. The subsector constituent includes Walmart (44% of the subsector), Costco (41%), Kroger (4%), Target (4%), Sysco (4%), Dollar General (2%), and Dollar Tree (1%). Note that an improvement in cyclical sector indicator and survey & leading economic indicator bode negatively for the defensive subsector relative performance – highlighting the defensive or countercyclical nature of the subsector.

For each of the 24 subsectors, we derived a fair value estimate of where the subsector should trade relative to the benchmark, as shown in Figure 9. This fair value estimate will become the backbone of the Quantitative Subsector Rotation Strategy (QSRS). For backtest purpose, we use 12% deviation from fair value as the threshold for overweighting and underweighting the subsector. This process is repeated at the end of every month, resulting in a dynamic OW/UW recommendation shown in Figure 10.

Subsectors with UW recommendation are assigned 33% of their respective benchmark weight, with the sum of all the UW subsectors being distributed to subsectors in the OW category in proportion to each subsector’s weight relative to the total OW basket. If there is no subsector in OW category, the weights are distributed to subsectors in the neutral category. Figure 9 shows the 24 subsectors’ deviation from fair value alongside the OW/UW relative to the S&P 500 benchmark.
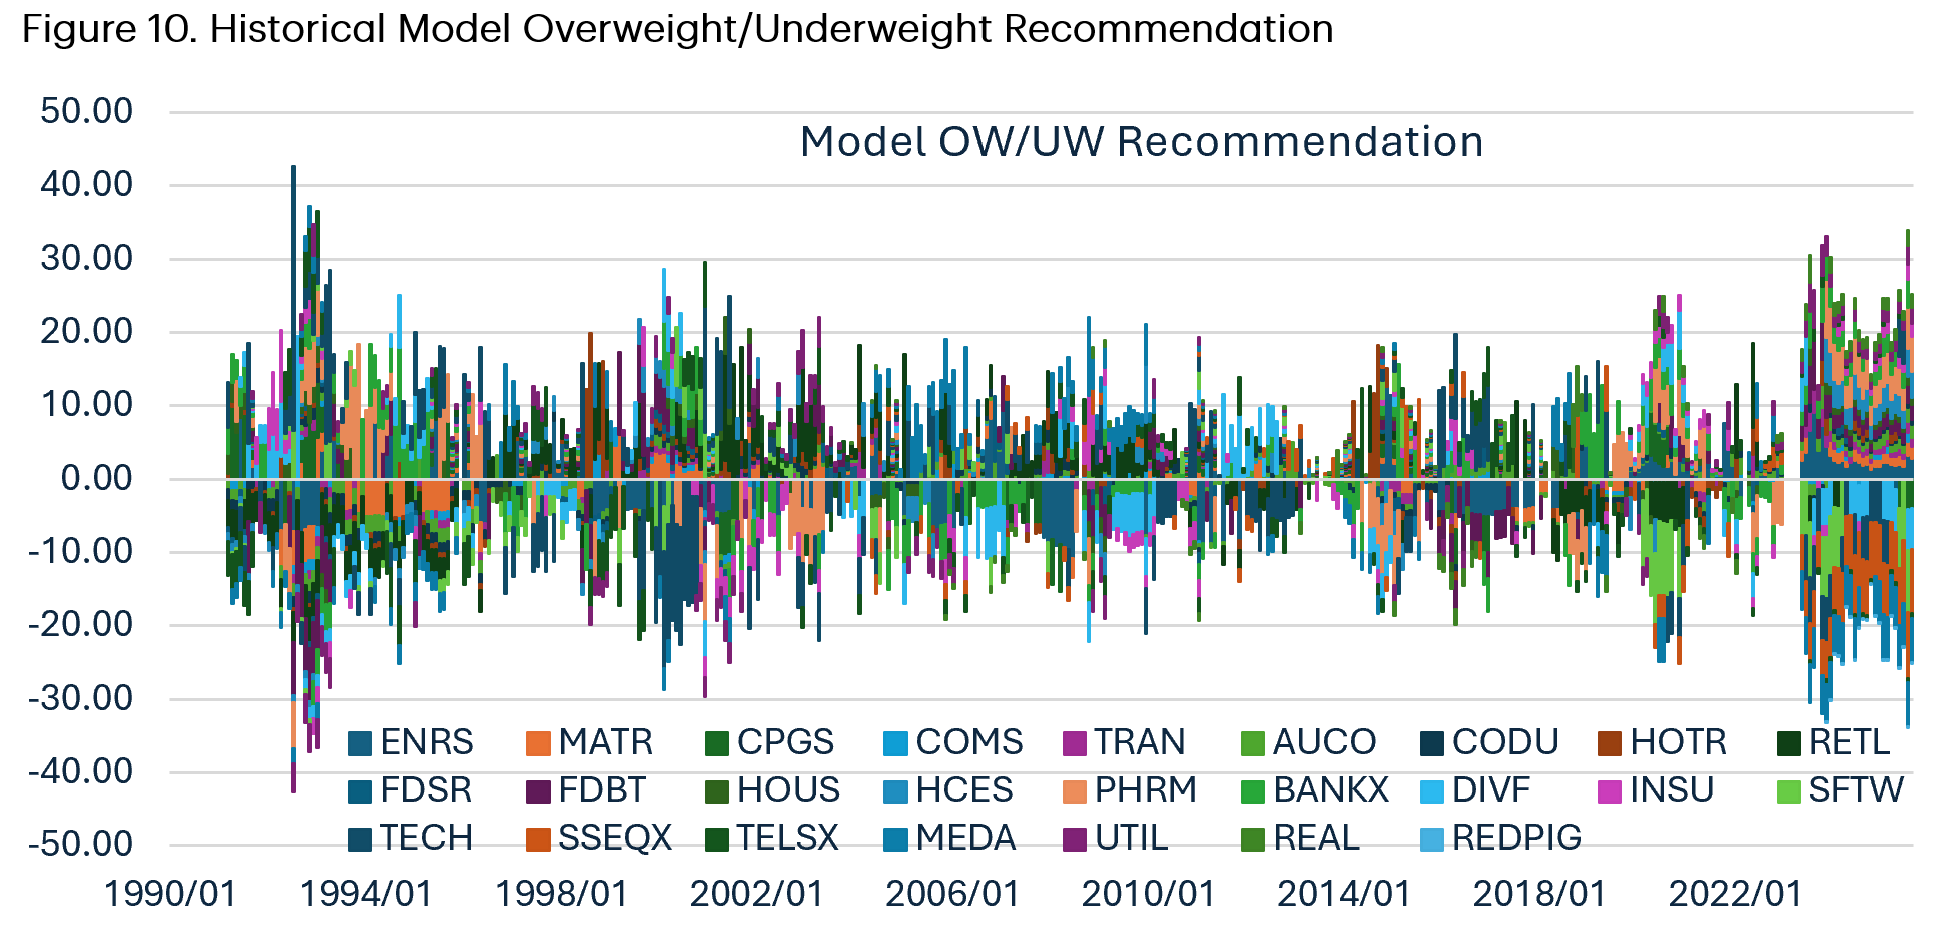
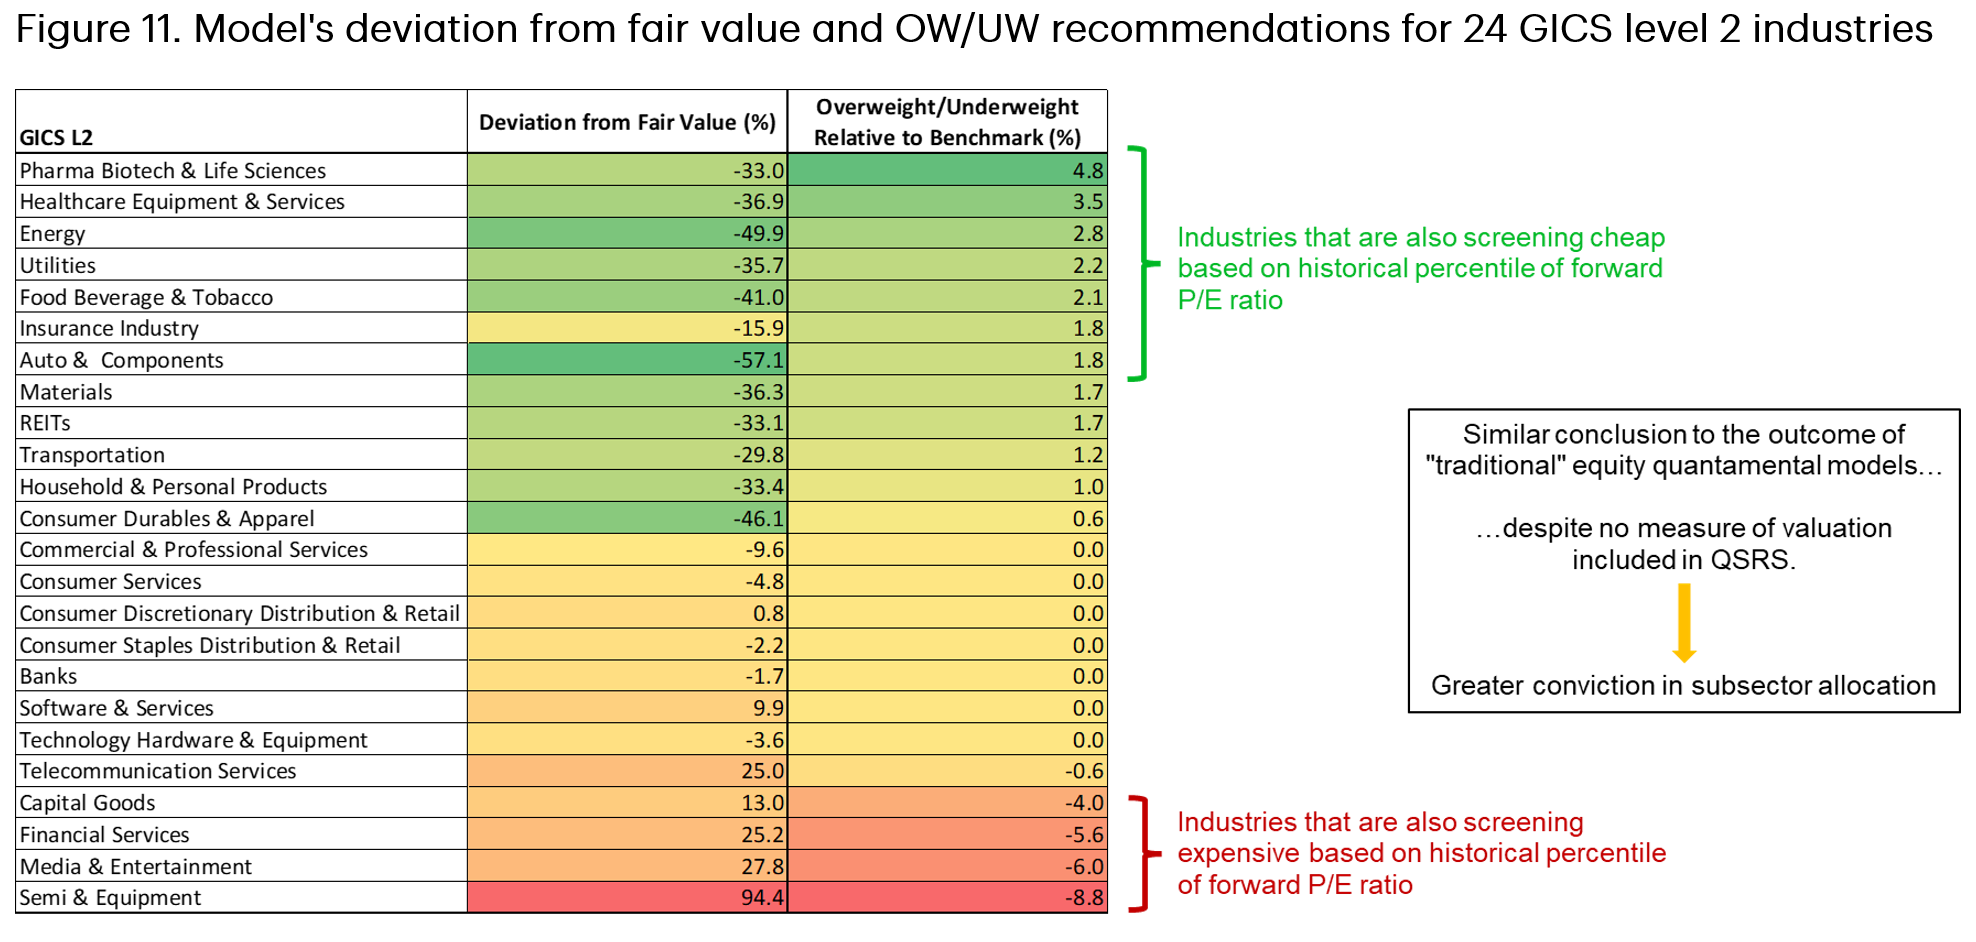
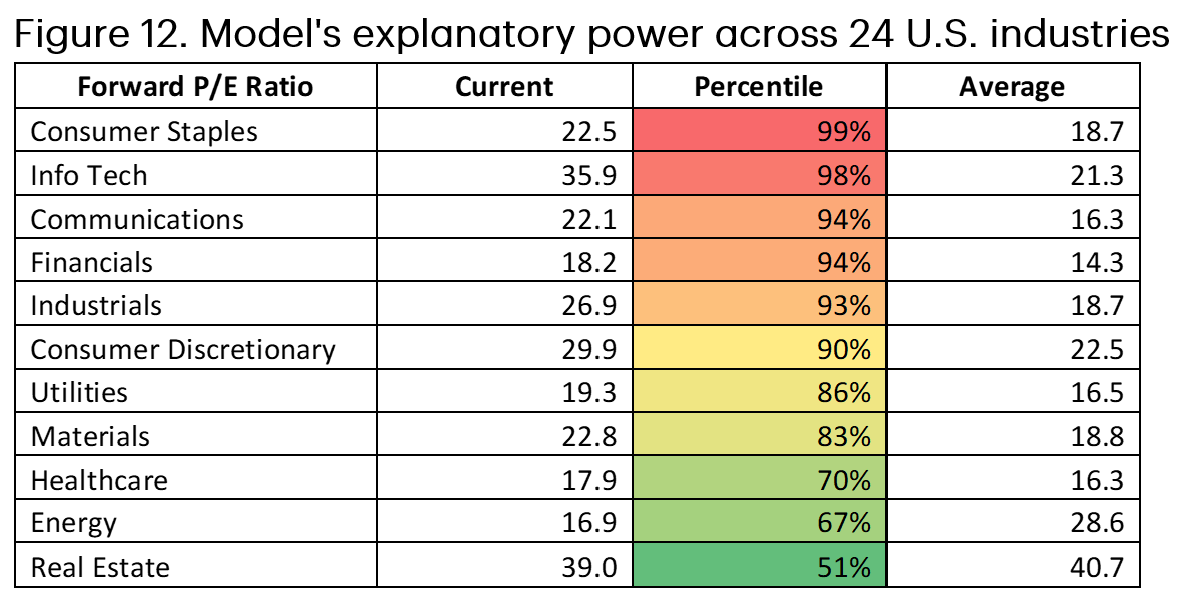
Figure 11 outlines the model’s deviation from fair value and the overweight/underweight recommendations. Healthcare (pharma, biotech & life sciences and healthcare equipment & services), energy, and real estate rank favourably (as of September 2025), at a time when valuation for the sector also screen cheap (Figure 12). This is interesting finding for us given that the QSRS does not utilize any valuation metric as its independent variables. For discretionary managers, the model could help in identifying potentially attractive trade ideas (long stocks in subsectors that screen cheap and short stocks that screen expensive).
We backtest this strategy for a long-only portfolio and found relatively consistent outperformance over time – before accounting for transaction cost and slippage – translating into 2.05% alpha annually over the span of 35.6 years (Figure 13). The model portfolio delivered 10.8% annualized return during the same period compared to 8.7% for the S&P 500 while maintaining similar level of volatility (15%).

Conclusion
There is tremendous value in incorporating macroeconomic data for managing active equity portfolio. For almost half (11/24) of GICS level 2 sector, macroeconomic variables could explain more than 50% of these subsectors’ relative performance to benchmark. The Quantitative Subsector Rotation Strategy (QSRS) was able to explain the link between various categories of economic data and subsectors’ relative stock price. This gives analysts and portfolio managers a framework for interpreting economic data releases to active sectors and stock selection in their equity portfolio. For discretionary managers, QSRS is another tool to highlight subsectors that may be over/undervalued based on the state of U.S. economy at the time. For systematic managers, QSRS could be further enhanced by tweaking the basic parameters and incorporating alternative datasets such as high-frequency restaurant and airplane booking, credit card utilization, twitter sentiment on certain themes, etc.
