In last month’s piece we suggested that the U.S. labour market and economic growth have likely grown at a below-trend rate:
“Below the surface, however, we are watching for the crosscurrent in U.S. labour market data that is the Achilles heel of America’s consumer-driven economy. The 3-month moving average of non-farm payroll gains have dropped from 274k at the end of 2022, 199k in 2023, 182k in 2024, and 135k currently. Between 2010 and 2019, the U.S. economy added on average 180k jobs every month. Our point here is that the pace of job creation in the U.S. economy has dropped to below trend level. Moreover, majority of the revisions for non-farm payrolls have been to the downside since 2022, which historically coincided with periods of below-trend GDP growth.”
The release of July’s jobs data vindicates that view. Whereas in June the non-farm payroll gains were estimated to still average 135k on a 3-month rolling basis, this number dropped to 35k in July. First, the payroll figures for the month of May and June were altogether revised lower by 258k. Second, the U.S. economy is estimated to add “only” 73k jobs in July – a much slower pace compared to in the last six months – all attributed to the jobs addition in healthcare and social assistance industry. Figure 1 shows that the breadth of job gains has deteriorated further with only 47% of industries reporting net job gains, far below the normal range of 60% to 80%. Over the past three months, all jobs added in the economy is concentrated in government, education, and health services – sectors that are less sensitive to the business cycle.

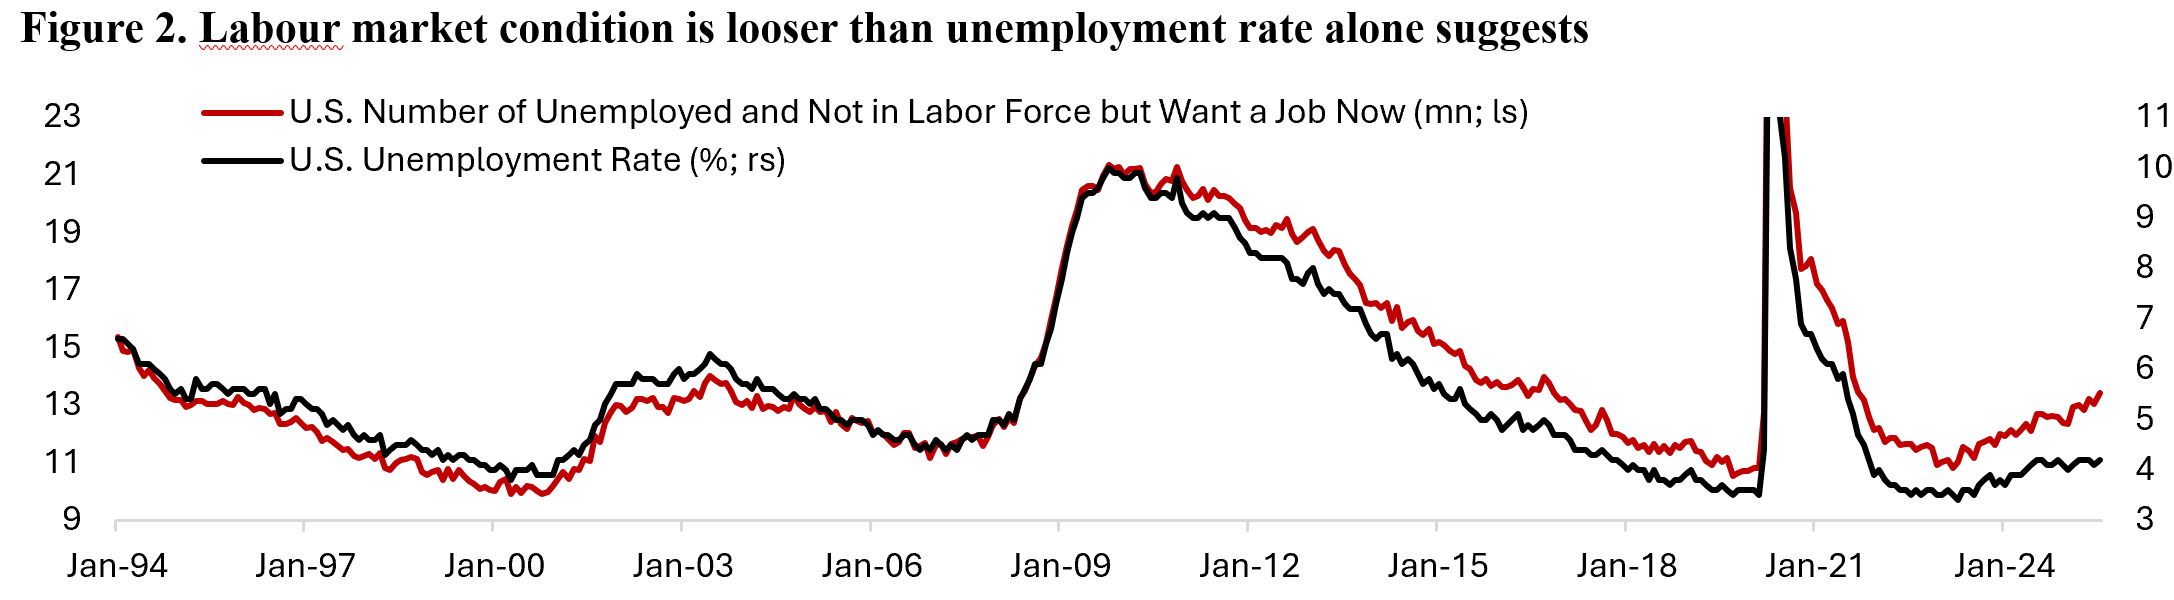
Are we on the brink of a labour cycle in the U.S.? Following a freeze in hiring, historically it does not take long for unemployment to start ticking higher, which is indeed happening but does not show up in the unemployment rate figure amid lower trend in labour force participation rate. Figure 2 shows the divergence between the official unemployment rate, which has been stable around 4%, and the number of people categorized as unemployed (7.24 million) plus those not in the labour force but want a job now (6.18 million). The later has been rising to 13.4 million in July from 10.8 million in March 2023 and is perhaps more representative of the slack in U.S. labour market.
The first read on U.S. Q2/25 GDP growth figure is also supporting our thesis that economic growth has fallen to below trend. U.S. headline GDP grew 3% q/q annualized compared to -0.5% in the first quarter, beating 2.4% consensus expectations. A closer look under the hood, however, shows that the headline figure in Q1 and Q2 were heavily skewed by the impact of tariffs front running. Net exports plus change in inventories was a -2.02% drag to headline GDP in Q1 but reversed into a 1.82% tailwind in the second quarter. Our estimate for underlying domestic demand (consumption and investment) in the second quarter is around 1.14% q/q annualized, which mark a slowdown compared to in previous quarters. This is in line with commentaries of some companies below, especially those in the consumer staples and discretionary sector, which corroborates the view that consumer spending has shifted lower and is contracting on several discretionary segments.
The bull case going forward is that the Atlanta Fed GDPNow currently still holds up well with underlying domestic demand growth estimated to be around 2.05% (Figure 3), which perhaps suggest that the weak Q2/25 domestic demand was skewed lower by the heightened trade policy and geopolitical uncertainty. To counter that, the bear would point to the decline in economy-weighted manufacturing and non-manufacturing PMI that highlight the possibility that the U.S. economy is stalling.

Takeaways from Earnings Season
As the earnings season unfolds, three unifying themes emerged so far:
- Tariffs uncertainty,
- Consumer spending slowdown,
- Investment on AI.
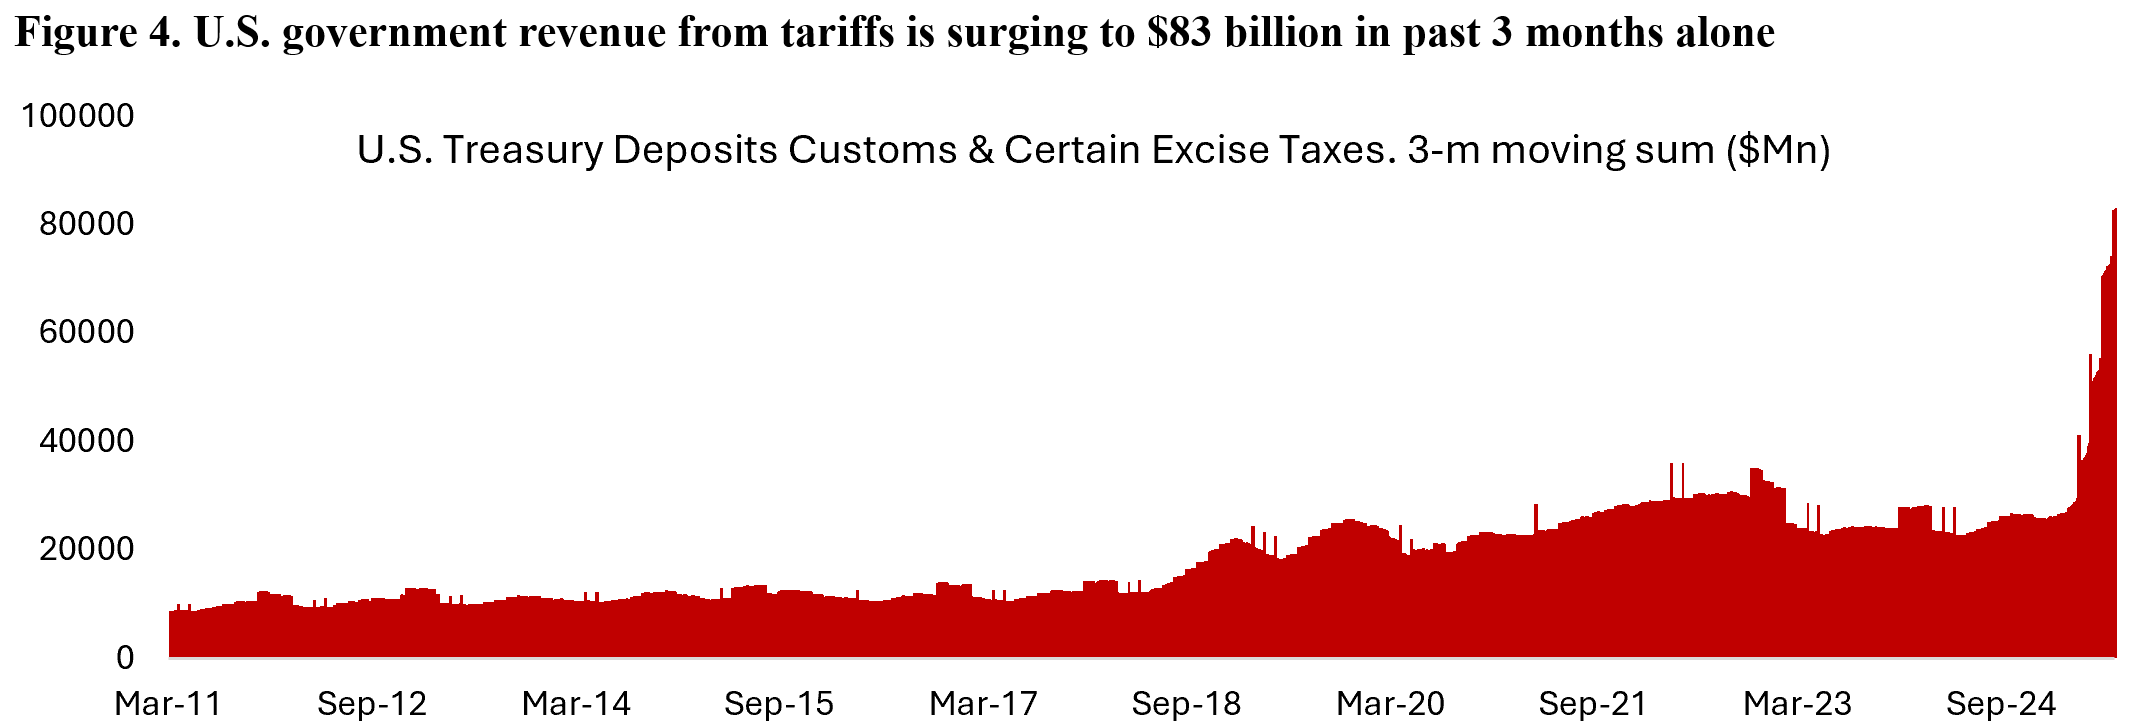
Below, we compiled select commentaries from U.S. companies related to these themes. The sector most heavily impacted by tariffs is probably the auto industry, which has been suffering from increasing labor cost, slowing demand, and fierce competition. The impact of tariffs is not only through higher input cost, but also in lost revenue. For the full year, Ford lifted the higher range of its projected hit to gross revenues from tariffs by $500 million, to $3 billion. Ford said it took $800 million hit in the second quarter resulting from tariffs while General Motors said it cost them $1.1 billion, with the full year impact estimated around $4-5 billion. This mirrors the sharp increase in U.S. government revenue from duties (tariffs), which rose to $83 billion in the past three months alone (Figure 4). Essentially, tariffs revenue is coming out of the pocket of consumers through higher prices, companies through lower profit, and also suppliers of material and semi-finished goods through lower selling price. Outside auto, tariffs impact could also be seen in other goods category including iPhones where Apple said that tariffs cost impact for the most recent quarter estimated around $1.1 billion or 3% of earnings.
Many of the deals recently announced by the U.S. highlights a lower tariffs rate than those announced earlier in April, but the point remains that a minimum of 15% tariffs rate is here to stay. The average of U.S. tariffs will still be 4-5 times higher than at the beginning of the year. For instance, the U.S. most recent deal with the EU, which end up with 15% tariffs on EU goods imports, is seven times the 2% rate at the beginning of year but is lower than the 30% rate threatened previously. European steel and aluminum will face higher tariff rate while the fate for auto and pharma remains undecided.
In the Federal Reserve’s survey conducted in early May, U.S. manufacturers said that the cost of their tariffed goods had increased by around 20% compared to six months prior, while service firms reported 15% cost rise. About three quarter of businesses that saw tariff-induced cost increases passed along at least some of these higher costs to their customers by increasing output prices. Almost a third of manufacturers and about 45% of service firms reported fully passing along all tariff-related cost increases (Figure 5). PPI inflation will most likely rise in the coming quarter as a result.

Disruptive Tariffs Impact
- General Motors: Q2 results ahead and company reiterated FY guidance; however, some scrutiny surrounding NA margin/EBIT miss with takeaways highlighting more onerous tariff impact; also guided for higher tariff impact in Q3 vs Q2 and said 2H volumes will be seasonally lower than 1H; China performance a bright spot.
- Whirlpool Corp.: Q3 EPS and revenue missed with weakness in Asia and LATAM though NA was better; full-year EPS guidance lowered while revenue outlook reaffirmed; company noted Q2 was impacted by competitors stockpiling Asian imports into the U.S.
- Newell Brands: Q2 EPS and revenue in-line; net sales down 4.8% y/y; margins improved; Q3 guidance missed while FY25 outlook lowered due to higher tariff costs on inventory; company is estimating an incremental cash tariff cost, compared to 2024, of ~$155M.
- United Parcel Service: Q2 operating income and EPS a touch light on softer margin performance (despite better US volumes and pricing) though revenue better; not providing FY revenue or operating profit guidance, citing current macro uncertainty.
Positive AI Capex Trend
- Alphabet Inc.: takeaways focused on AI tailwind and higher capex. Q2 EPS beat, revenue ahead with upside in Search, YouTube, and Cloud segments; operating margin weaker, tabbed to increase in capex; management also raised FY capex forecast by $10B to ~$85B; analysts positive on Cloud acceleration, Search revenues holding up alongside AI transition.
- Meta Platforms: Q2 results and Q3 guide much better than expected; sales growth accelerated to +22%, operating income beat by nearly 20%, ad impressions grew +11%, pricing was up +9% and overall video time increased 20%; takeaways largely focused on the AI tailwind for both engagement and ads; narrowed FY25 capex guide but initial outlook for FY26 suggests a ~$30B ramp toward $100B.
- Microsoft: Fiscal Q4 results ahead; takeaways largely focused on Azure, which increased +39% y/y cc, beating consensus expectations by ~450 bp; accelerated cloud migration the big tailwind; Street also positive on guidance for +37% Azure growth in fiscal Q1 and noted that Azure still experiencing supply constraints.
- Reddit: Q2 earnings and revenue beat driven by strong digital ad growth in US fueled by its AI-driven marketing tools and improving user trends; ad revenue growth accelerated to +84% Y/Y; DAU and ARPU also beat; margins in-line; Q3 guidance ahead of consensus.
Consumer Spending Trend
- Norwegian Cruise Line Holdings: Q2 EPS in-line, revenue a bit below though company kept annual profit target intact, helped by rebounding demand for cruises; CEO highlighted bookings now ahead of historical levels in recent months and continued strength in onboard spend.
- Columbia Sportswear: Q2 results ahead but domestic trends still soft and takeaways focused on expected 2H slowdown and concerns about elevated tariff headwinds in 2026 and SG&A deleverage.
- Hilton Worldwide Holdings: Q2 EPS, EBITDA, revenue all beat; raised FY25 EPS guidance, see RevPAR flat to up 2% y/y; management said it sees tailwinds from better growth in intermediate term, low industry supply growth; analysts said disappointing Q2 RevPar driven by macro headwinds, Q3 guidance underwhelmed.
It is important to note, however, that the distribution of consumer spending is not even. Commentary from Bookings.com second-quarter earnings call highlight the bifurcation between the higher-income cohort vs the rest:
“We see generally top end of the U.S. consumer market will be a little stronger, spending more in the 5-star hotel category, spending more on international travel, including Europe. You would say, Europe is much more expensive now with the exchange rate of euro/dollar, but still at the high end, people are traveling to Europe and are spending. We see at the lower end, more careful behavior of US consumer. That is more where we see the pressure on the domestic travel, on the lower star rated hotels. So there is definitely a little bit more of the negative behavior that we see in terms of impact to the US consumer. If you look at other parts of the world, actually, Europe is holding up quite well. We see Europeans booking earlier. They are booking at higher prices than a year ago. And Europeans clearly continue to prioritize travel as a part of their discretionary spend over other categories. So that is, I think, clearly positive.”
Also, from Procter & Gamble earnings call:
“What we are observing is that the consumer, on both ends of spectrum, the lower-income consumer and the higher income consumer, they are reacting to the current volatility they are seeing and they are observing, and we see consumption trends consistently decelerating, not significantly, but we see a deceleration in the U.S… So consumers are a bit more careful in terms of consumption. They are using up pantry inventory and they are looking for value, either in smaller packs and promotions or in larger pack sizes in the club channel and online. That’s the behavior we’ve been outlined before, but it’s not stopped.”
The divergence in discretionary spending growth between the top 10th percentile and the rest is obvious among the stock price and top-line growth of luxury and clothing retailers we follow (Figure 6). In general, producers of aspirational branded goods, athletic clothing, and shoes have seen significant headwinds on top-line growth. Meanwhile, brands that cater to the top 10th percentile income did better. Hermés, the maker of Birkin bag, reported a 10.3% y/y revenue growth over the past year while Kering, the owner of Gucci and other brands, continue to see slowdown across its businesses and saw revenue falling 14.6% y/y during the same period. Interestingly, Hermés also said that it was seeing fewer first-time clients and that aspirational shoppers were shopping less frequently. Louis Vuitton Moet Hennessy also see weaknesses across its leather goods segment with overall revenue falling 4% y/y. Interestingly, spending on luxury is moving towards jewelry and watches with Richemont seeing 4.8% y/y growth, supported by growing sales in America and Middle East but still softer trend in APAC. The relative weakness in Asia is perhaps unsurprising given the lackluster Chinese economic growth.

And as we know, the distribution of income matters more than the aggregate size of income in the economy given lower propensity to spend among higher-income cohorts. This makes the nature of OBBBA potentially a headwind for economic growth as lower-income households no longer has the ability to increase or even maintain their spending without going to debt, while higher-income households may not be compelled to increase their spending. Yale Budget Lab estimated that the bill impact on household incomes will be regressive, as the proposed $4.5 trillion tax cuts is partly funded by cuts to healthcare spending and a food assistance program. Healthcare spending is set to be reduced by more than $1.1tn over the next decade, potentially increasing the number of Americans without health insurance by 11.8 million. In addition, the spending cut on food assistance program will translate to $186 billion (16%) savings by the government. Figure 7 shows that for the lowest-income households, the combination of tax changes and welfare cuts would drag down after-tax incomes by 2.3% ($560). In contrast, the top 1% of household by income would see a net increase of 2.1% ($32,265).

With that said, the average of American household balance sheet today is in a much better shape compared to fifteen years ago. Middle and high-income consumers are not concerned about their ability to pay their bills as employment have not worsened to the point where their earning capacity is jeopardized. Only those earning less than $50.000 a year are increasingly worried about meeting their debt obligation, which largely contributed to the sharp increase in auto and credit card delinquencies to the highest level since the GFC.
The good news is that OBBBA will help offset the drag in economic activity from trade war uncertainty and has potential to skew growth higher into the end of 2026. A more stable tax and regulatory backdrop can support business confidence, and accelerated depreciation on capital expenditure likely spur another capex cycle for U.S. businesses.
Currently, financial conditions are loose and hedging cost is cheap. And consider this backdrop comes at a time when the Federal Reserve has yet to resume its policy rate cut. With few economic opportunities for investment, this excess liquidity is stuck in the financial market and driving valuation higher across the board (Figure 8). However, we think the rally in gold is over, as gold price relative to global money supply is nearing the peak based on historical cycles (Figure 9).

Copyright © 2025, Putamen Capital. All rights reserved.
The information, recommendations, analysis and research materials presented in this document are provided for information purposes only and should not be considered or used as an offer or solicitation to sell or buy financial securities or other financial instruments or products, nor to constitute any advice or recommendation with respect to such securities, financial instruments or products. The text, images and other materials contained or displayed on any Putamen Capital products, services, reports, emails or website are proprietary to Putamen Capital and should not be circulated without the expressed authorization of Putamen Capital. Any use of graphs, text or other material from this report by the recipient must acknowledge Putamen Capital as the source and requires advance authorization. Putamen Capital relies on a variety of data providers for economic and financial market information. The data used in this publication may have been obtained from a variety of sources including Bloomberg, Macrobond, CEIC, Choice, MSCI, BofA Merrill Lynch and JP Morgan. The data used, or referred to, in this report are judged to be reliable, but Putamen Capital cannot be held responsible for the accuracy of data used herein.
