One of the common problems being a macro strategist is being accused of cherry-picking data to fit whatever narrative one is conveying at the time. Over the past two years, those with more negative view of the U.S. economy pointed to the depressing figures out of the industrial and cyclical sectors, while those with more positive view highlighted the strength in employment gains and consumer spending. Arguably, the gap between the bear and the bull has narrowed significantly today, with broad economic indicator continuing to soften even as U.S. equity market continues to march higher), driven primarily by the decline in employment gains and retail spending to levels that is in-line with trend growth.
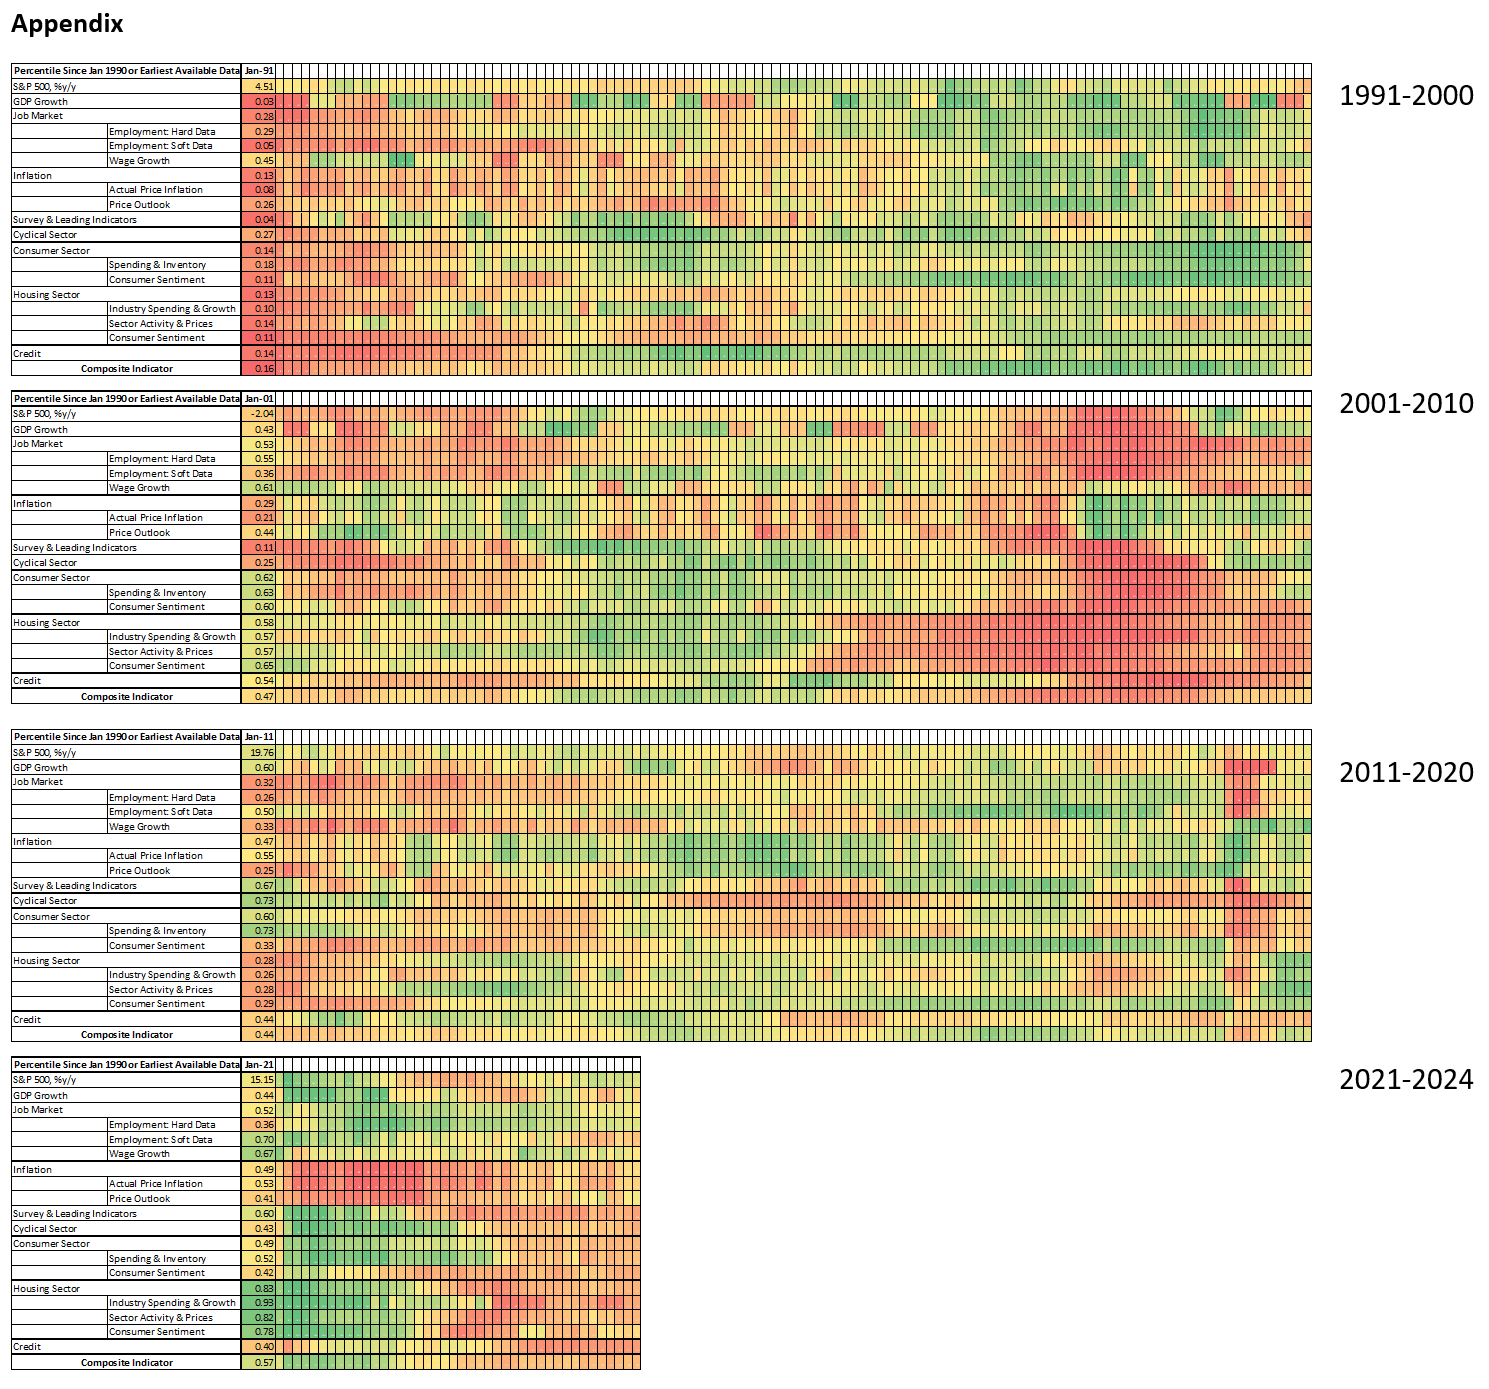
This month we are introducing an enhanced U.S. macro monitor based on all 119 release of U.S. economic data on either monthly or quarterly basis (see Appendix for details). Each data point is transformed either into %y/y or %m/m growth, or both, and then transformed into percentile rank versus its own history. We then classified all these data into eight main categories: growth, job market, inflation, survey & leading indicators, cyclical sector, consumer sector, housing sector, and credit. For each category, we divide the classification further into hard and soft data. Consumer sector, for example, is classified into spending & inventory that tracks actual consumer spending and inventories across channels, and consumer sentiment.
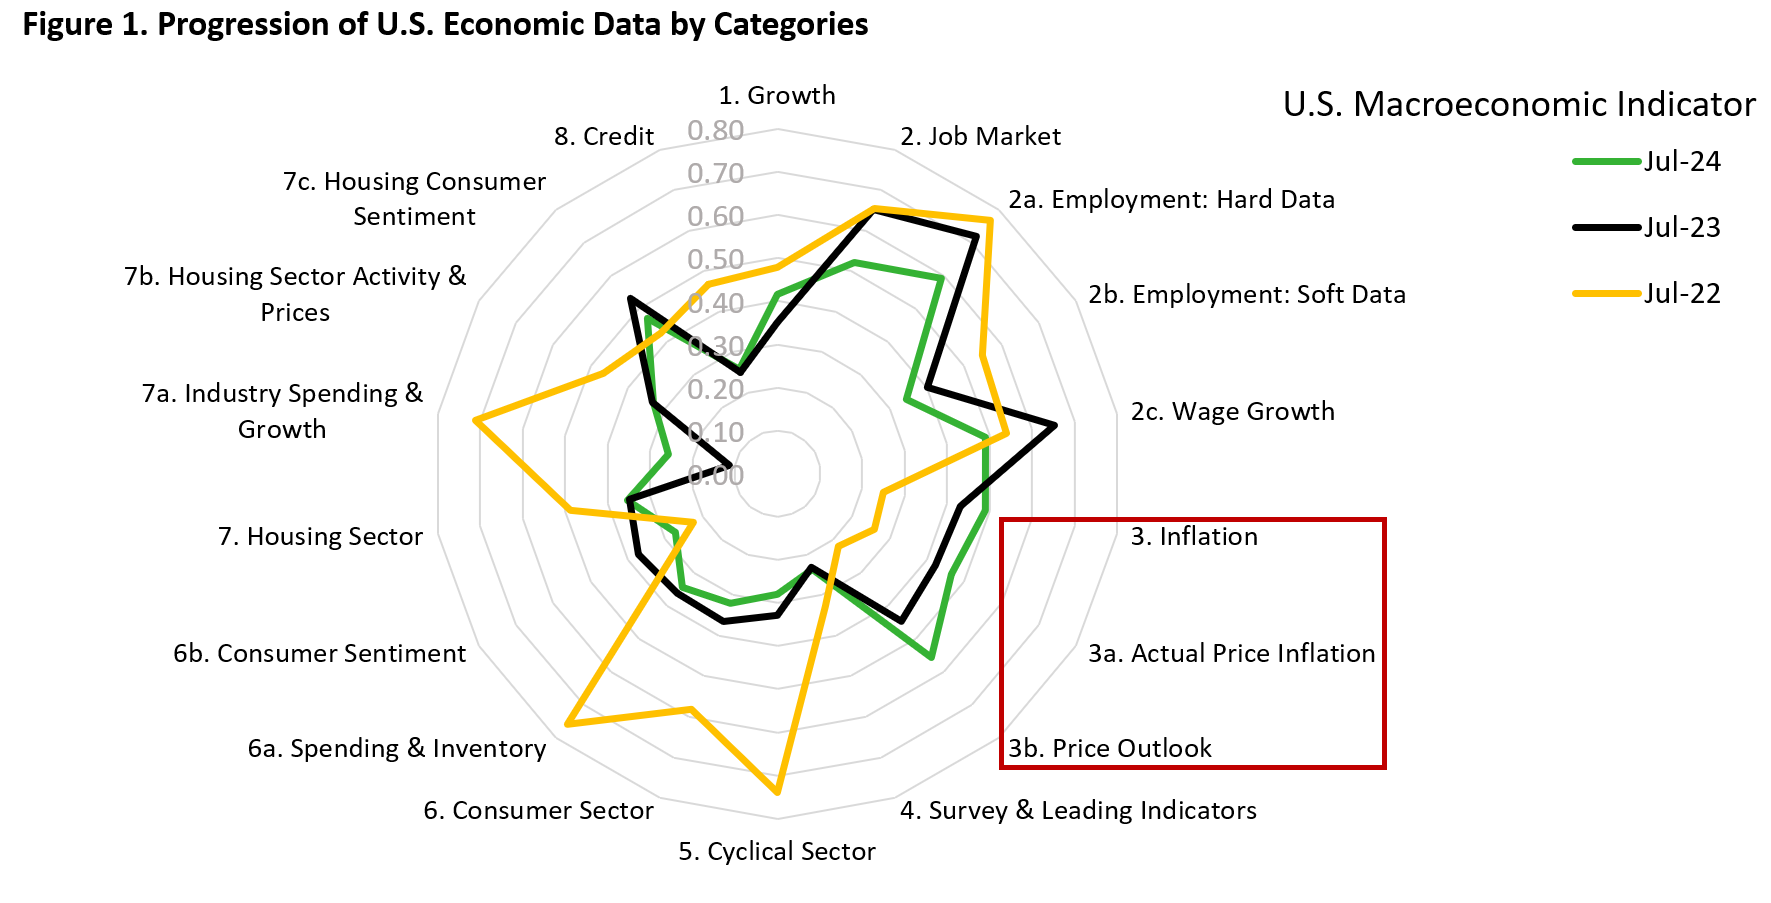
All these are summarized in Figure 1. Except for inflation, all categories have shrunk compared to in July 2023 and 2022. This reflects the improvement in inflation (lower) amid decelerating growth across U.S. economic sectors. There are several key takeaways.
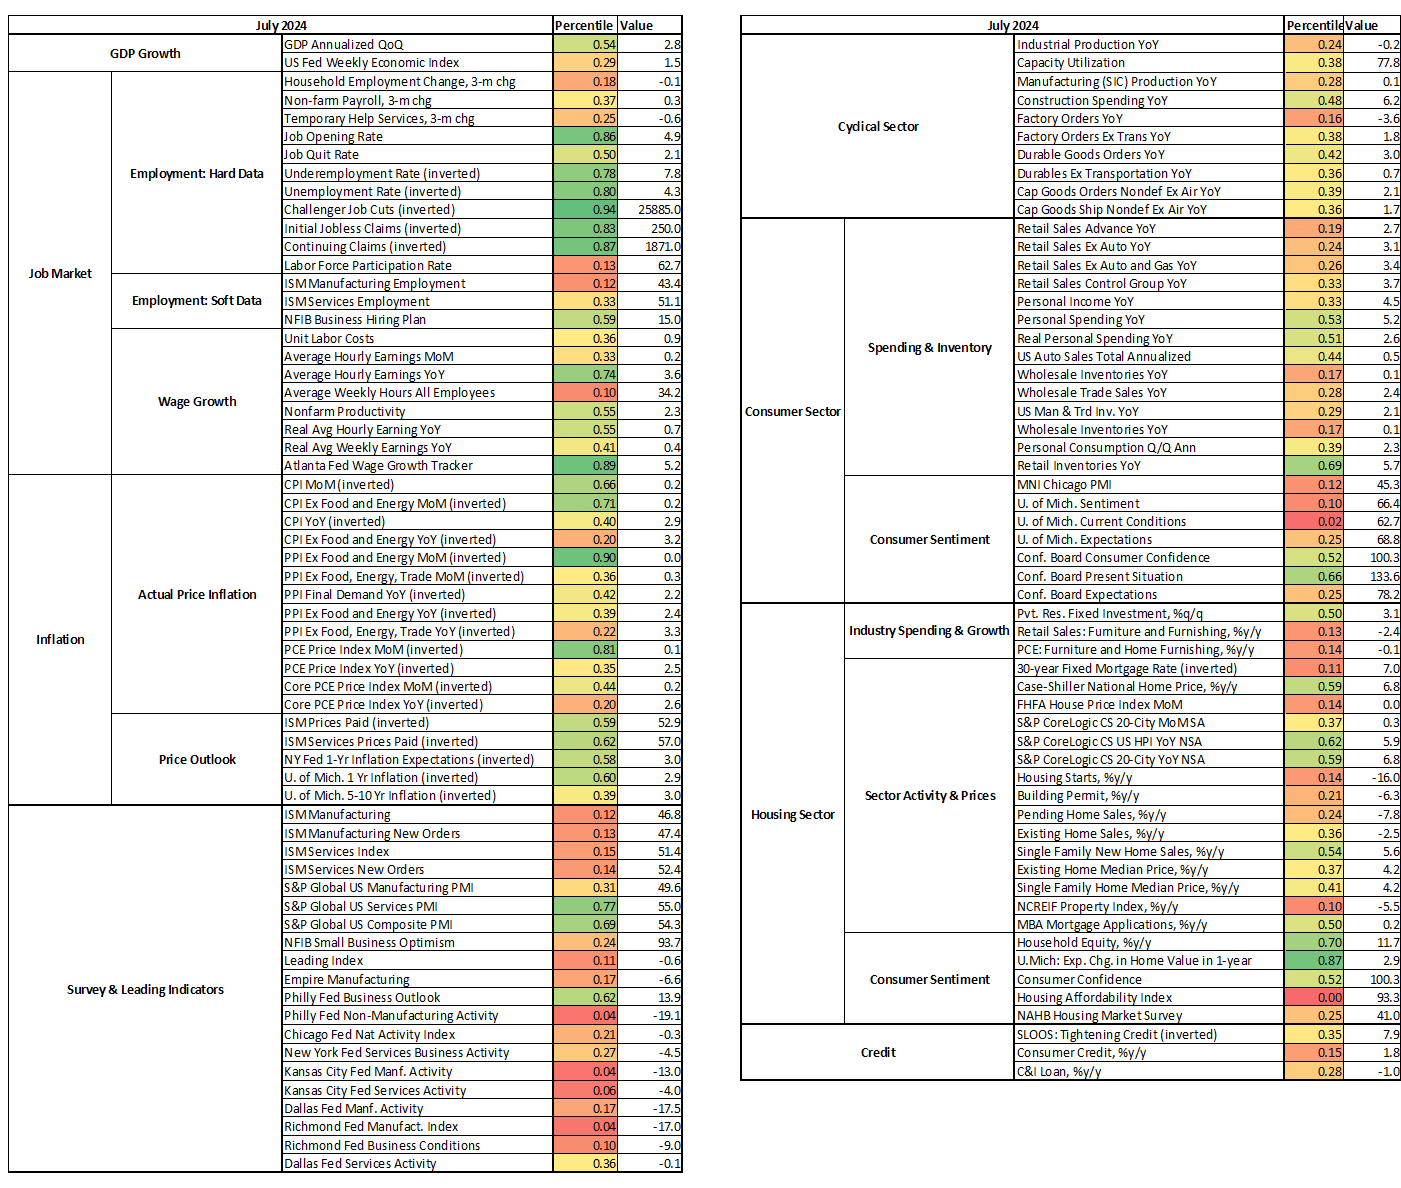
- On the growth front, U.S. economic growth has moved to 42nd percentile today, a slight improvement compared to a year ago (35th percentile) but lower compared to two years ago (48th percentile). This highlights that U.S. real economic growth has fallen to slightly below trend, albeit remaining healthy. The more forward-looking Federal Reserve Weekly Economic Index has fallen to 1.5% (29th percentile), weighing the most recent is U.S. real GDP growth at 2.8% q/q annualized (54th percentile).
- One area of remaining strength is the job market, which has declined but still at 52nd percentile. Hard data (actual employment) declined from 75th percentile in July 2022 to 72nd percentile in July 2023, and to 59th percentile currently. Note that the softening in hard employment data has been progressing faster over the past year. More worrisome is the outlook for future employment, which has fallen to 34th percentile from 55th percentile two years ago. Wage growth has also moderated to the 49th percentile. It is perhaps unsurprising that Chairman Powell, in a hint that policymakers are ready to begin cutting rates, acknowledged that “the labor market is no longer overheated, and conditions are now less tight than those that prevailed before the pandemic.”
- One notable improvement is on inflation, as measured by both actual price inflation and price outlook. Although actual price inflation remains too high (below the 50th percentile), its outlook has improved significantly to 56th percentile from 22nd percentile two years ago. This corroborates Chairman Powell speech on Jackson Hole noting that “confidence has grown that inflation is on a sustainable path back to 2%.”
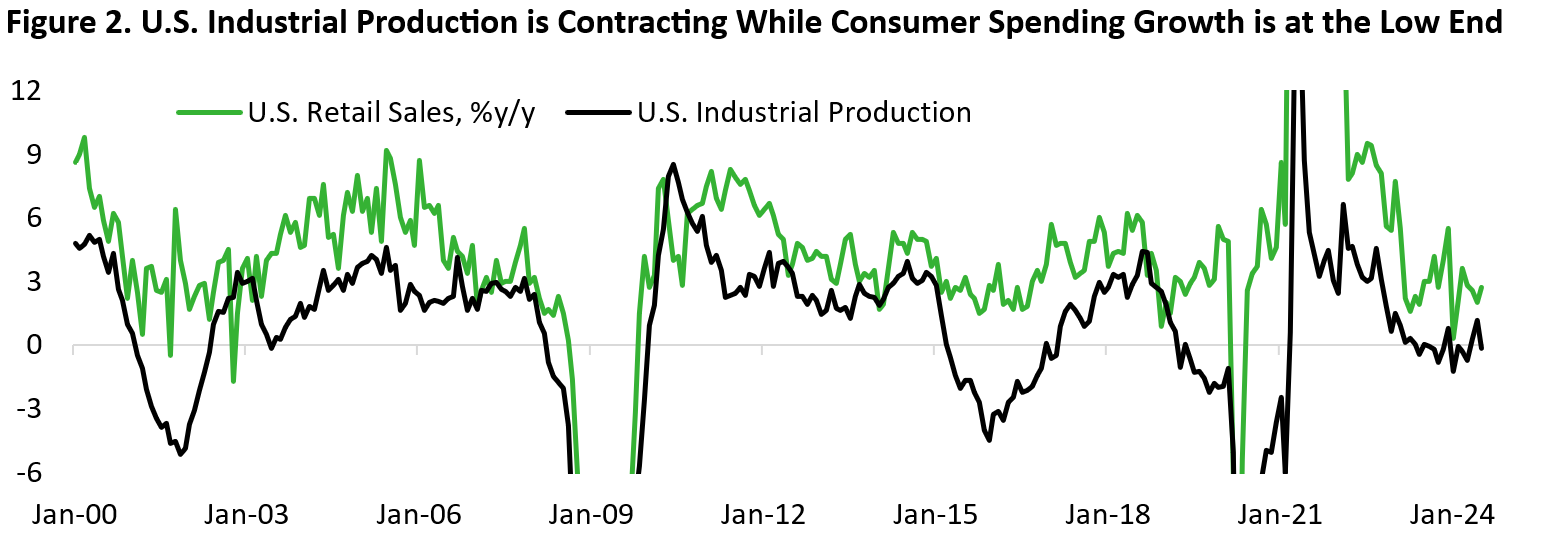
- In the cyclical sector, only two out of ten indicators are above the 40th percentile. Industrial production and factory orders have been contracting on annual basis, and capacity utilization is below historical average (Figure 2). With economic growth expected to grind lower and policy rate today still at an elevated level, it will likely take some time before capex spending accelerate.
- The story in the consumer sector is one of a convergence between spending intention and actual spending. Consumer sentiment has been and is still depressed at 23rd percentile. However, retail and personal spendings are falling further below historical average level. Most recent data shows retail sales ex-auto is growing 3.1% (24th percentile) vs trend nominal GDP growth of around 4%. Service spending, however, is boosting the personal spending growth to a healthy 5.2% y/y (53rd percentile). Other than the employment category, this is the segment worth monitoring closely as soft-landing requires both categories to stop decelerating sharply from current levels.
- Housing sector indicators are potentially close to a bottom (35th percentile). For instance, the industry spending & growth category has improved to 26th percentile from 10th percentile last year, driven by accelerating private residential fixed investment and rebound in spending of furniture and home furnishing sector. In addition, the outlook of lower mortgage rate should be a tailwind for the sector’s activity and housing prices.
- Lastly, credit creation is weak (26th percentile), unchanged compared to the previous year. Consumer credit is growing only 1.8% y/y – below nominal GDP growth – and commercial & industrial loans are contracting 1% y/y. This is supportive of the weak cyclical sector indicator, which includes capex spending by the corporate sector.
The bottom line is that we are still in the late stage of the U.S. business cycle where the cyclical and housing sector activity potentially close to a bottom and would benefit from the tailwind of monetary policy easing. Inflation continues to improve and the softening trajectory in U.S. labour market is concerning but is not yet a red flag. Economic growth should continue to decelerate from here, but hard landing could be avoided if the labour market does not deteriorate sharply going forward.
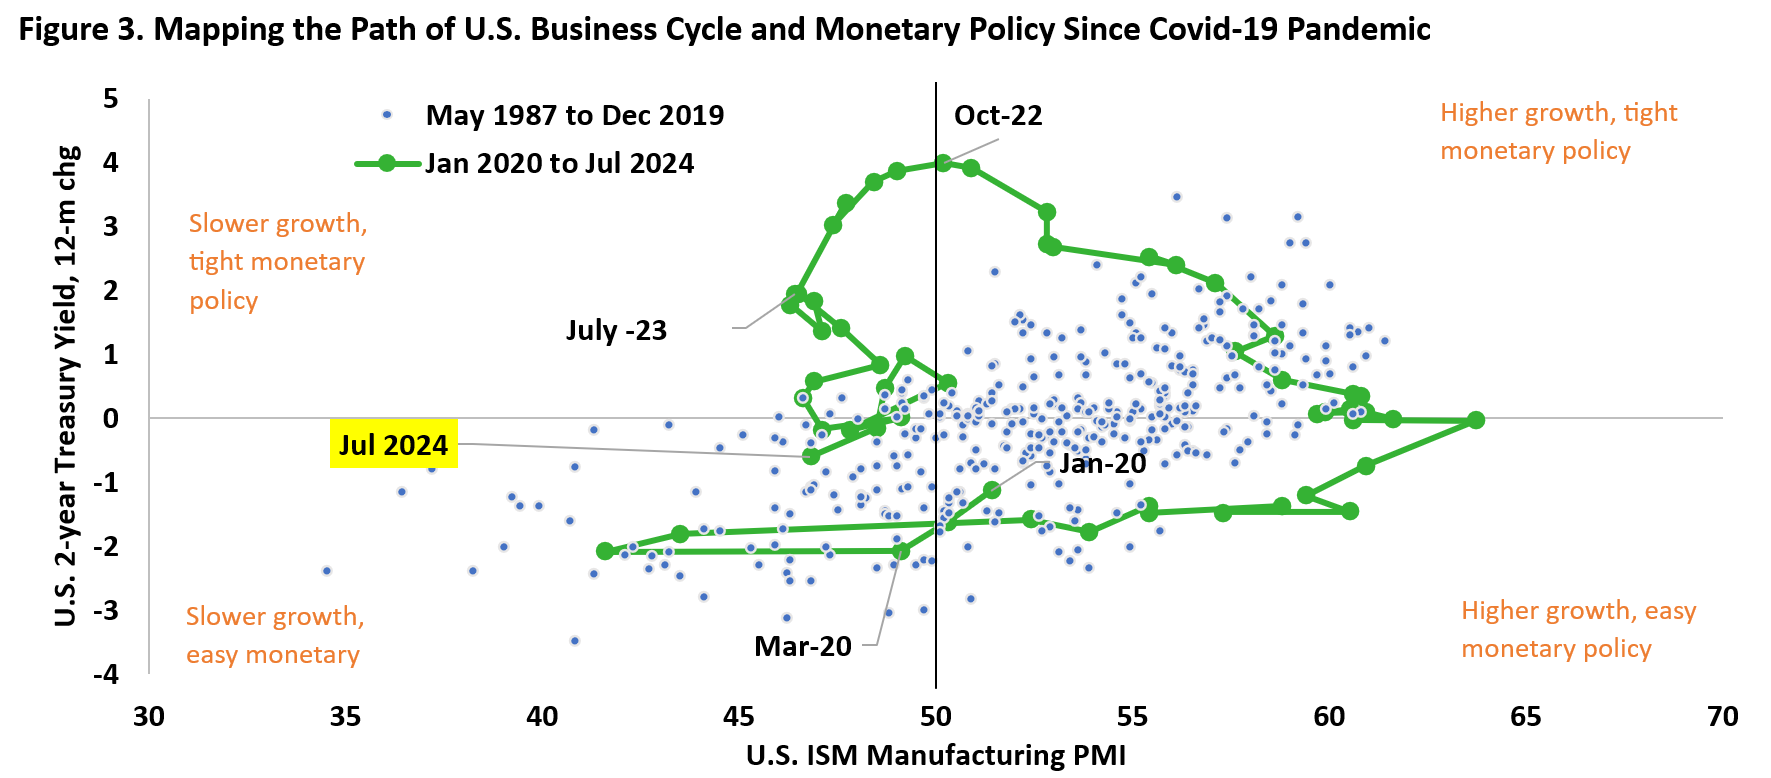
Since the pandemic began, we have gone almost a full circle from the slower growth and easy monetary policy period during the depth of covid-19 lockdown, to the sharp growth recovery in 2021 and most of 2022, and to the growth slowdown that continues today. Figure 3 shows the level of ISM manufacturing PMI, a proxy of the business cycle, and the annual change in U.S. 2-year treasury yield. Between 2021 and 2022, growth accelerated, inflation rose, and monetary policy tightened – all of which bode poorly for bonds. Today, however, we are in period where growth is expected to continue to slow and monetary policy is at the beginning of the easing cycle.
The relevant question today is how fast the Fed will dial monetary policy back towards neutral, which is estimated to be around 2.50-2.75%. With the Fed Funds Target rate still at 5.50% currently and the economy potentially already running slightly below trend, the Fed need to cut between 275 and 300 bps just to ensure monetary policy is not restrictive for the economy. Assuming a gradual approach of 25 bps cut every meeting, this translates to monetary policy becoming neutral only by the end of 2025. In our view, this gradual approach is too slow as growth and employment gains will likely already fallen below trend by then. The rate market today is partially reflecting that, with 30-40% probability of 50 bps cut in the upcoming FOMC decision.
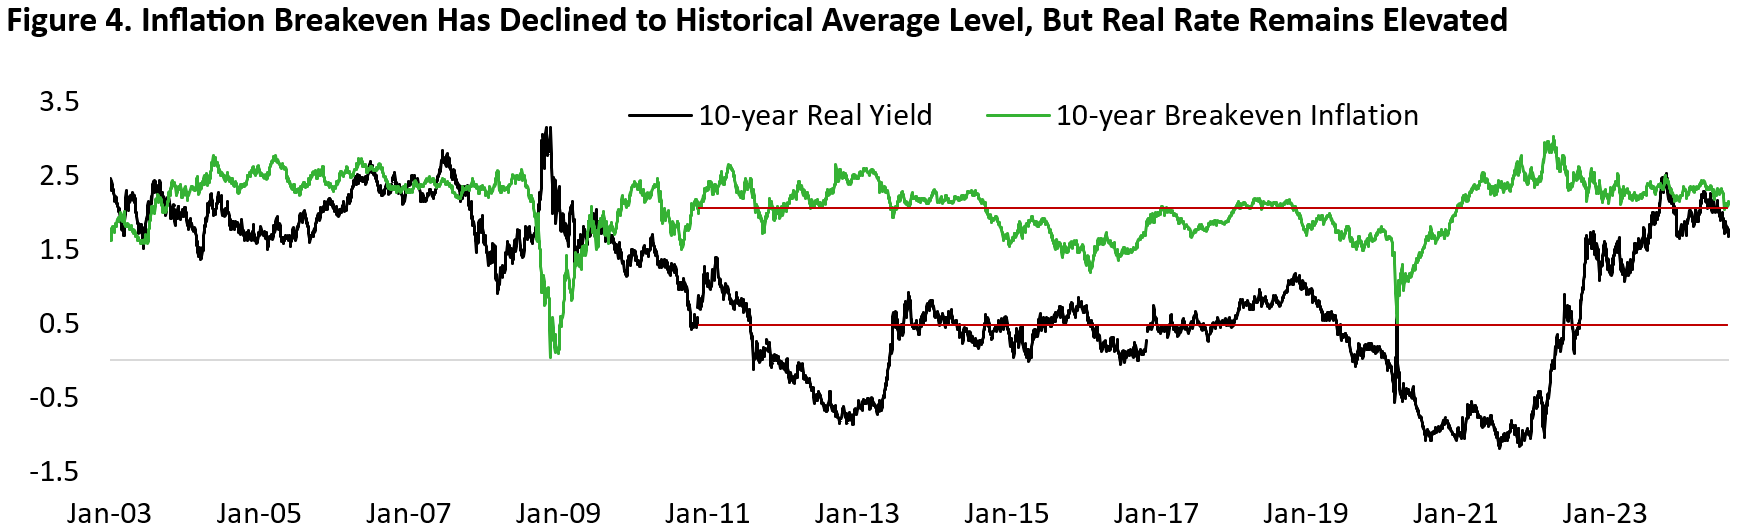
In addition, inflation breakeven has fallen alongside oil prices and consumer income expectation has crashed – both of which indicate the U.S. economy is no longer “hot” and reflect the believe that the job market, not inflation, is the main concerns for investors and policymakers today. With the 10-year breakeven rate at 2.15% today, it is close to the historical average of 2%. Meanwhile, real 10-year yield at 1.67% is still significantly higher than previous decade’s average of 0.5% (Figure 4). One could argue that U.S. economy’s neutral rate has changed since the pandemic, but structural demographic trend and continued global excess savings should still support, if not strengthen the case for lower global yields. We continue to see significant upside for long-term bonds, even in the case where nothing “breaks” in the financial market and the U.S. economy avoided a recession.
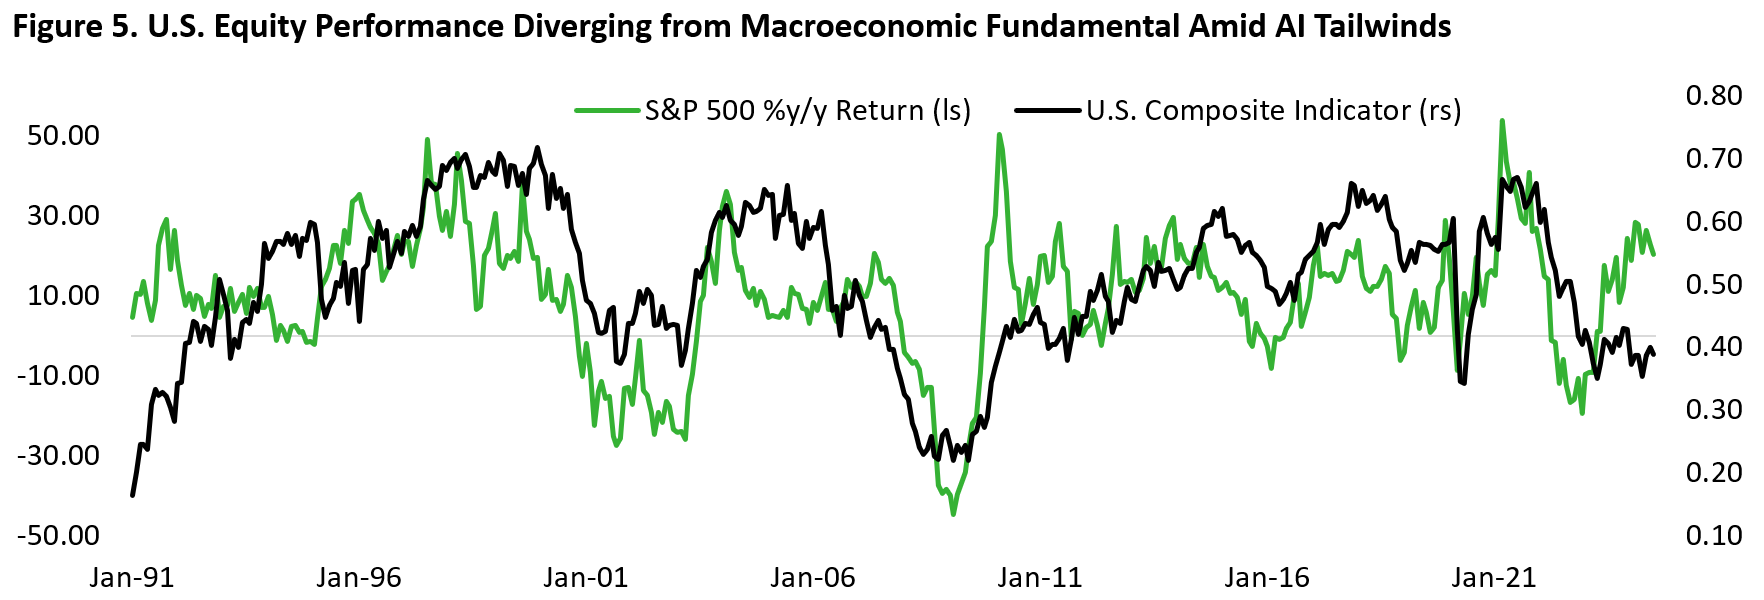
There are reasons why investors should not rule out a harder landing scenario. The yield curve is un-inverting (steepening), alongside rise in consumer expectation minus present situation – historically a decent predictor of U.S. recession. Meanwhile, Conference Board LEI has been contracting for 27 out of 28 months since March 2022 (February 2024 was flat, the only month where it wasn’t negative). Conference Board survey also saw the gap between jobs hard to get minus jobs plentiful continue to rise. Importantly, the majority of revision for jobs gain and retail spending has been to the downside. History shows that the U.S. economy could look strong on the surface up until just few months prior to the NBER recession date. Similarly, unemployment rate tends to rise like a J-curve in the late stage of business cycle that ended with a recession. As Figure 5 shows, the macroeconomic data has been lousy and diverging from the S&P 500 index performance over the past year amid the tailwind from anything AI.
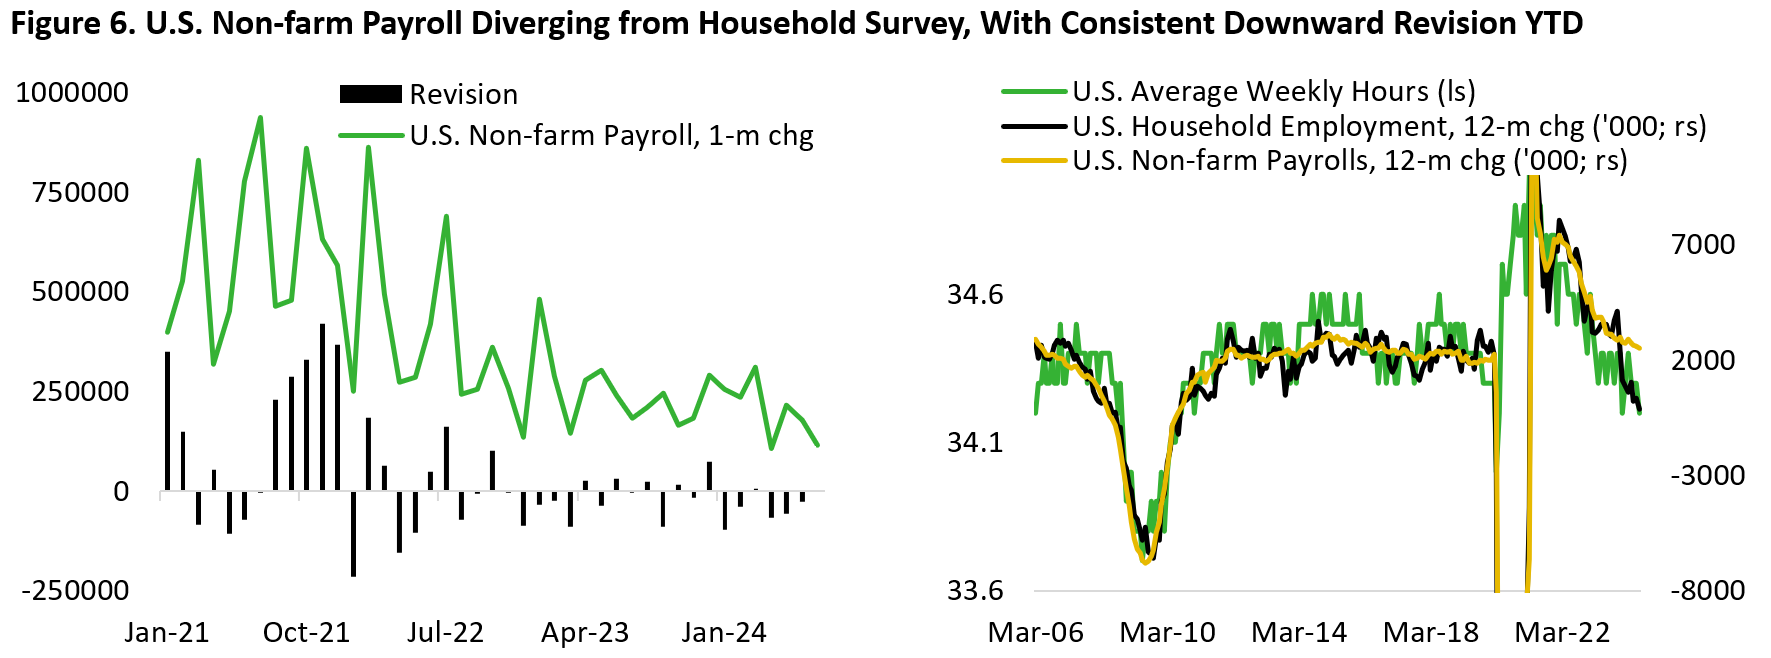
The release of Quarterly Census of Employment and Wages (QCEW) this month highlights the risk of U.S. data appearing seemingly strong, only to be revised downward afterwards. The survey indicates that BLS’s preliminary estimates of job growth attributable to the net of business births and deaths may have been overstated, with downward revision of 818k jobs between March 2023 and March 2024. It is likely that the overstatement could extend beyond March 2024 given the consistent downward revision of non-farm payroll numbers seen throughout this year. If correct, that would explain the current gap between the establishment (NFP) and household survey published by the BLS (Figure 6).
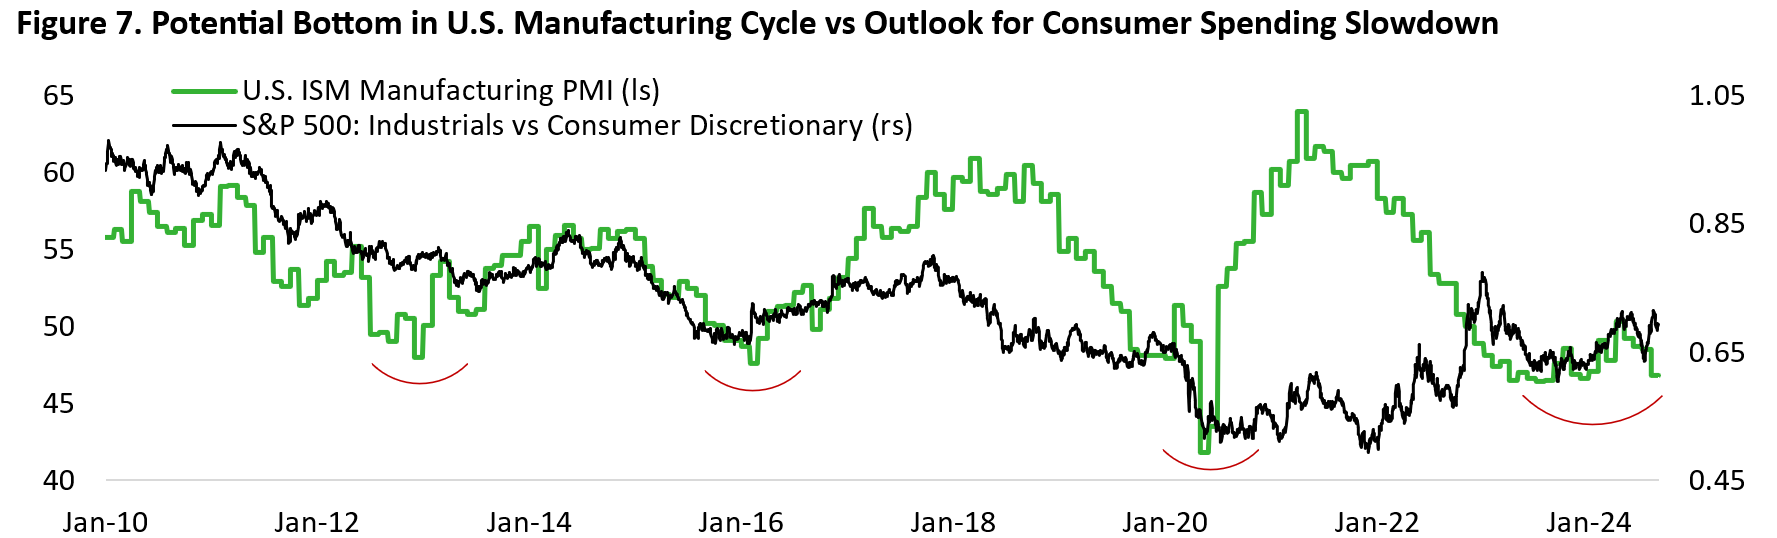
Given the potential recovery of the cyclical/industrial sector from its depressed state and the outlook of continued softening in consumer spending and the labour market, we favour tilting the cyclical basket of our U.S. equity portfolio towards industrials vs consumer discretionary (Figure 7).
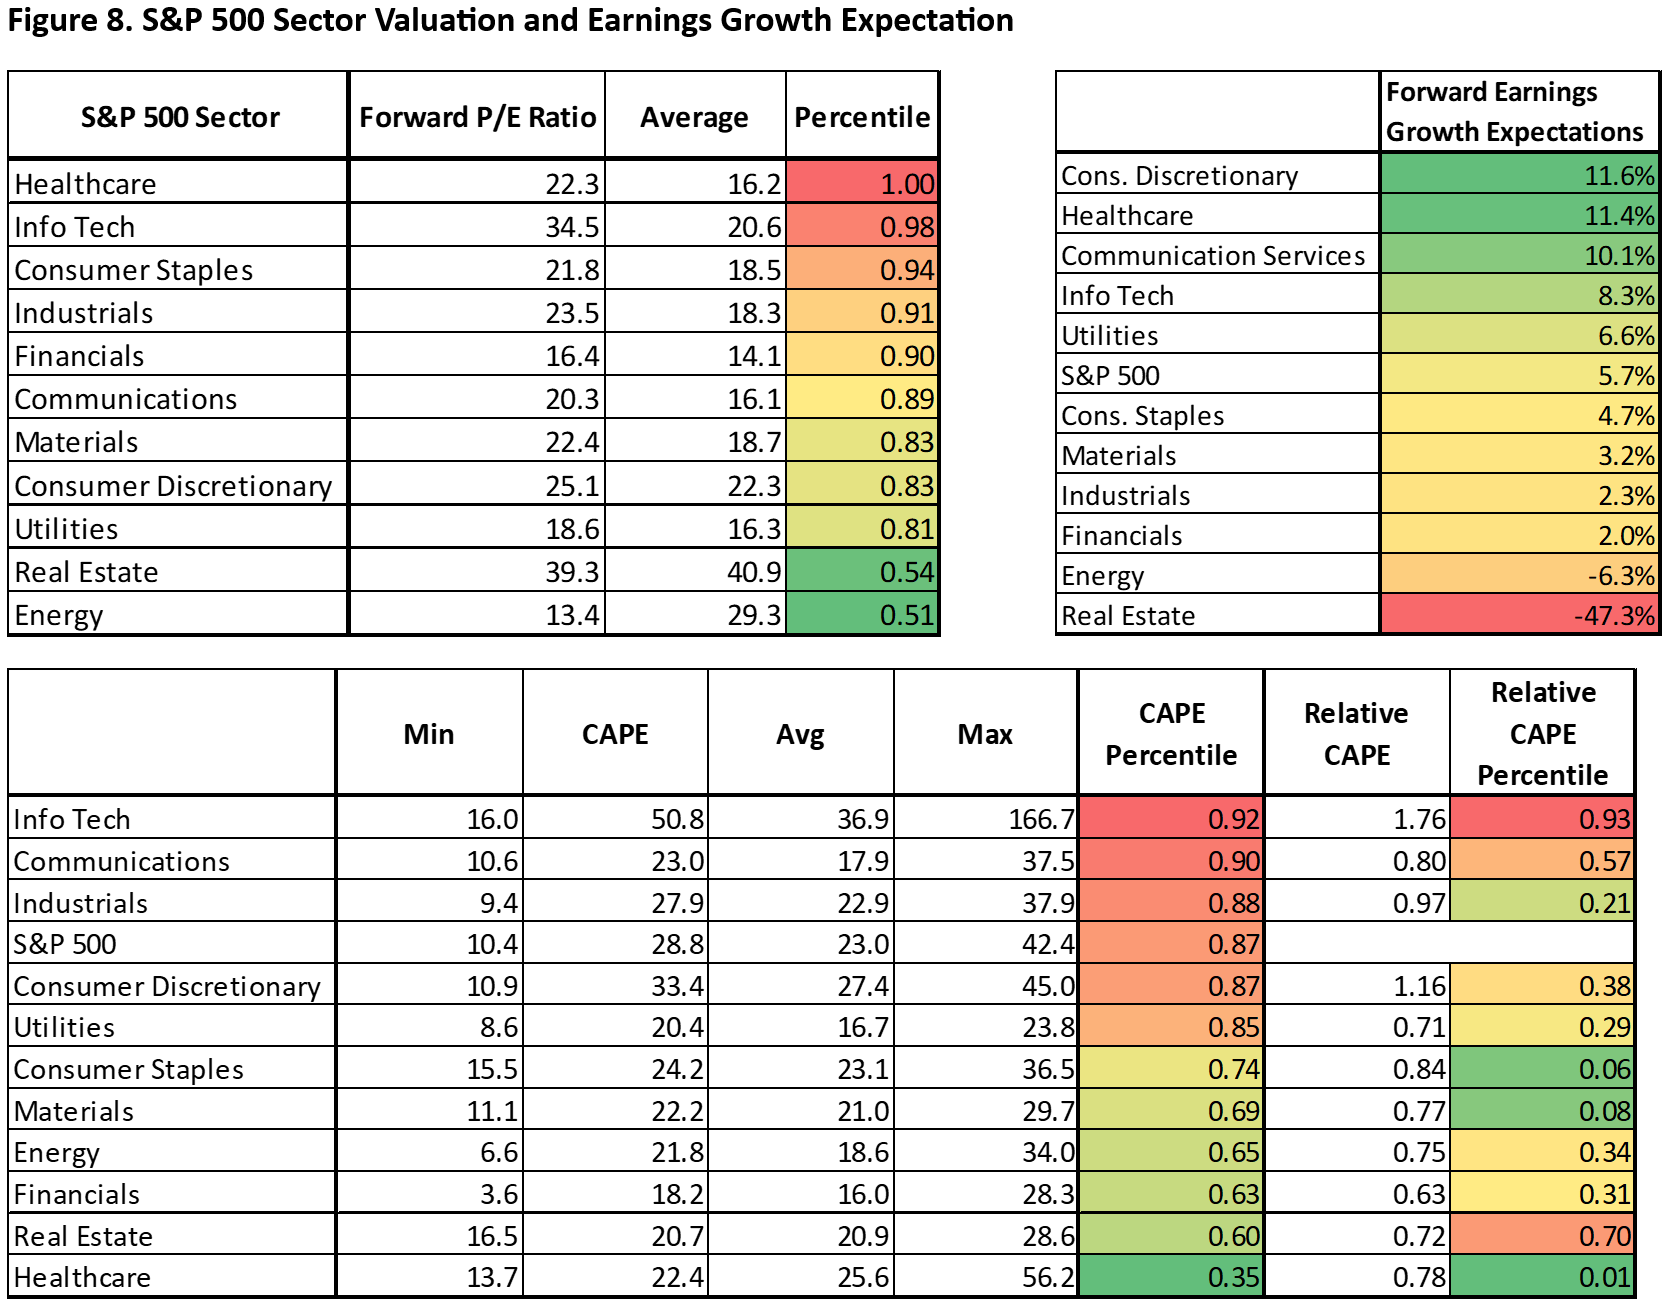
The drawback here is that industrials are currently trading at a richer valuation compared to discretionary, as measured by both forward P/E and cyclically adjusted P/E ratio (Figure 8). This is mainly because investors expect much higher earnings growth for consumer discretionary sector (+11.6%) in the coming year compared to industrials (+2.3%), which hinged on the assumption of decent labour market condition in the coming year and earnings growth from Amazon and Tesla.
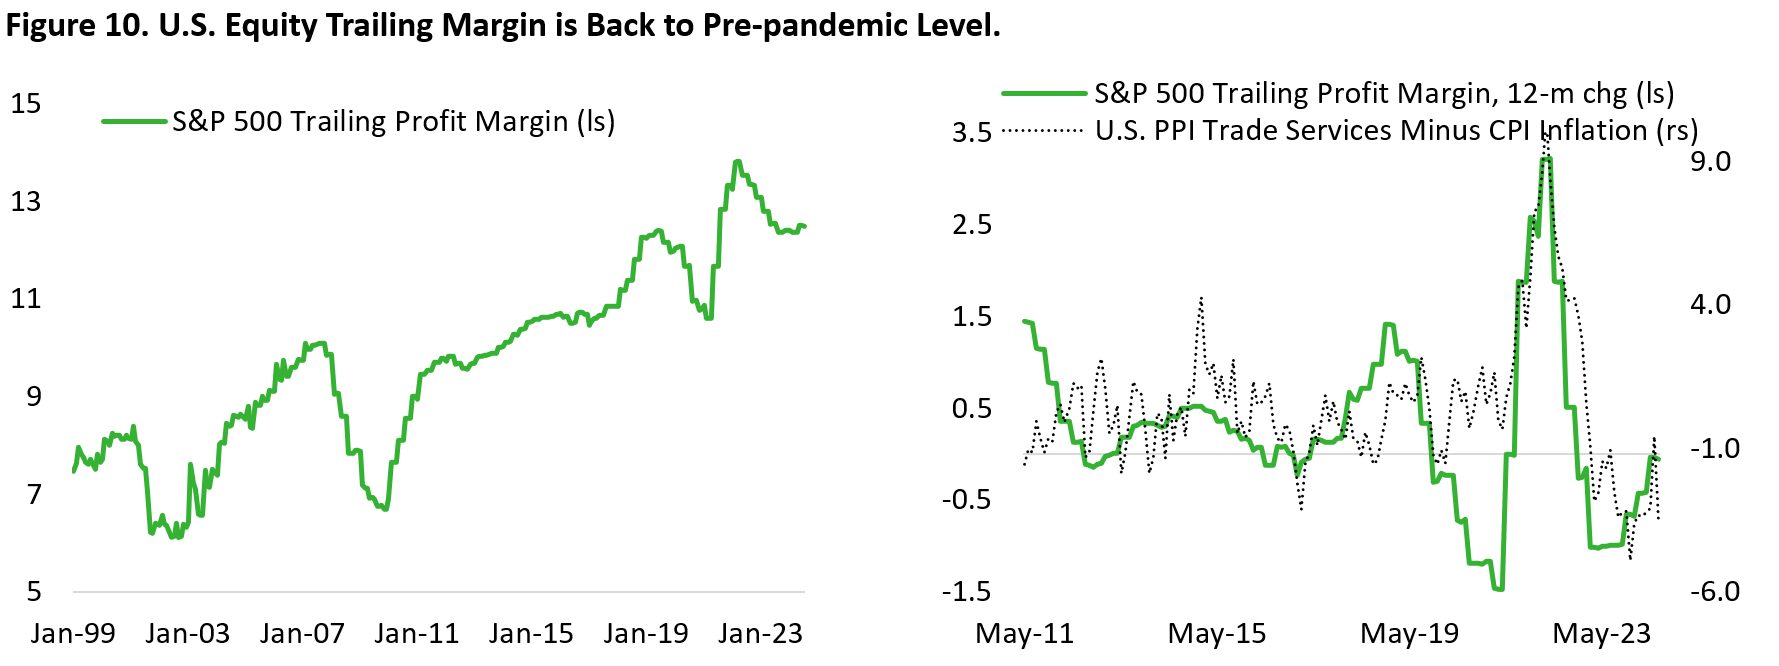
For the aggregate U.S. equity index, currently analysts are expecting S&P 500 earnings to grow to $242.8 (+6.5%) in 2024 and $276.9 (+14.0%) in 2025. We remain to be on the view that earnings growth expectations are too lofty given the higher base from this year, disinflation trend, and slower real GDP growth. Note that economists expect real GDP growth to shift downward to 1.7% in 2025 from 2.5% this year. This makes an acceleration of earnings growth dependent on margin expansion amid slower top line growth.
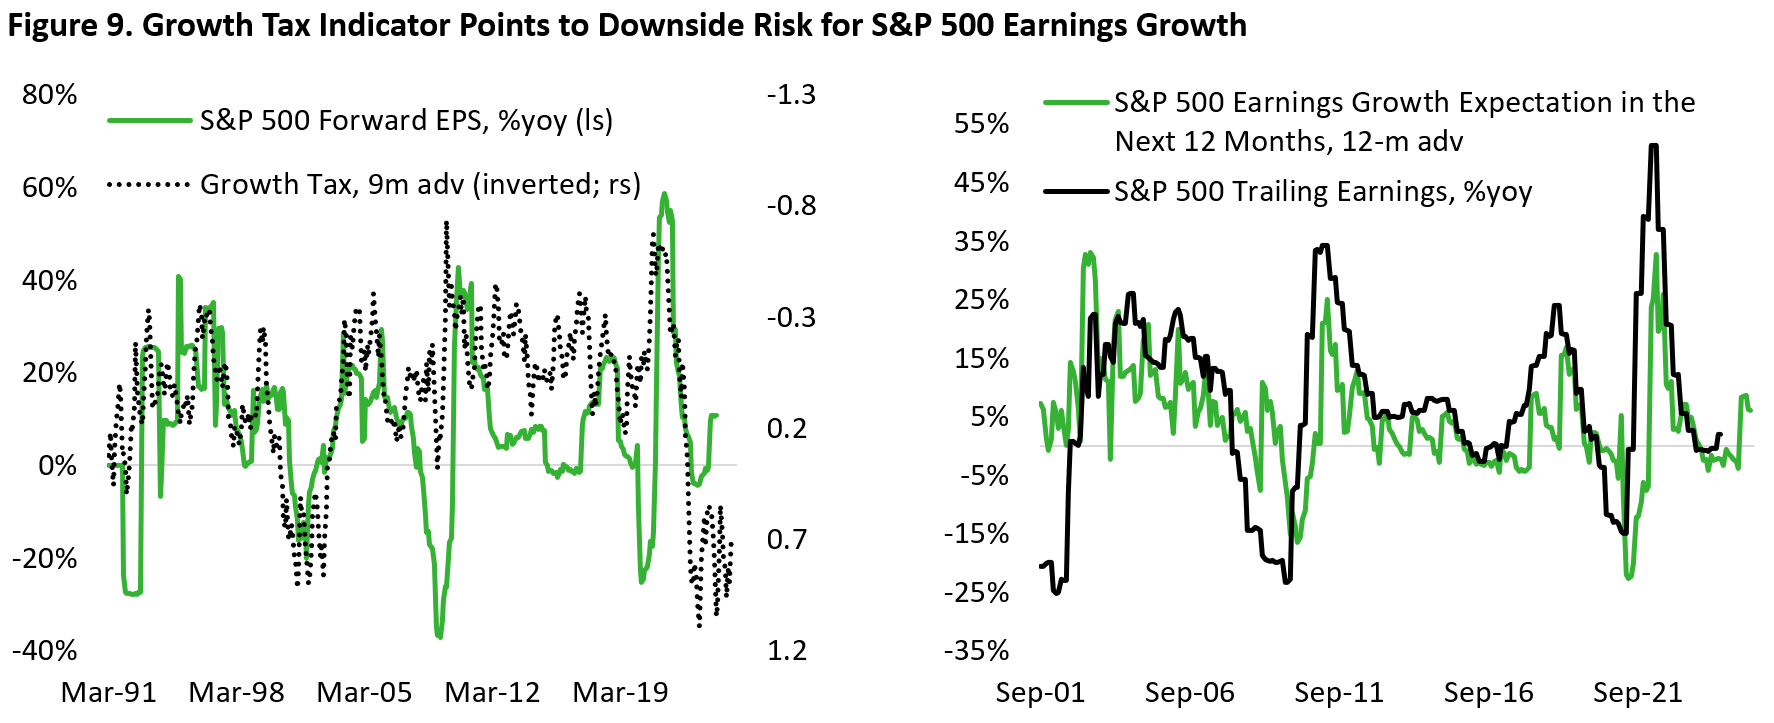
The problem is that there is limited room for margin to further expand from an already elevated level (Figure 10). The trade service category under PPI inflation data – a proxy of margins received by wholesalers and retailers – shows aggregate margin pressure by wholesaler and retailer that begun in mid-2023. Simply put, the outlook of lower revenue growth and limited room for margin expansion makes the current expectation of 14% earnings growth next year very lofty indeed.
Copyright © 2024, Putamen Capital. All rights reserved.
The information, recommendations, analysis and research materials presented in this document are provided for information purposes only and should not be considered or used as an offer or solicitation to sell or buy financial securities or other financial instruments or products, nor to constitute any advice or recommendation with respect to such securities, financial instruments or products. The text, images and other materials contained or displayed on any Putamen Capital products, services, reports, emails or website are proprietary to Putamen Capital and should not be circulated without the expressed authorization of Putamen Capital. Any use of graphs, text or other material from this report by the recipient must acknowledge Putamen Capital as the source and requires advance authorization. Putamen Capital relies on a variety of data providers for economic and financial market information. The data used in this publication may have been obtained from a variety of sources including Bloomberg, Macrobond, CEIC, Choice, MSCI, BofA Merrill Lynch and JP Morgan. The data used, or referred to, in this report are judged to be reliable, but Putamen Capital cannot be held responsible for the accuracy of data used herein.
