Over the past year U.S. economic growth has significantly outpaced the rest of the world as tight labour market condition and robust consumer spending supported real GDP growth above the 2% trend. This contrasts with growth conditions across European and Emerging Market countries, which have fallen to anemic levels, and in China where the country’s real estate crisis and lackluster fiscal support have translated to a weak consumer and investment demand alongside price deflation. The superior growth picture in the U.S. and relatively hawkish monetary policy by the Fed have supported the performance of U.S. equities – supercharged by the positive development surrounding AI – and the U.S. dollar, while also prevented U.S. long-term yields from falling in-line with its developed market counterparts.
Today, however, we are potentially at a turning point where U.S. growth will likely continue to slow and converge to the rest of the world while the Fed is expected to start loosening monetary policy in September, following the step of European and Canadian central banks that have started their easing cycle back in June. Figure 1 shows Federal Reserve’s projection for growth in the U.S. relative to Euro Area alongside the U.S. dollar basket in real terms.
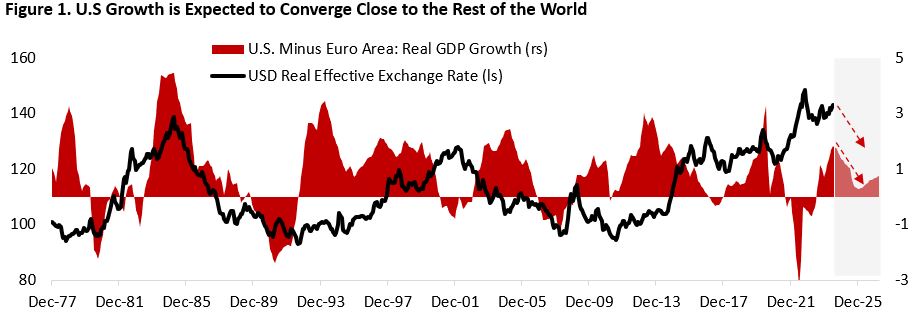
On a real effective term against its trade partners, the U.S. dollar is expensive and likely to be at the end of its bull cycle that began in 2011. Meanwhile, the potential shift towards looser monetary policy alongside tighter fiscal policy (Figure 2) should weigh on the greenback performance relative to G7 and emerging market currencies. A narrowing U.S. fiscal deficit on the backdrop of halving of standard deduction and child tax credit, and income tax increase for the top 1% income earners to 39.6% from 37%, mean fiscal policy will no longer be a net boost for the economy. In addition, narrowing interest rate gap between U.S. and rest of the world makes U.S. less attractive destination for capital. We now think the dollar will weaken – or at least not strengthen further – in the coming years, despite the potential for U.S. government to impose tariffs on overseas good imports under Trump administration.

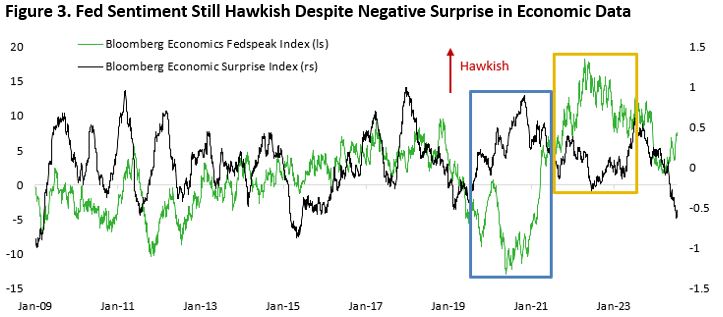
How should investors be positioned considering the changing macroeconomic environment, and which equity sector and factor tend to outperform? In terms of our portfolio positioning, the risk/reward tradeoff still favours being long U.S. Treasury bonds, in our view. The rate market is currently pricing in between 2-3 rate cuts this year, which will bring Fed Funds target rate to 4.75-5.00% (from 5.50% currently) and real yield to positive 1-2% range. In sum, monetary policy is still expected to be restrictive by the end of year despite hard data pointing to greater downside risk for the U.S. economy. With the economy slowing and inflation falling, financial condition should tighten going forward if the Fed continues to be reluctant in easing monetary policy and tilt hawkish (Figure 3).
Note that the macro data of late remain a combination of robust GDP growth (Q2/24: 2.8% q/q annualized) and increasingly worrisome trajectory in consumer spending (70% of the U.S. economy) and the labour market, whose fate are intertwined. The financial market continues to price in low probability of recession in the next 12 months, but the probability of a sharper slowdown in growth is increasing, in our view.
First, real retail sales in the U.S. have plateaued, albeit at a higher level compared to pre-pandemic trend – unlike in other developed countries (Figure 4). Meanwhile, consumers in the low-to-middle income bracket are increasingly showing signs of strain. The burden of sharply higher borrowing rate and inflation have translated to debt service ratio rising to above pre-pandemic level and pushed delinquency for auto and credit card loans to the highest since the global financial crisis (Figure 5). In Q2/24 earnings released so far, we started to see the weakness in consumer spending stretching beyond discretionary goods such as luxury items (LVMH, Kering, Burberry, Hugo Boss all disappoint in recent quarter) into some staples and grocers, who are forecasting a drop in revenue growth as consumers become more sensitive to the price hike.

Second, the job market outlook for the average Americans is deteriorating with job gains potentially falling below historical trend by the end of this year. Already, the household surveys are giving a much weaker picture of U.S. labour market compared to the non-farm payrolls (Figure 6). And soft data highlight that companies are pulling back on their hiring plans – NFIB Small Business survey, employment component of ISM manufacturing and service PMI, and job opening rate all indicate worsening outlook for job gains in the coming quarter (Figure 7). The good news is that despite continuing jobless claims being elevated (up ~30% y/y), monthly job losses have not risen materially as companies prefer to reduce their hiring rather than doing outright layoff – supporting the soft-landing narrative.

Lastly, given the shift from public to private market in both equity and credit space, we have seen increasing risks being accumulated in the private market that mask the calm in public financial market and may disrupt the banking sector. This is most visible in the commercial real estate sector, where various stakeholders tacitly approve the extend-and-pretend practice to prevent default across their holdings. For instance, cap rate for private real estate holdings is at an unrealistic low level despite the rise in long-term yields seen over the past three years (Figure 8). Should valuation in the private market is marked to public market equivalent, it would likely accelerate defaults for highly leveraged assets. General partners, who are paid based on the size of AUM and performance, are obviously incentivized to hold marks as high as possible. Meanwhile lenders, unwilling to seize the underlying asset and lacking the expertise to manage it, have so far willing to close their eyes and rollover the loans to prevent it from going into default. Even investors, clamored for years by the seemingly low volatility and drawdown of private assets, do not want to see the unrealized losses. A sharper downturn in the U.S. economy could trigger more defaults in this space and potentially pose significant risk to the banking sector, which provide the leverage employed by private equity firms to juice up returns.

On top of the above, geopolitical uncertainty related to the war in Middle East and Ukraine, potential U.S. tariffs on goods imports should former President Trump win the election, and a faltering Chinese economy all added to the dark clouds on the horizon.
Overdue Equity Rotation in the Making
Over the past eighteen months, the U.S. and global equity market performance has been supported primarily by the rally in large-cap growth stock category. Since the release of U.S. June CPI inflation On July 11th, however, we have seen sharp sector and factor rotation away from growth and tech stocks towards both cyclical and defensive sectors. There are reasons why this rotation could have legs.
To start, we are on the cusp of monetary policy easing by the Federal Reserve, which is couple months behind the European Central Bank and Bank of Canada. Historically, rate cutting cycle tends to support the performance of rate-sensitive sectors such as utilities, consumer staples, and healthcare – sectors that have been outperforming the S&P 500 benchmark since the beginning of the rotation on July 11th. Moreover, valuation for cyclical and defensive sectors are more attractive compared to its growth counterparts (Figure 9). The rotation back towards defensives, which have lagged significantly over the past two years, could be catalyzed by further progress on inflation and softer labour market condition. The case for being overweight defensive is even stronger in the case of U.S. economy decelerating faster than currently expected.
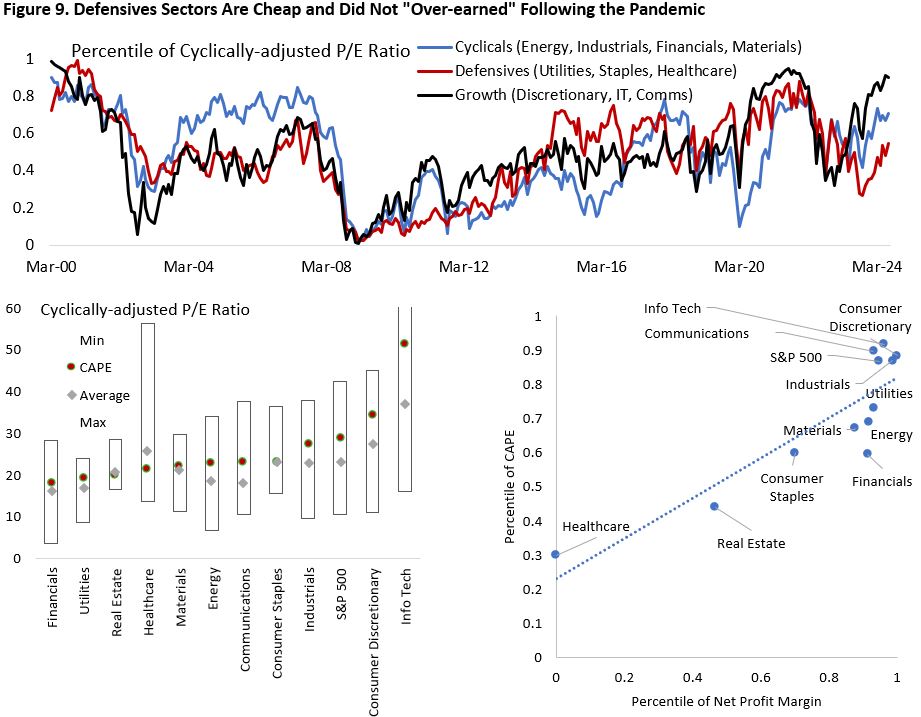
As highlighted in Figure 9C, defensive sectors’ net profit margin is also closer to historical median compared to its growth counterpart. The healthcare sector has undergone through significant earnings recession as the post-pandemic benefit ebbs, with margin at two decades’ low. Meanwhile, margin in the consumer staples and utility sector is not as stretched as in the info tech, consumer discretionary, and industrial sector. Although the consensus view remains on soft landing, tighter financial conditions from currently very loose position poses greater downside risk for stocks with high multiples. Across cyclical sectors, we continue to favour energy and material sector over financials due to the latter’s downside risk from higher delinquency rates, slowing credit growth, deteriorating NIM outlook, and hidden risk from lending to the private markets.
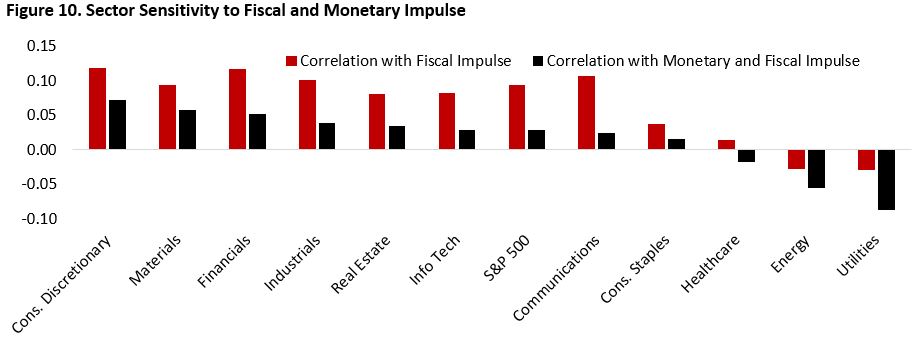
In addition, defensive sectors have an inverse correlation with fiscal impulse (Figure 10), which is expected to become increasingly negative in the coming quarters (Figure 2). A net drag to GDP growth from narrowing fiscal deficit in the coming quarters, at a time when consumer spending is weakening, point to an increasing likelihood of a harder landing for the U.S. economy and support a tilt towards defensives.
As for small cap, it has historically outperformed during period of monetary tightening (expansion phase of the business cycle) and underperformed during the easing cycle (slowdown or contraction). This makes the current underperformance of small-cap stocks a curious phenomenon given most market participants believe that the probability of recession is low, implied by the elevated U.S. equity valuation, including for stocks outside the Magnificent 7 and the info tech sector, and tight spreads across fixed income securities. In fact, the poor relative performance of small cap to the S&P 500 (Figure 11) might suggest that the market is already pricing in a weak recovery or even potential relapse in the business cycle. Could small cap outperform even if the U.S. economy go through a harder landing?
That depends on the trajectory of the relative earnings of the two indices. Smaller-sized firms have seen their earnings slump 14.5% over the past 12 months even as large-cap stocks saw their earnings grew 2.2%. Arguably, small-cap stocks have seen a proper earning correction and are due for a rebound if soft landing materialize. In addition, declining borrowing rate bolster the profitability of small-cap firms (Russell 2000 index), which have much higher net debt to EBITDA ratio (4.4 times) compared to the S&P 500 constituents (1.5 time). The risk here is that a growth scare or tighter financial conditions could potentially weigh on the relative performance of small-cap stocks.
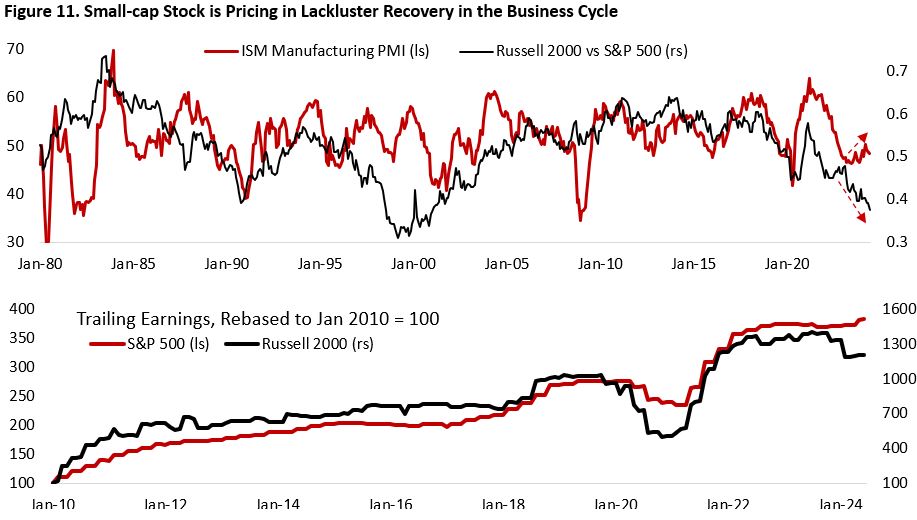
Figure 12 and 13 shows U.S. sector and factor performance in the period 3-month, 6-month, and 12-month following the first Fed rate cut date, and 3-month prior to that. In the case of recession, defensive sectors (staples, healthcare, utilities) and both energy and materials tend to outperform while financials did poorly. What is most interesting, however, is that healthcare and consumer staples tend to also outperform in a non-recession scenario – most likely due to these sector’s sensitivity to long-term yields. This supports overweight position for both sectors currently as the Fed is expected to start cutting policy rate in September.

Finally, if growth in the U.S. continues to slow and converge to the rest of the world, U.S. assets will likely lose its shine. This should mean weaker greenback and improving outlook for assets outside the U.S. But too fast of a deceleration will scare investors to venture outside the safety of U.S. assets and direct flow into U.S. Treasury bonds. The bottom line is that the time is ripe for investors to again maintain a defensive tilt within the equity portfolio while overweighing bonds from multi-asset perspective.
Copyright © 2024, Putamen Capital. All rights reserved.
The information, recommendations, analysis and research materials presented in this document are provided for information purposes only and should not be considered or used as an offer or solicitation to sell or buy financial securities or other financial instruments or products, nor to constitute any advice or recommendation with respect to such securities, financial instruments or products. The text, images and other materials contained or displayed on any Putamen Capital products, services, reports, emails or website are proprietary to Putamen Capital and should not be circulated without the expressed authorization of Putamen Capital. Any use of graphs, text or other material from this report by the recipient must acknowledge Putamen Capital as the source and requires advance authorization. Putamen Capital relies on a variety of data providers for economic and financial market information. The data used in this publication may have been obtained from a variety of sources including Bloomberg, Macrobond, CEIC, Choice, MSCI, BofA Merrill Lynch and JP Morgan. The data used, or referred to, in this report are judged to be reliable, but Putamen Capital cannot be held responsible for the accuracy of data used herein.
