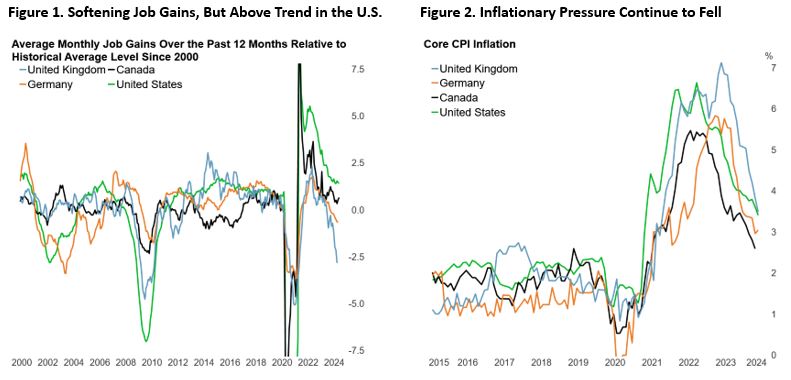
For the past two years, all eyes have been on the timing and pace of policy rate cut. Investors had been whipsawed multiple times as the change in narrative between recession and soft landing translated to high volatility in the fixed income market. With the macroeconomic backdrop in the U.S. still robust while the rest of the world is in a relatively worse place, policymakers outside the U.S. have front run the Federal Reserve in easing monetary policy. Inflation and employment trends have been relatively softer outside the U.S. Job gains for Britain and Germany have already fallen to below the historical average (Figure 1), while those of Canada has declined to around trend – although the gain in Canadian job markets have been dominated by part-time rather than full-time position. Inflation, while remaining above central banks’ target, have behaved better in recent months and leading indicators continue to be favourable (Figure 2). Despite pocket of weaknesses, such as in the continuation of crisis in developed world and China’s real estate market, and U.S. regional banks, the global economy is in a better-than-expected shape in face of high interest rate.
So far this year, Swiss Central Bank have cut its policy rate twice and in June, both European Central Bank and Bank of Canada have begun lowering policy rate by 25 bps, which will likely be followed by few more rate cuts in the second half of 2024. The bond market is currently pricing 64% probability of 25-bps rate cut in September by the ECB, with 100% chance of a cut by November and almost certainty of two rate cuts by the end of year. The Bank of Canada, which have cut 25-bps in June, will likely continue to deliver 25-bps every other meeting, with 67% probability of another cut in July and the market pricing in 2.3 more rate cuts by the end of year. The Eurozone, who also have cut policy rate by 25 bps in June, is expected to deliver another cut by October. The bottom line is that we are in the beginning of a monetary policy easing cycle across develop economies – something that investors have been waiting for in the past two years.
The conundrum today is that following three years of investors and the Federal Reserve being whipsawed by “transitory” to “sticky” inflation, there is little confidence in economists and central bank’s projection on inflation. However, a monetary policy based on waiting for the confirmation of hard data is a poor one – amplifying the business cycle rather than smoothing it. It seems that policymakers today want to see U.S. economic growth and job market to be much weaker prior to easing policy. Given the U.S. economic data in recent months continue to point to a softening trend in growth and inflation, all eyes are on the Fed with investors expecting the FOMC to cut policy rate sometimes in the second half of 2024. But are we there yet? Before jumping to the conclusion, let’s review some of the facts.
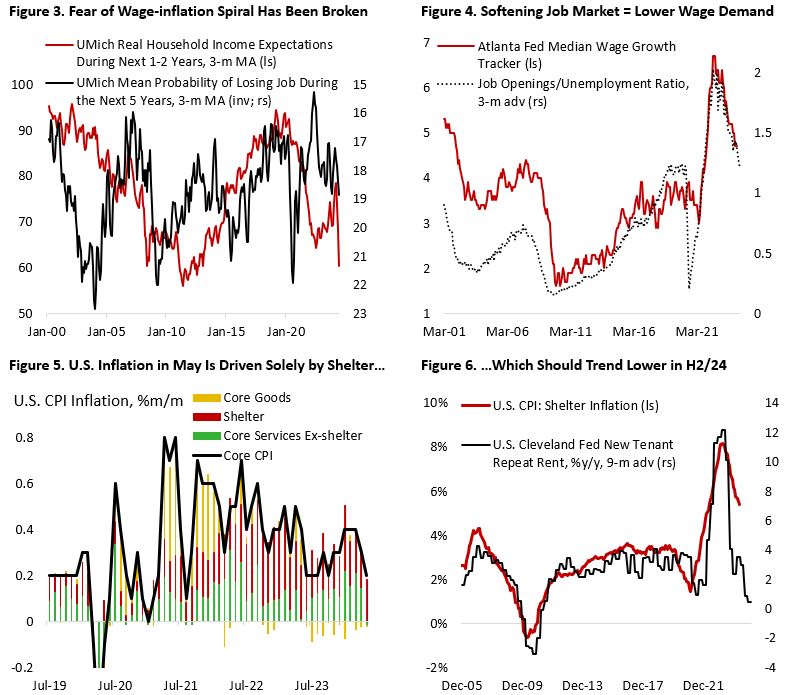
The good news is that there are signs that the inflation-wage spiral has been broken, as highlighted by wage expectations and actual wage growth drifted significantly lower (Figure 3 and 4). A slowdown in growth and softer job market is curbing the bargaining power of workers. Inflation, while still above policymakers’ target, is also not reaccelerating. In fact, U.S. core inflation in May is fully contributed by shelter inflation, with the month-on-month inflation on goods and service ex-shelter prices being flat (Figure 5). Given that leading indicators for shelter continue to point to a softening trend (Figure 6), we could expect continued progress on inflation, barring any surprise from energy and food prices.
The other side of the inflation story is growth, which have decelerated somewhat this year. Figure 7 shows U.S. economic data, both hard data and surveys, have been surprising to the downside of late. The rate-sensitive sectors of the economy, including housing, real estate, and industrial sector, have suffered worse compared to the consumer sector – propped up by the strong labour market and positive wealth effect.

In the housing and real estate sector, the backdrop of elevated interest rate over the past three years has translated to a significantly cooler market, with property purchase transactions falling 35% compared to the post-pandemic peak amid worsening house affordability (jump in mortgage rates without significant decline in house prices). Meanwhile, household mortgage application is 80% below the peak in 2021 and 50% below 2019 level (Figure 8). The outlook for Fed interest rate cut later this year, however, could revive the market and provide a boost to property prices. This could be a game-changer for the battered commercial real estate sector as borrowing cost decline alongside a potential rise in valuation.
The manufacturing and broader industrial sector should also continue to stabilize in the second half of 2024, with the positive impact from looser monetary policy likely being offset by slower U.S. economic growth. This could be a replay of the late 1990’s playbook where decent U.S. economic growth stand in contrast to those outside the U.S., and the U.S. financial system itself was under stress from the blow up of LTCM – a hedge fund exposed to the defaulting Russian debt market – giving reasons for the Fed to ease monetary policy. This led to a brief recovery of the manufacturing sector up until the burst of the tech bubble in early 2000. The lack of broad recovery across various sectors of the economy, however, translated to an increasingly concentrated equity market with few winners (Figure 9). Sounds familiar?

Whereas the two sectors discussed above represent the weaker part of the U.S. economy, the latter three – labour market, household sector, and retail spending – whose outlook is interrelated, have been contributing to the better-than-expected U.S. growth. The most important thing to note here is that the U.S. labour market has normalized from the very tight supply/demand balance seen in the first half of 2022 (Figure 10). Diminishing wage growth gap between worker who changed job vs those who stayed has led to a decline in the quit rate to 2.2%, below pre-pandemic level. Meanwhile, initial and continuing jobless claims are rising, with the ratio of the latter to the former rising to a level that historically preceded a recession – suggesting that it is becoming harder for workers to find employment following a layoff.

There are also doubts on the apparent strength of U.S. job market. Figure 11 highlights the contrast between employment data taken from establishment and household surveys – both produced by the U.S. Bureau of Labour Statistics. The non-farm payroll data suggests the U.S. economy added 1.529 million over the past 6 months (254k/month), but household surveys indicated a loss of 1.015 million jobs between December 2023 and May 2024 (-170k/month). What causes this divergence? First, the household survey counts the number of people employed in the economy whereas the establishment survey counts for the number of jobs created. This means a person with three jobs will be counted as one in the former and three in the latter. This is in-line with a separate statistic showing rising share of U.S. worker having more than one job at a time. Second, the deterioration in response rate of these surveys makes it more likely to be revised significantly upward/downward in the future, lowering the reliability of the numbers in its initial release.
Regardless of the true underlying of the job gains in U.S. economy, not all parts of the consumer segments are doing well. If job creation is indeed as strong as non-farm payroll indicates and real wage growth has been positive – as highlighted by the wage and inflation data – the fact that consumer loan delinquency rates have continued to creep higher is even more concerning. Figure 12 shows that 30+ days delinquency on credit card has risen to 8.9% in May while those of auto loan is now at 7.9% – both last seen prior to the global financial crisis.

It is perhaps not surprising then that consumers are pulling back on discretionary spending given the depletion in excess savings and deteriorating outlook for personal finance. Monthly real retail spending growth ex-auto has been contracting for half of the time since the beginning of 2023, pulling consumer spending back to its long-term historical trend (Figure 13). The pullback in spending is especially apparent in the durable goods category, including furniture, electronics, appliances, and in building materials, sporting goods, and hobbies. Service growth has slowed too, with spending in restaurants and bars growing only 5% y/y in May from a consistent double-digit growth seen since the easing of lockdown in December 2020.

Given the changing macroeconomic discussed above and the fact that we are possibly in an important turning point in monetary policy, labour market, and growth, we thought it is important to “debunk” some of the headline news running in the newspaper headlines, which brings us to…
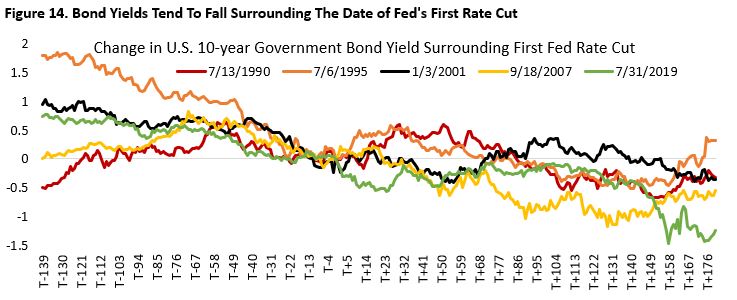
- GIC is attractive vs diversified fixed income allocation: the outlook for continued progress on inflation, slower U.S. growth, and softer job market should be a tailwind for the fixed income market. Figure 14 highlights the tendency for long term bond yields to fall surrounding the date of Fed’s first rate cut. Granted, spreads are tight, but fundamental has been holding up well and we prefer high quality issuers in the IG space which should bode relatively well in a mild economic slowdown.
- U.S. regional banking crisis: losses from fixed income securities are still elevated, but smaller banks have been able to attract deposits by offering more attractive savings rate. For larger banks, they benefit from deposit flow from their smaller counterparts and are seeing a pickup in capital market activity. This should provide a boost to revenue amid slower loan growth and potential decline in net interest margin (NIM) ahead.
- Commercial real estate: sentiment remains depressed, but valuation for office subsector is bottoming and borrowing rate will likely decline as monetary policy ease. The rest of the real estate subsector has fared relatively better amid higher rate environments.
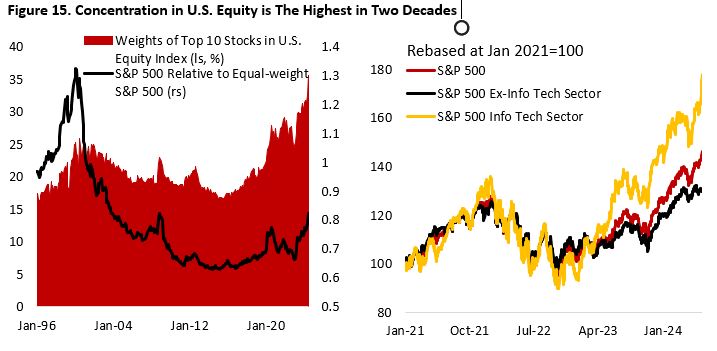
- Equity market concentration and poor breadth: mega-cap tech stocks have been the biggest winner YTD, dominating the U.S. equity market rally. Breadth in the market has been very poor, making it a tough market for active mutual fund manager. However, the last time the equity market was this concentrated it was followed by massive outperformance of the rest of the market, especially as earnings growth for the Magnificent 7 continue to trend lower and converging to the rest of the index. Investors will likely be rewarded for rebalancing growth winners to select cyclicals and defensives. U.S. leading economic indicator is still contracting but at a slower pace, which historically marked the bottom of the cycle and followed by favourable environment for equity investors.
- U.S. equity is expensive: despite the rich valuation on index level, there are pockets of value on a sector level. Six out of ten U.S. sectors (ex-real estate) have median stock valuation that is more attractive compared to the sector level valuation, on a percentile basis.

- Shift to the Right in Europe and U.S: Voters are unhappy with the inflationary and declining living standards during center-left/right administration, giving way to far-right party in France (MN), Germany (AFD), and the U.S. (Republican). However, the lack of parliamentary majority for far-right party in Europe means they will likely have to moderate their policies and cooperate with center-right parties. More importantly, none of the far-right party demand a breakup from the EU – the primary concern during 2011-2013 European crisis. In the U.S., we will see a rematch of the Trump vs Biden this November. Despite the diverging view between the two candidates, they have two in agreement: China-bashing and continuation of large fiscal deficit. The former means we could be entering the second episode of the tariff war initiated first in 2018 under President Trump administration, while the latter potentially translate to tightening liquidity in the financial market as treasury issuance rise.
- Faltering Chinese economic recovery: Inadequate policy stimulus and increasingly challenging external environment. Credit impulse continue to trend lower and M1 money supply is contracting, in-line with our expectation that structural growth for the Chinese economy have shifted downward permanently amid aging demographic and inadequate policy support. Industrial production also missed consensus expectations, while the property sector crisis continues to be an issue for local government finances and weighing on consumer sentiment. Worryingly, home prices across major cities are declining at a faster pace. With the central government unwilling to open its purse, local government support for households on education and healthcare will likely be curbed – increasing the burden for the average family. Meanwhile, the geopolitical backdrop is less conducive for boosting the country’s exports, as highlighting by the implementation of U.S. and EU tariff and duty on Chinese EVs. As the Western world increasingly holds an unfavourable view on the Middle Kingdom, Chinese policymakers will have to rely and focus on its domestic economy to revive growth.

- Ukraine-Russia and Israel-Hamas War: both warring parties are opening the possibility of a peace talk and impact to the commodity and financial market is limited, especially as the U.S. is no longer reliant on Middle East oil supply.
- Trade War II: U.S. policymakers’ focus so far is mainly for domestic political consideration, imposing tariffs on goods that account for negligible share of its domestic consumption, such as Chinese EVs and solar panel imports. Meanwhile, retaliation from Chinese policymakers should be limited given the country’s dependance on high-tech U.S. goods, access to global financial system, and weak domestic economy.
Copyright © 2024, Putamen Capital. All rights reserved.
The information, recommendations, analysis and research materials presented in this document are provided for information purposes only and should not be considered or used as an offer or solicitation to sell or buy financial securities or other financial instruments or products, nor to constitute any advice or recommendation with respect to such securities, financial instruments or products. The text, images and other materials contained or displayed on any Putamen Capital products, services, reports, emails or website are proprietary to Putamen Capital and should not be circulated without the expressed authorization of Putamen Capital. Any use of graphs, text or other material from this report by the recipient must acknowledge Putamen Capital as the source and requires advance authorization. Putamen Capital relies on a variety of data providers for economic and financial market information. The data used in this publication may have been obtained from a variety of sources including Bloomberg, Macrobond, CEIC, Choice, MSCI, BofA Merrill Lynch and JP Morgan. The data used, or referred to, in this report are judged to be reliable, but Putamen Capital cannot be held responsible for the accuracy of data used herein.
