It certainly feels like déjà vu all over again looking at the evolution of policy rate cut expectations in the U.S. this year. At the beginning of 2023 traders were pricing in one rate cut for the remainder of the year. Instead, the Fed raised policy rate by another 100 bps in the following quarters, despite the regional banking crisis in March 2023. Fast forward to January 2024 and the bond market was expecting six rate cuts for the year. Four months into the year, that expectations have been reduced to merely two cuts (Figure 1).

Stronger-than-expected U.S. economy, thanks to the generous fiscal stimulus post-pandemic and robust immigration, has added to the inflationary pressure in the U.S. economy and bolstered and job gains in the first quarter of the year. Housing cost inflation has come down slower than leading indicators suggested while jobs demand from the healthcare, education, and government sector is accounting for increasing share of the monthly gains in U.S. non-farm payrolls.
All these reduce the need for the Fed to rush in easing monetary policy and push U.S. long-term bond yields back to above 4.5% in the month of April. A higher-for-longer policy rate, when combined with a strong economy, is not necessarily a bad environment for investors. It is an environment where companies with low net debt level thrives and those with in-demand products are able to push selling prices higher without seeing much dent in volume. Meanwhile, consumers in the high-income bracket are also benefitting from the wealth effect of booming house and equity prices, and higher distribution from fixed income securities – all of which support spending, especially within travel and the luxury sector.
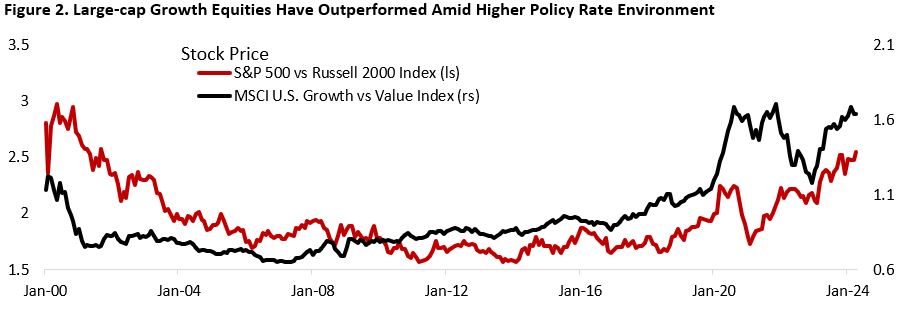
From an equity investor’s lens, a slower descent in policy rate could mean the outperformance of large-cap firms relative to their mid-and-small-cap counterparts should continue going forward, and growth equities should continue to trounce value (Figure 2).
First, large-cap firms in the S&P 500 index have a much lower net debt to EBITDA ratio compared to small-cap companies in the Russell 2000 index (Figure 3). As the former tend to skew towards higher grade bonds with longer maturities, they have less need to refinance at the currently high borrowing rate. This is contrary to the smaller-cap firms in the high-yield space that tend to borrow with two to three years maturity, many of which are facing refinancing wall this year.
Second, rather than detracting from companies’ fundamentals, the higher interest environment is beneficial for some of the mega-cap tech stocks that account for an increasingly large share of the S&P 500 index. Apple, Google, Meta, Microsoft, and Nvidia all have negative net debt (cash balance greater than their total interest-bearing liabilities) as these companies hold massive cash balance in their balance sheet. This means they are benefitting from the higher policy rate as interest accrue on their cash and short-term securities held in the balance sheet.
Third, companies with growth characteristics – commonly found in the tech, healthcare, and consumer discretionary sector – have been producing healthy free cash flow yield that allow them to pay down their debts and conduct buybacks. For firms classified within this category, not only their net debt to EBITDA ratio decline, but return on capital is also improving (Figure 4). This contrast to the hit in fundamentals to firms in the value category, which are more impacted by higher borrowing cost and whose valuation tend to be highly correlated to change in rates.

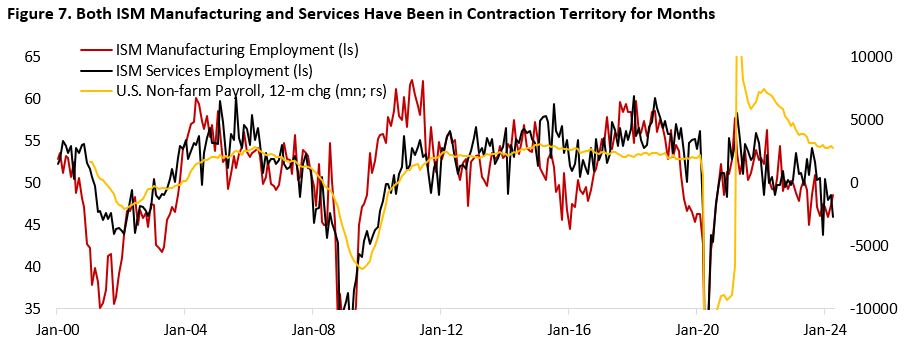
It is important, however, to not lose sight of the bigger picture as restrictive monetary policy will eventually weigh on business activity and consumer spending. The lower-than-expected U.S. job gains in April highlights the ongoing easing in U.S. labour market, albeit still at a healthy level. Job openings are still a bit higher than pre-pandemic level (5.1% in March 2024 from 7.5% peak in March 2022, vs 4.6% pre-covid), which highlights the robust demand for worker, but job quits rate has fallen to 2.1% in March 2024, below pre-pandemic level of 2.3%, from the peak of 3% in 2022. The bottom line is that although jobs are still plentiful, workers are no longer jumping from one employer to another to find higher salary. Meanwhile, ISM manufacturing employment has contracted for seven consecutive months and the service counterpart has contracted in four out of the past five months – all of which historically followed by slower job gains in the coming months (Figure 7). Should this trend continue, expect lower yields and for bonds to do better going forward.
Figure 7. Both ISM Manufacturing and Services Have Been in Contraction Territory for Months
Copyright © 2024, Putamen Capital. All rights reserved.
The information, recommendations, analysis and research materials presented in this document are provided for information purposes only and should not be considered or used as an offer or solicitation to sell or buy financial securities or other financial instruments or products, nor to constitute any advice or recommendation with respect to such securities, financial instruments or products. The text, images and other materials contained or displayed on any Putamen Capital products, services, reports, emails or website are proprietary to Putamen Capital and should not be circulated without the expressed authorization of Putamen Capital. Any use of graphs, text or other material from this report by the recipient must acknowledge Putamen Capital as the source and requires advance authorization. Putamen Capital relies on a variety of data providers for economic and financial market information. The data used in this publication may have been obtained from a variety of sources including Bloomberg, Macrobond, CEIC, Choice, MSCI, BofA Merrill Lynch and JP Morgan. The data used, or referred to, in this report are judged to be reliable, but Putamen Capital cannot be held responsible for the accuracy of data used herein.
