“At the 1971 G10 Rome meetings, during the Nixon administration, then-Treasury Secretary John Connally said to a group of European finance ministers, “The dollar is our currency, but it’s your problem.”
Following a 25%+ rally since the low in October 2023, U.S. and global equity market finally saw the return of volatility and correction among the mega-cap tech leaders. Higher for longer monetary policy stance telegraphed by the Fed pushed long-term U.S. government bond yields back to above 4.5% mark while the tit-for-tat missiles attack between Israel and Iran translate into higher geopolitical risk premium embedded in the price of oil – both of which is a headwind for U.S. economy and global stocks. The spike seen in the oil price following the retaliation by both Iran and Israel, fortunately, did not last long; OPEC+ is estimated to have 4.5-5 million bpd of spare capacity currently and U.S. crude production is at all-time high. This limits the upside to oil price as supply could be ramped up quickly in the near term if oil price reaches a level that hinder the ongoing recovery in global manufacturing cycle.
The growth and monetary policy outlook between the U.S. and rest of the world, however, are starting to diverge. Inflation in the U.S. has proved to be relatively stickier compared to in the rest of developed economies, thanks to the procyclical fiscal spending in 2021 and 2023, and U.S. economic growth has been much stronger than forecast – providing justification for delaying policy rate cut by the Fed. This is not shared by other developed economies, whose economic growth has fallen below trend and labour market condition has been soft.
With regards to employment gain, the U.S. recorded 303k job gains in March, above the long-term monthly of 94k, whereas Canada shed 2200 jobs (vs 20k trend), Germany added only 16k in February (vs 22k trend), and U.K. shed 141k in January (vs 16k trend). Clearly the U.S. labour market stands out as the strongest among developed countries, which supports its domestic growth outlook (Figure 1).
Similarly, the disinflationary progress in the U.S. has been stalling over the past quarter, with core CPI still at 3.8% in March – relatively unchanged since December. Contrast this with Canadian core CPI, which has fallen into 2.88% in March despite the unfavourable base effect from last year, and decent progress in U.K. and across Western European countries (Figure 2).

Stronger U.S. economy vis-à-vis weaker rest of the world, and sticker inflation in the U.S., should translate to a more attractive U.S. equity outlook, but also higher U.S. long-term yield as the Fed will likely be among the last central bank to cut policy rate – behind Bank of Canada and European Central Bank. ECB’s President Christine Lagarde’s signaled earlier in April that the bank is willing to cut interest rates before her U.S. counterparts, with strong indication that the bank will start cutting policy rate in June. This is putting an upward pressure for the U.S. dollar amid its higher yield and stronger U.S. economic outlook (Figure 3) but should translate to the outperformance of global ex-U.S. government bonds.
Sharply weaker currency against the greenback, however, is causing headache for many countries, including the export-dependent East Asian countries. Japanese and South Korean finance ministers last week met with U.S. Treasury Secretary Janet Yellen to address concerns of the recent sharp depreciation of the Japanese yen and the Korean won, likely opening the room for intervention to prevent the dollar from appreciating too much and too fast. Meanwhile, BoJ expressed its willingness to further raise interest rate if the weak Japanese Yen is feeding into higher inflation, given the country’s dependent on imports of energy and food.

The situations for EM central bankers are even trickier, given the balancing need for policymakers to stimulate their domestic economy and also prevent sharp depreciation of their currency, which could translate to higher inflation arising from rising import prices. Indonesian Rupiah, Malaysian Ringgit, Thailand Baht, Philippine Peso, and Chilean Peso are all trading near multi-decade low. Easing monetary policy cycle across EM countries amid higher-for-longer stance from the Fed should continue to be a headwind for EM currencies in the coming quarters (Figure 4).
The bottom line is that the longer the U.S. economy stays strong, the worse the economic and financial market outlook will be for the rest of the world. A continuation of stronger-than-expected U.S. economy will prevent central banks in developed and emerging market to adjust policy rate lower to a level warranted by its domestic economy, weighing on their growth outlook and likely translate to the outperformance of U.S. stocks and the dollar.
Given the strong dollar outlook, it surely is an oddity to call for a rally in base metal prices. However, the upturn in U.S. manufacturing sector is partially offsetting the continued economic weakness in China, translating into an improved outlook for the commodities and material sector. The most recent period of dollar strength that coincided with a commodity bull market happened between 1994 to 1999, when the U.S. economy managed to stage a soft landing following monetary tightening cycle by the Fed (Figure 5). This is similar to today’s situation where the U.S. economy keeps on going strong while the rest of the world is showing signs of strains. In between 1994 and 2002, emerging market countries went through a deep crisis, starting with Mexico’s Tequila crisis in 1994, Russian debt default in 1998, Asian currency crisis (Thailand, Indonesia, Malaysia), and Argentina’s debt default in 2001. The apparent weaknesses in the rest of the world, alongside the blew up of LTCM, a large hedge fund, pushed the Fed to cut interest rate marginally throughout this period, despite the strong U.S. economy. This translates to multi-year appreciation of U.S. dollar and a commodity bull market between 1995 and 1997 and 1999 onwards.

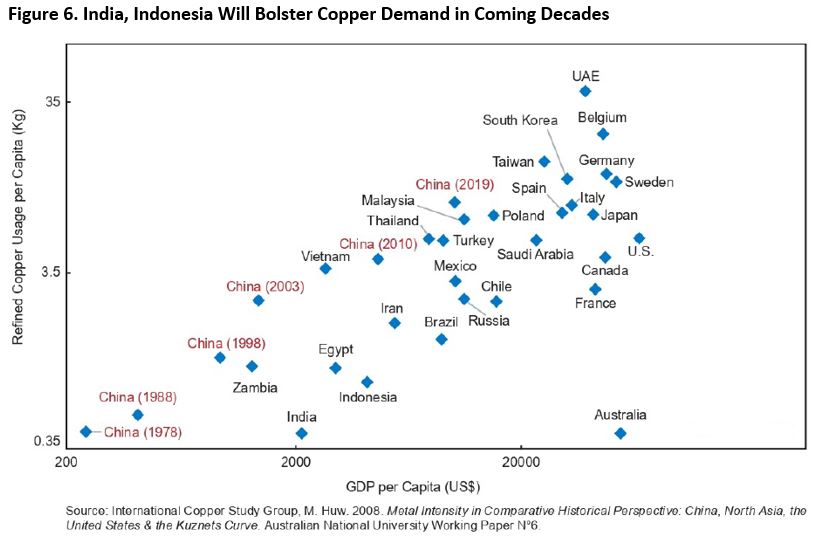
For the reason mentioned in our opening paragraph, we prefer to play the potential bull market in commodities through the exposure of base metal, especially copper. EM Asian countries such as India and Indonesia continue to grow at a rate above 5%, with both government focus on infrastructure building, which will be the source of structural demand growth in the coming two decades. Consider that between 2000 and 2013, China’s annual copper demand quadrupled (Figure 6). Today, India and ASEAN’s consumption of refined copper amounts to 700k and 840k ton per year, respectively. Even if emerging Asian countries’ consumption of refined copper only doubled in the coming decade- half those of China – this will amount to an addition of 1.5 million ton in annual demand (5.7% of refined copper annual consumption today). This is not yet accounting for the consumption growth in developed countries and tailwinds from the transition towards renewable energy, where an electric vehicle requiring 3-4 times the amount of copper compared to internal combustion engine vehicle. The bottom line is that refined copper demand will continue to grow above 2.5% annually for the foreseeable future.
Meanwhile, copper supply is not expected to grow commensurately alongside demand amid underinvestment in base metals complex over the past decade (Figure 7). Between 2008 and 2018, global copper mine production grew 2.6% annually, in-line with average demand growth. However, since 2018, this figure has averaged only 1.6%, which translates to a much tighter supply/demand balance and push copper prices 60%+ higher relative to the pre-pandemic level. Among large players, most of the capital expenditure is allocated to sustaining capex rather than new development. Historically, less than a third of copper capex went into development of new resources, the reverse of those in the lithium sector, according to estimates by S&P Global Market Intelligence.
This means higher price is needed to incentivize miners to invest in new development of the metal, especially as project and permitting delay have become the norm amid greater pressure from stakeholders to protect the local environment surrounding the mines. Given the difficulty and long time-lag between the exploration phase and mine production, however, supply growth will likely remain muted in the coming 10 years.

The excess demand environment for copper is no longer a forecast, but a reality over the past five years (Figure 8). Global copper mining output has stalled around 22 million ton a year, whereas refined copper demand has accelerated despite weak Chinese economy amid the green transition and infrastructure-related stimulus in the U.S. and Europe (Figure 9). To meet demand, the world is increasingly reliant on the recycling of copper from used electronics and appliances. Global copper production from recycling amounts to 3.4 million ton in 2018, equivalent to 15% of global annual refined copper production. This has risen to 5.2 million ton last year, or 19% of total production. Given the higher copper prices, lower mining ore grade, and supply constraints, copper recycling business will likely see an increase in yield in the coming years.

U.S. Equity: Time to Deliver (On Earnings)
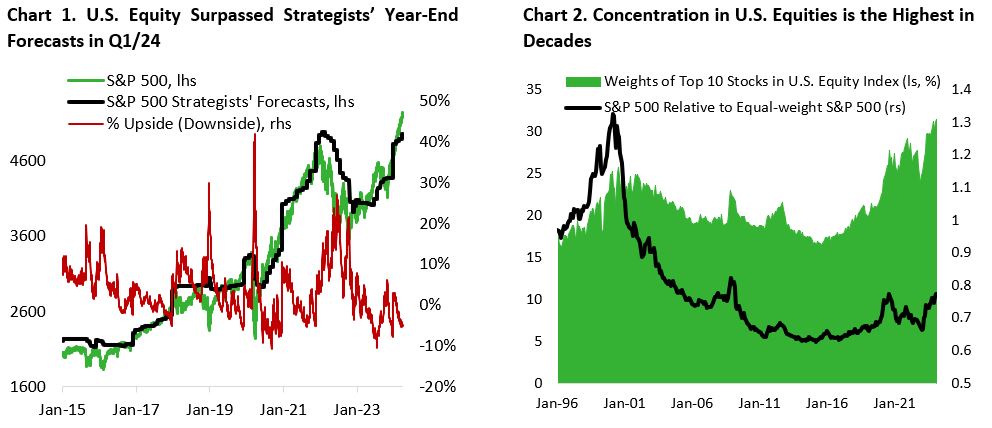
Following the bottom in October 2023, the U.S. equity market has entered another bull market as it rose over 25% in a span of less than six months, trouncing the performance of Canadian and international equity market, which gained 17% and 21%, respectively. The steady climb higher in equities has also been relatively painless, with pace and volatility that surprised many. Sell side strategists were forced to raise their year-end target higher as the S&P 500 surpassed most strategists’ target even before the quarter ended (Chart 1), while the VIX index stayed below 16 in Q1/24.
With the U.S. GDP growth being revised upward and the labour market doing better than expected, it is perhaps unsurprising that investors have turned bullish on stocks and bid market darlings higher. The leaders in the year-to-date equity rally have not changed much from the past year. Tailwind from AI continue to benefit the semiconductor hardware, software & services industry, with the subsectors significantly outperforming the broader benchmark. Given that the AI tailwinds are benefitting incumbents with the largest troves of user data and infrastructure, the outperformance of mega-cap tech stocks is translating into a significantly higher concentration in the U.S. equity index (Chart 2). And it may be here to stay, given that revenue for the Magnificent 7 stocks – Microsoft, Apple, Alphabet, Amazon, Netflix, Meta and Tesla – is expected to grow at a higher rate compared to the rest of the S&P 500 index, with the former expected to grow 12% annually over the next two years vs 3% for the latter.
With the U.S. equity market trading at 21 times forward earnings at the end of the first quarter and multiple expansion contributing to 21% of the 37% gain in S&P 500 since January 2023, forward earnings growth expectation is high. During the previous earnings season, companies that missed their estimates saw their stock price fell by more while those that beat were less rewarded. Currently, sell-side analysts are expecting earnings per share for the S&P 500 to rise to $242.94 at the end of FY24 – a 9.7% increase from 2023 – followed by another 12.2% increase in FY25. This compares to a historical average of 6.5% annualized earnings growth following the global financial crisis. Elevated earnings growth expectations and rich valuation historically do not bode well for the subsequent returns of stocks.
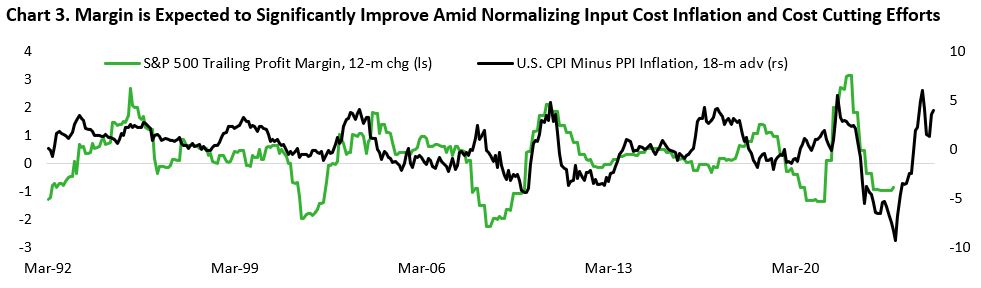
There are, however, reasons to be optimistic. First, raw material cost and wage inflation have been declining, which should translate to lower input and operational cost for many companies. Second, companies have been proactive in improving operational efficiency through cost cutting efforts and trimming some of their workforce, which is also a tailwind for profit margin (Chart 3). Third, the price hikes done over the past three years have not translated to material reduction in volume, mainly because wages have risen alongside CPI inflation, excess savings have been drained only among households in the 0-50th income percentile, and the overall job market remains in a healthy state. In addition, the improving outlook for the manufacturing sector could mean that even if consumer spending weakens further, the cyclical part of U.S. economy could start to pick up – translating to rotation into sectors that experienced significant slowdown and have lagged over the past two years. As the probability of soft landing has increased significantly over the past one year, the outlook for stocks beyond the AI beneficiaries are also improving. For instance, many stocks in the energy, utilities, and consumer staples sectors are trading at valuation below their historical averages and provide an attractive dividend and buyback yield.
And although valuation across U.S. sectors screen expensive on a market-cap weight basis, with 7 out of 10 sectors’ (excluding real estate) forward P/E ratio trading at above 80th percentile, the median stock’s valuation in each sector may not be as expensive (Chart 4). This is most prominent in the consumer staples sector, where the market-cap weight sector P/E valuation is trading at 71st percentile but the median stock valuation is below 50th percentile (cheap).

The bottom line is that U.S. equities may continue to deliver if the current high expectation on earnings growth is met by companies. With economic growth being much more resilient than previously thought, the outlook for stocks outside the technology sector is also improving, which may translate to the broadening of current equity rally. Lastly, valuation gap between the largest stocks in a sector with their peers is providing opportunities for active managers to be more selective in their stock selection and diversify away from the highly concentrated U.S. market today.
Copyright © 2024, Putamen Capital. All rights reserved.
The information, recommendations, analysis and research materials presented in this document are provided for information purposes only and should not be considered or used as an offer or solicitation to sell or buy financial securities or other financial instruments or products, nor to constitute any advice or recommendation with respect to such securities, financial instruments or products. The text, images and other materials contained or displayed on any Putamen Capital products, services, reports, emails or website are proprietary to Putamen Capital and should not be circulated without the expressed authorization of Putamen Capital. Any use of graphs, text or other material from this report by the recipient must acknowledge Putamen Capital as the source and requires advance authorization. Putamen Capital relies on a variety of data providers for economic and financial market information. The data used in this publication may have been obtained from a variety of sources including Bloomberg, Macrobond, CEIC, Choice, MSCI, BofA Merrill Lynch and JP Morgan. The data used, or referred to, in this report are judged to be reliable, but Putamen Capital cannot be held responsible for the accuracy of data used herein.
